The Border Gateway Protocol, or BGP, has been holding the Internet together, for more than two decades and nothing seems to be falling off the edge so far. As far as we can tell everyone can still see everyone else, assuming that they want to be seen, and the distributed routing system appears to be working smoothly. All appears to be working within reasonable parameters, and there is no imminent danger of some routing catastrophe, as far as we can tell. For a protocol designed some 25 years ago, when the Internet of that time contained some 10,000 constituent networks, its done well to scale fifty-fold, to carry in excess of half a million routed elements by the end of 2014.
If BGP is scaling so effectively, then why should we be interested in BGP? Isn’t this just a classic case of “Nothing to see here, move along?â€
One cause for concern is the inexorable growth of the Internet’s routing system. Does this constant growth in routing imply that our routing system is growing faster than our capacity to afford ever larger and faster routers, assuming of course that we can keep on building ever larger and faster routers in the first place?
Here’s some possible reasons why an analysis of BGP can be useful for folk in the Internet business.
For the ISP network operator, this information may be help in figuring out how big a router should you buy today if you want it to cope with the full BGP routing load in 3 – 5 years time. Perhaps you might want to understand what FIB size is necessary in that time, and what level of TCAM size might be appropriate, in which case you may want to have a conservative estimate of the anticipated number of entries in the routing table over that period.
The same consideration applies to a vendor of routing equipment: How big a router should a vendor build to cope with the BGP load over the next 3 – 5 years? What growth factors for the routing system should be added into the product design phase? What are the Internet’s scaling factors at play here?
The BGP Measurement Environment
In trying to analyse long baseline data series the ideal approach is to keep as much of the local data gathering environment as stable as possible. In this way the changes that occur in the collected data reflect changes in the larger environment, as distinct from changes as a result of changes in the local configuration of the data collection equipment.
In this case the measurement point being used is a BGP router configured within AS131072. This AS generates no traffic and originates no routes in BGP. It’s a passive measurement point that has been logging all received BGP updates since 2007. The router is fed with a default-free eBGP feed from AS 4608, which is the APNIC network located in Australia, and AS 4777, which is the APNIC network located in Japan, for both IPv4 and IPv6 routes.
There is also no iBGP component in this particular measurement setup. While it has been asserted at various times that iBGP is a major contributor to BGP scalability concerns in BGP, the consideration here in trying to objectively measure this assertion is that there is no “standard” iBGP configuration, and each network has its own rather unique configuration of Route Reflectors and iBGP peers. This makes it hard to generate a “typical” iBGP load profile, let alone analyse the general trends in iBGP update loads over time.
In this study the scope of attention is limited to a simple eBGP configuration that is likely to be found as a “stub” AS at the edge of the Internet. This AS is not an upstream for any third party, it has no transit role, and does not have a large set of BGP peers. It’s a simple view of the routing world that I see when I sit at an edge of the Internet.
The Data
IPv4 Routing Table
The following figures show some of the vital statistics for IPv4 in BGP since the start of 2010 to the end of 2014.
Figure 1 shows the total number of routes in the routing table over this period. This is a classic “up and to the right” Internet trajectory, but it should be noted that the days exponential growth that doubled every year are over. The growth elements in the Internet today are more strongly aligned to a far more modest linear growth model.
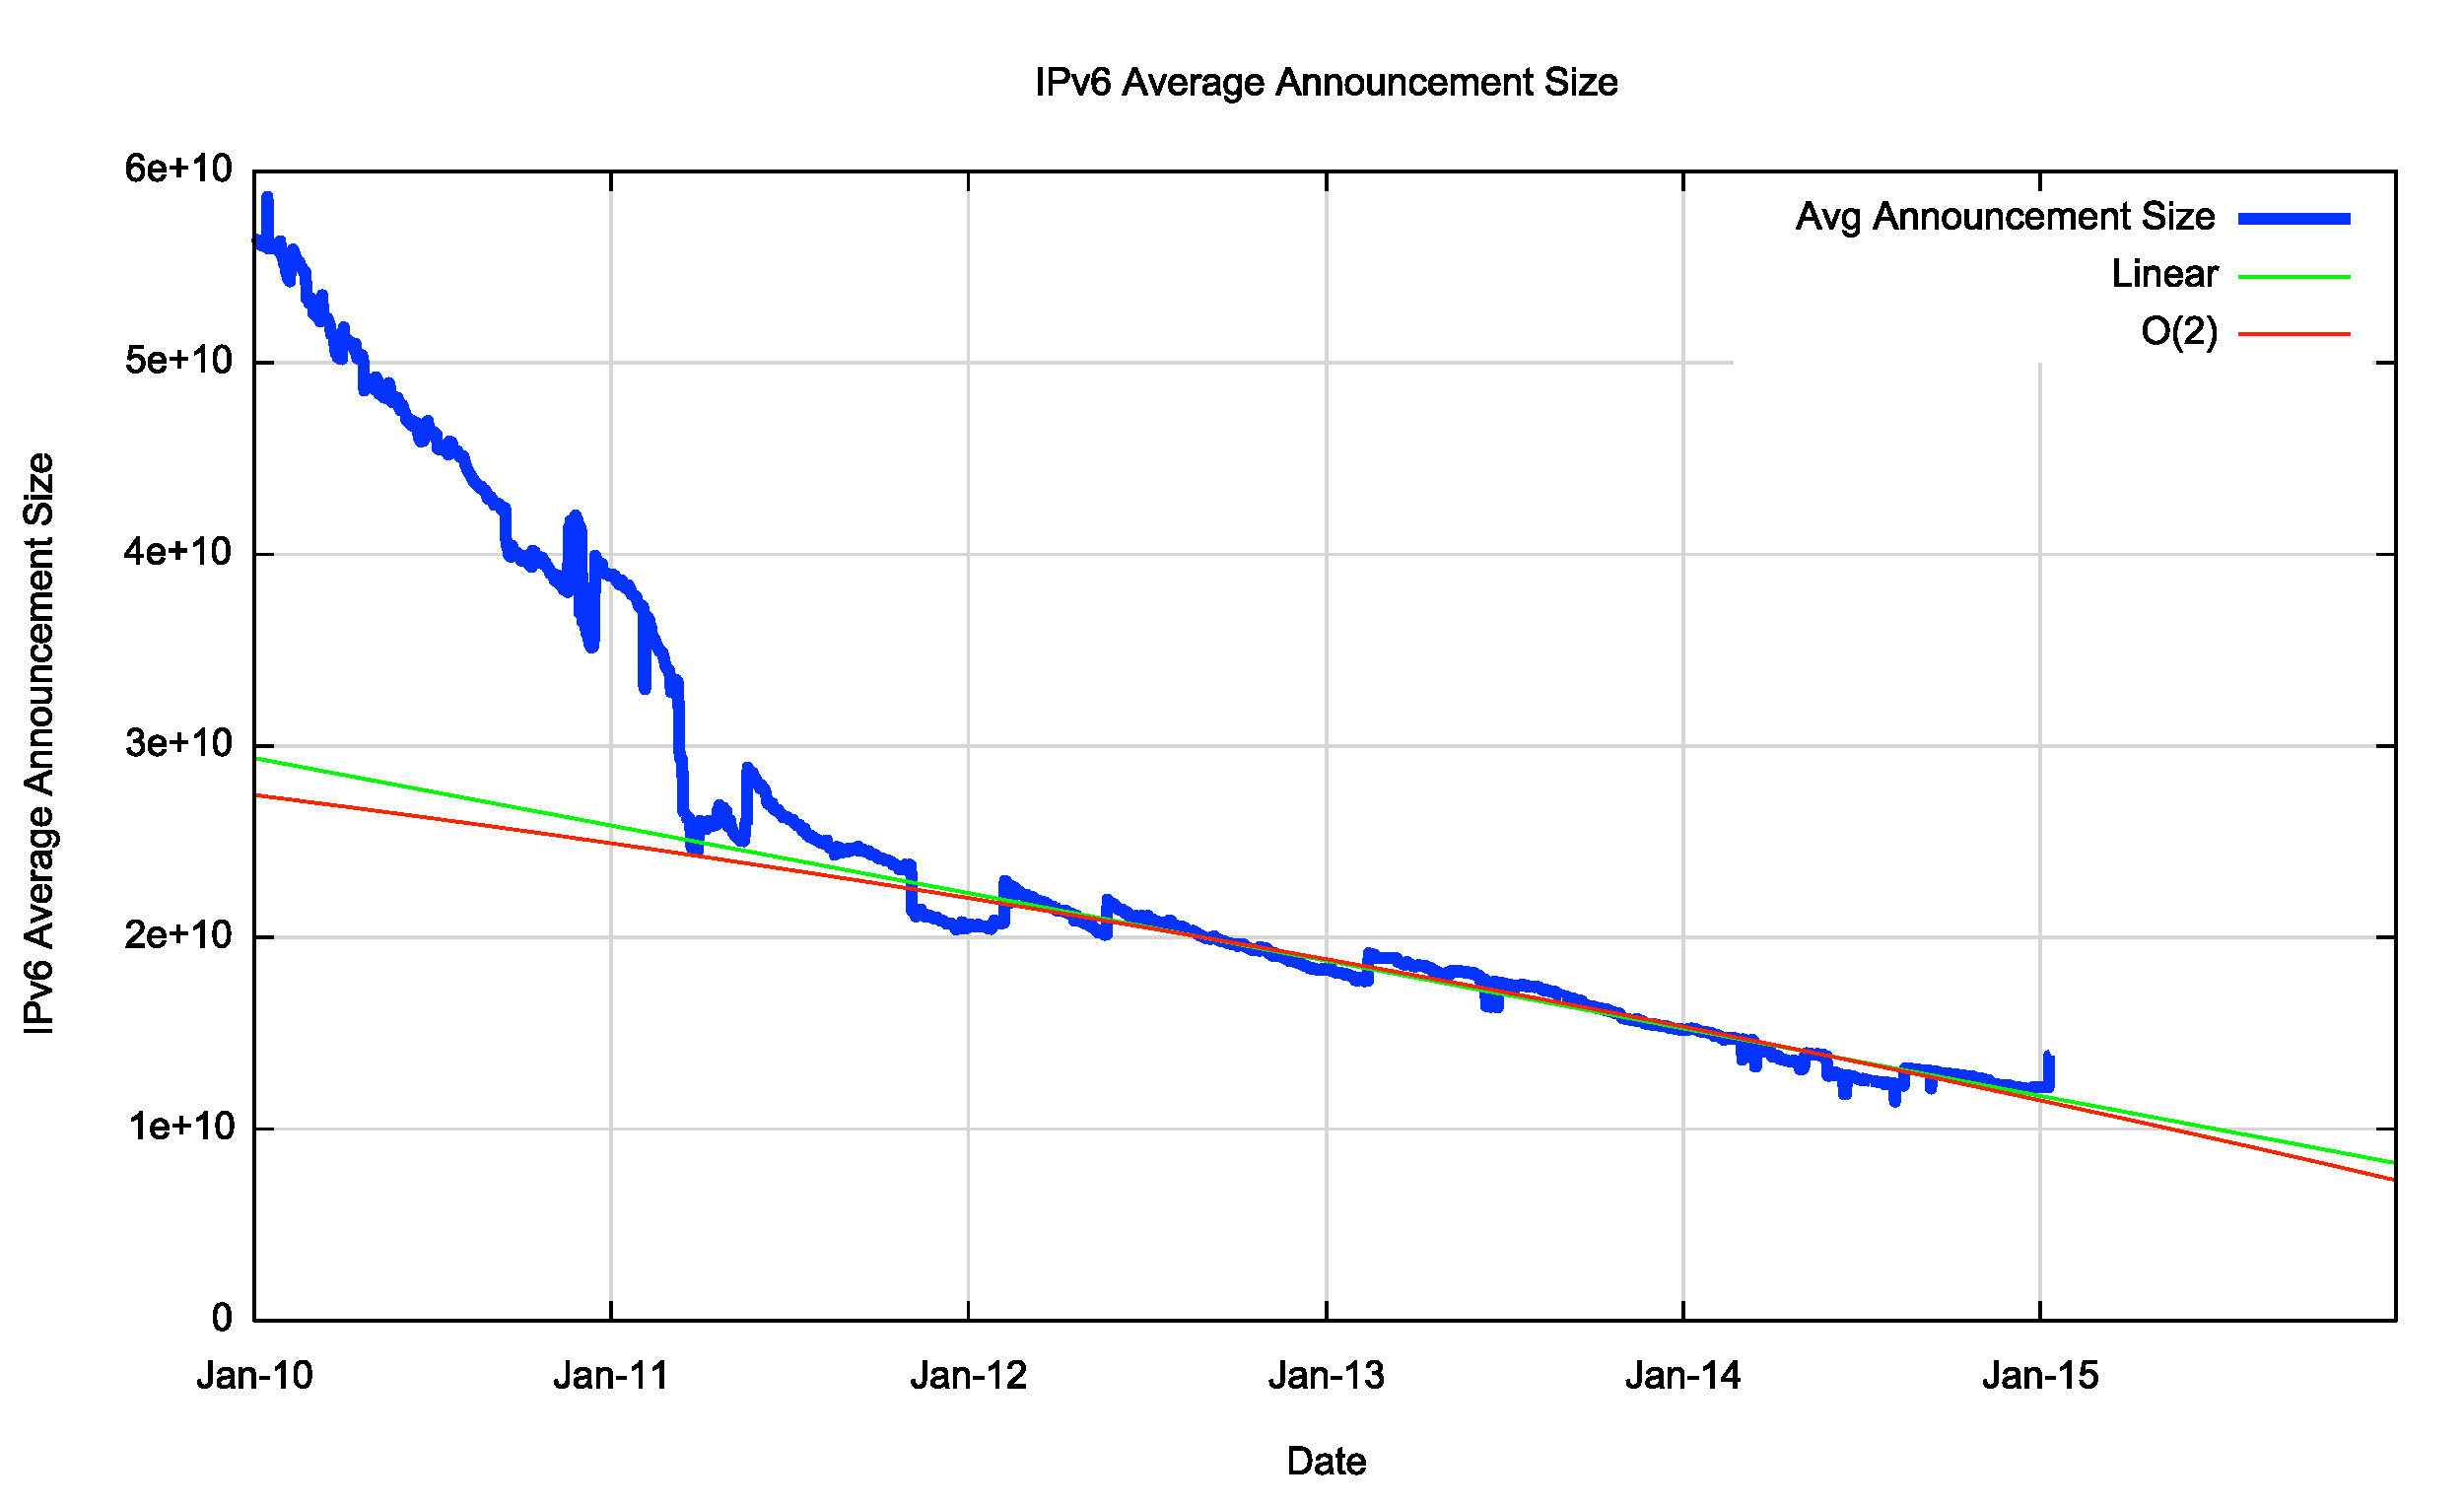
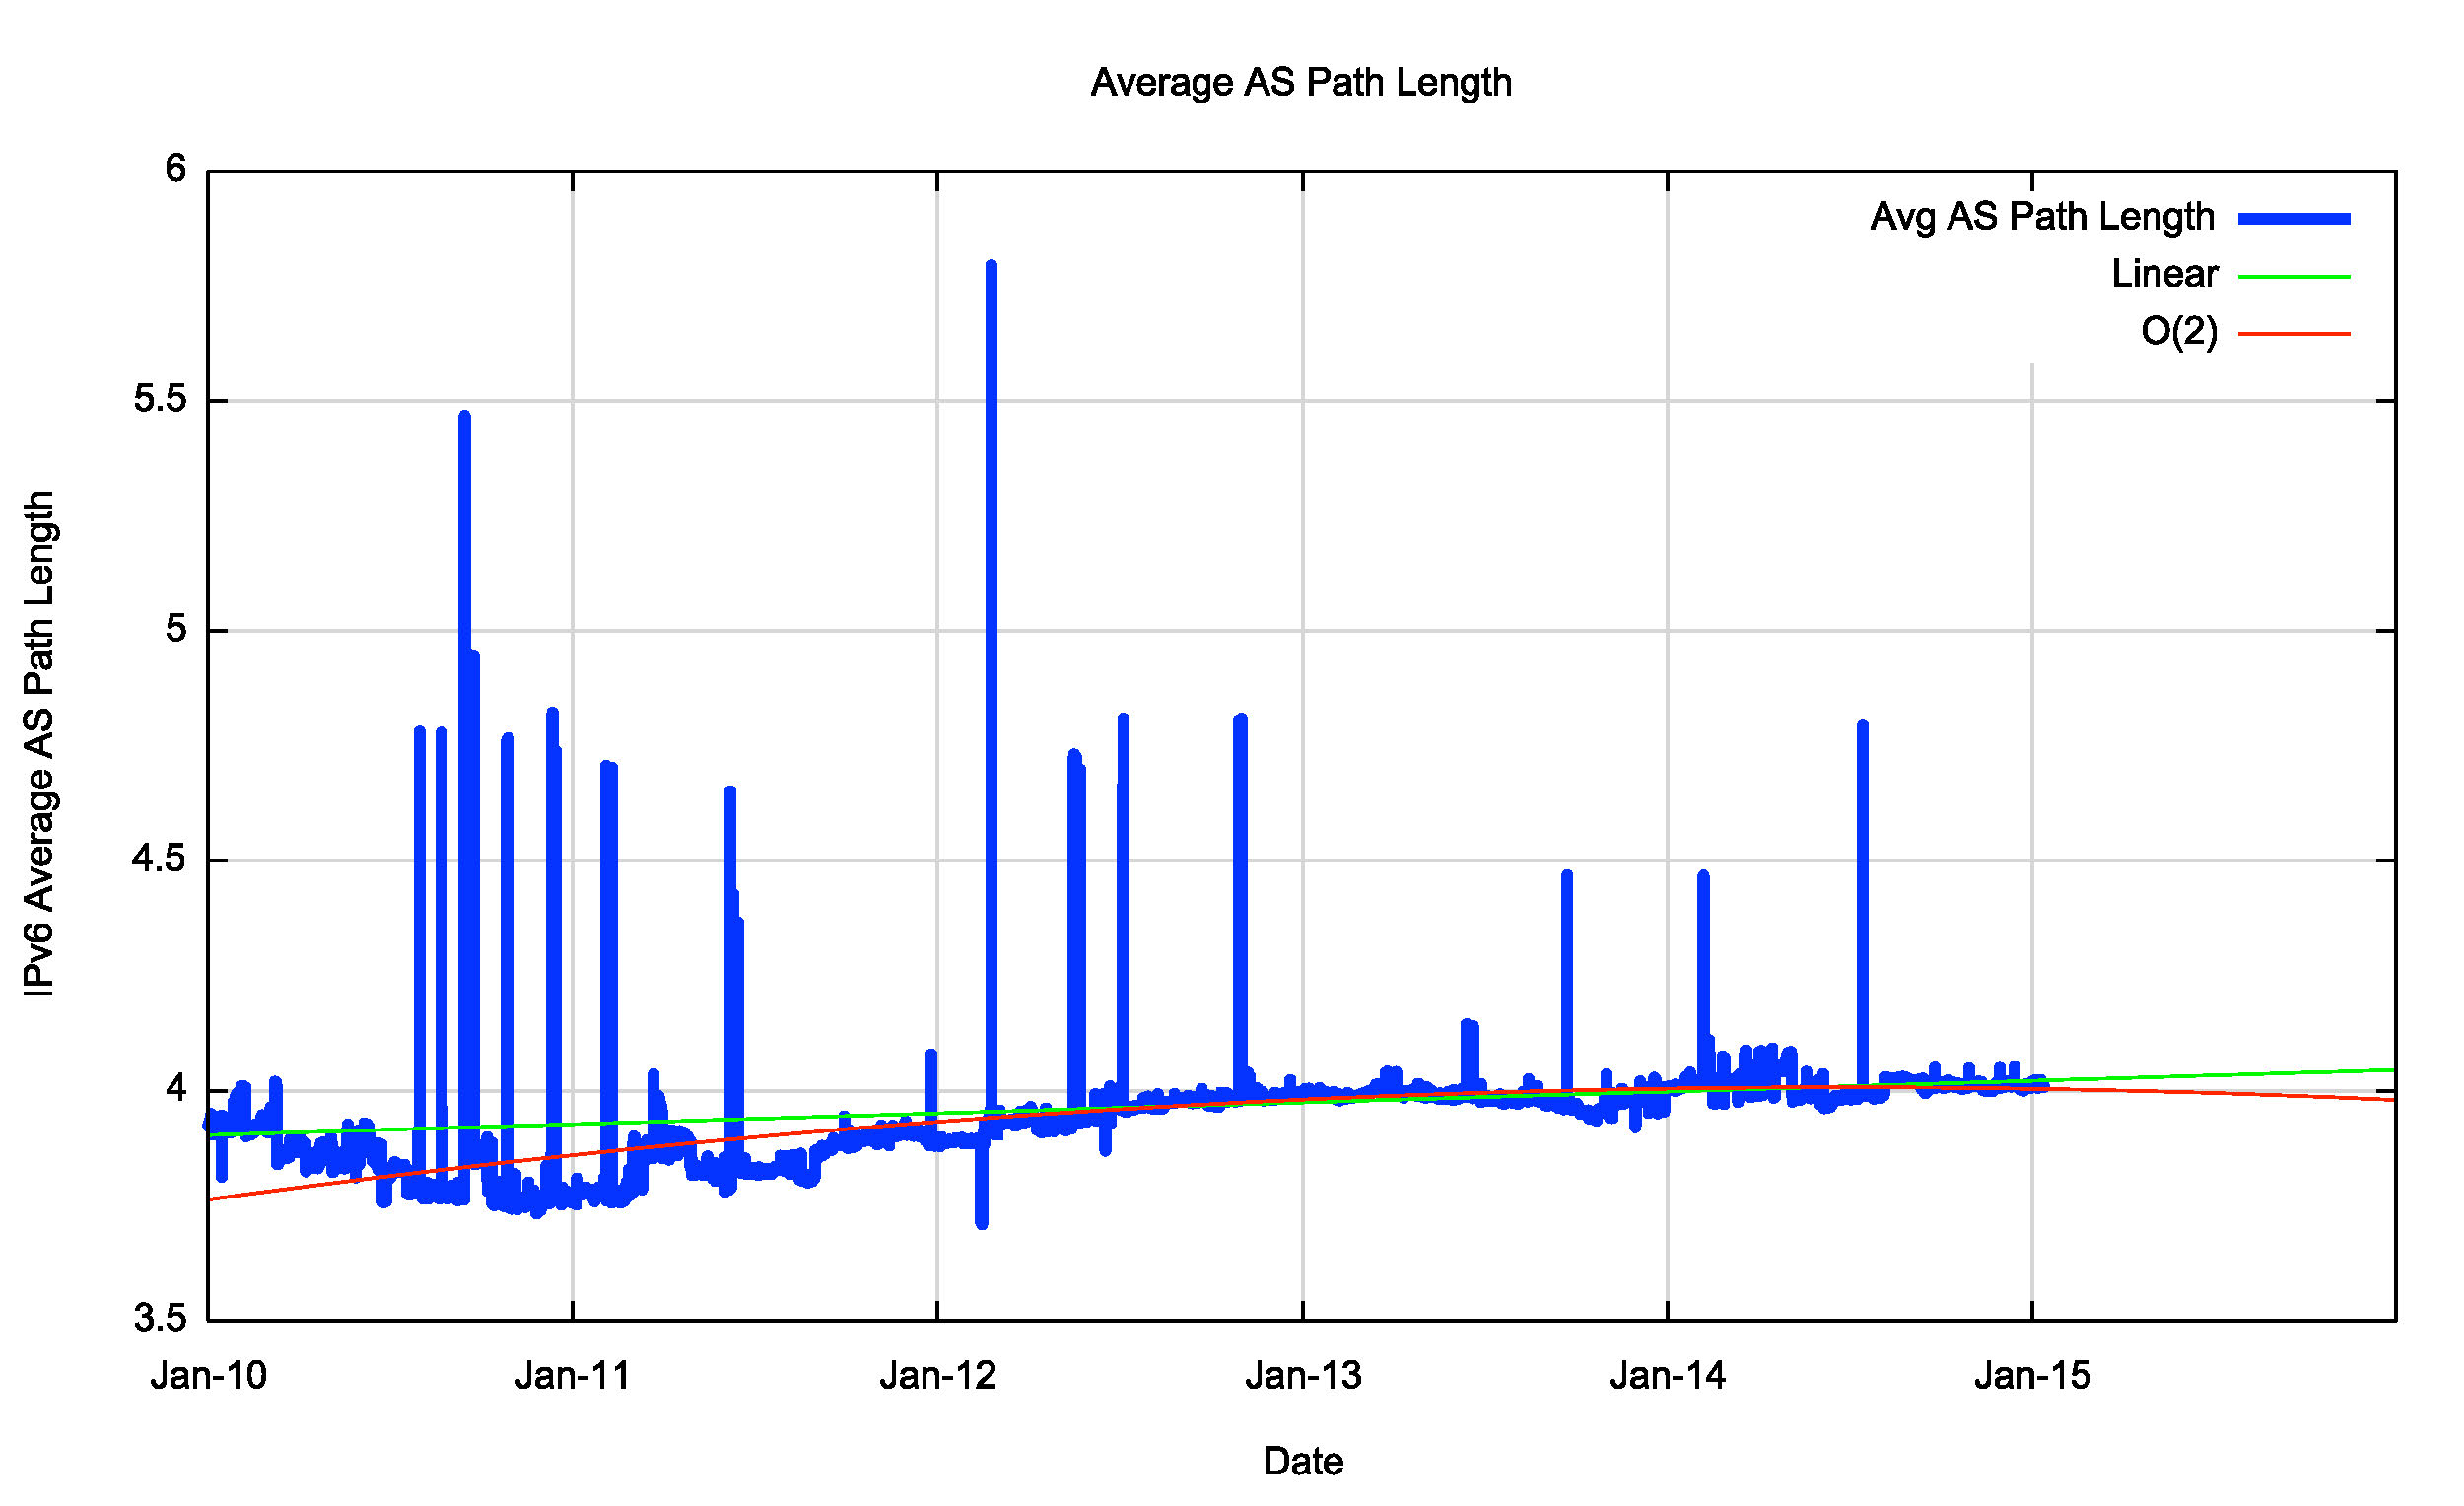
Over this period from January 2011 to December 2014 we had the exhaustion of the IPv4 address space pools in APNIC in April 2011 (serving the Asia Pacific region), in the RIPE NCC in September 2012 (serving Europe and the Middle East) and in LACNIC (serving Latin America and the Caribbean) in May 2014. The four year period since the start of 2011 has seen the span of addresses advertised in the routing system slowing down (Figure 5). However, at the same time there has been a consistent level of growth in the number of entries in the routing table over the 2011 – 2014 period. The result of these two factors is that the average announcement in the IPv4 routing table is spanning fewer addresses, or, to put it another way, the granularity of the IPv4 routing space is getting finer. As Figure 4 shows, the average BGP announcement size has dropped from 7,000 host addresses at the start of 2010 to 5,100 addresses at the end of 2014. While /24 announcements are steady at a little over 50%, the relative number of /22 announcements is increasing, while the relative number of larger announcements, including up to /21s are decreasing. The topology of the network has remained relatively consistent, with the growth in the Internet being seen as increasing density of interconnectivity, rather than through extending transit paths, so the average AS path length has remained relatively constant, between 3.3 and 3.5 for this period (Figure 6).
|
|
|
|
|
|
|
|
|
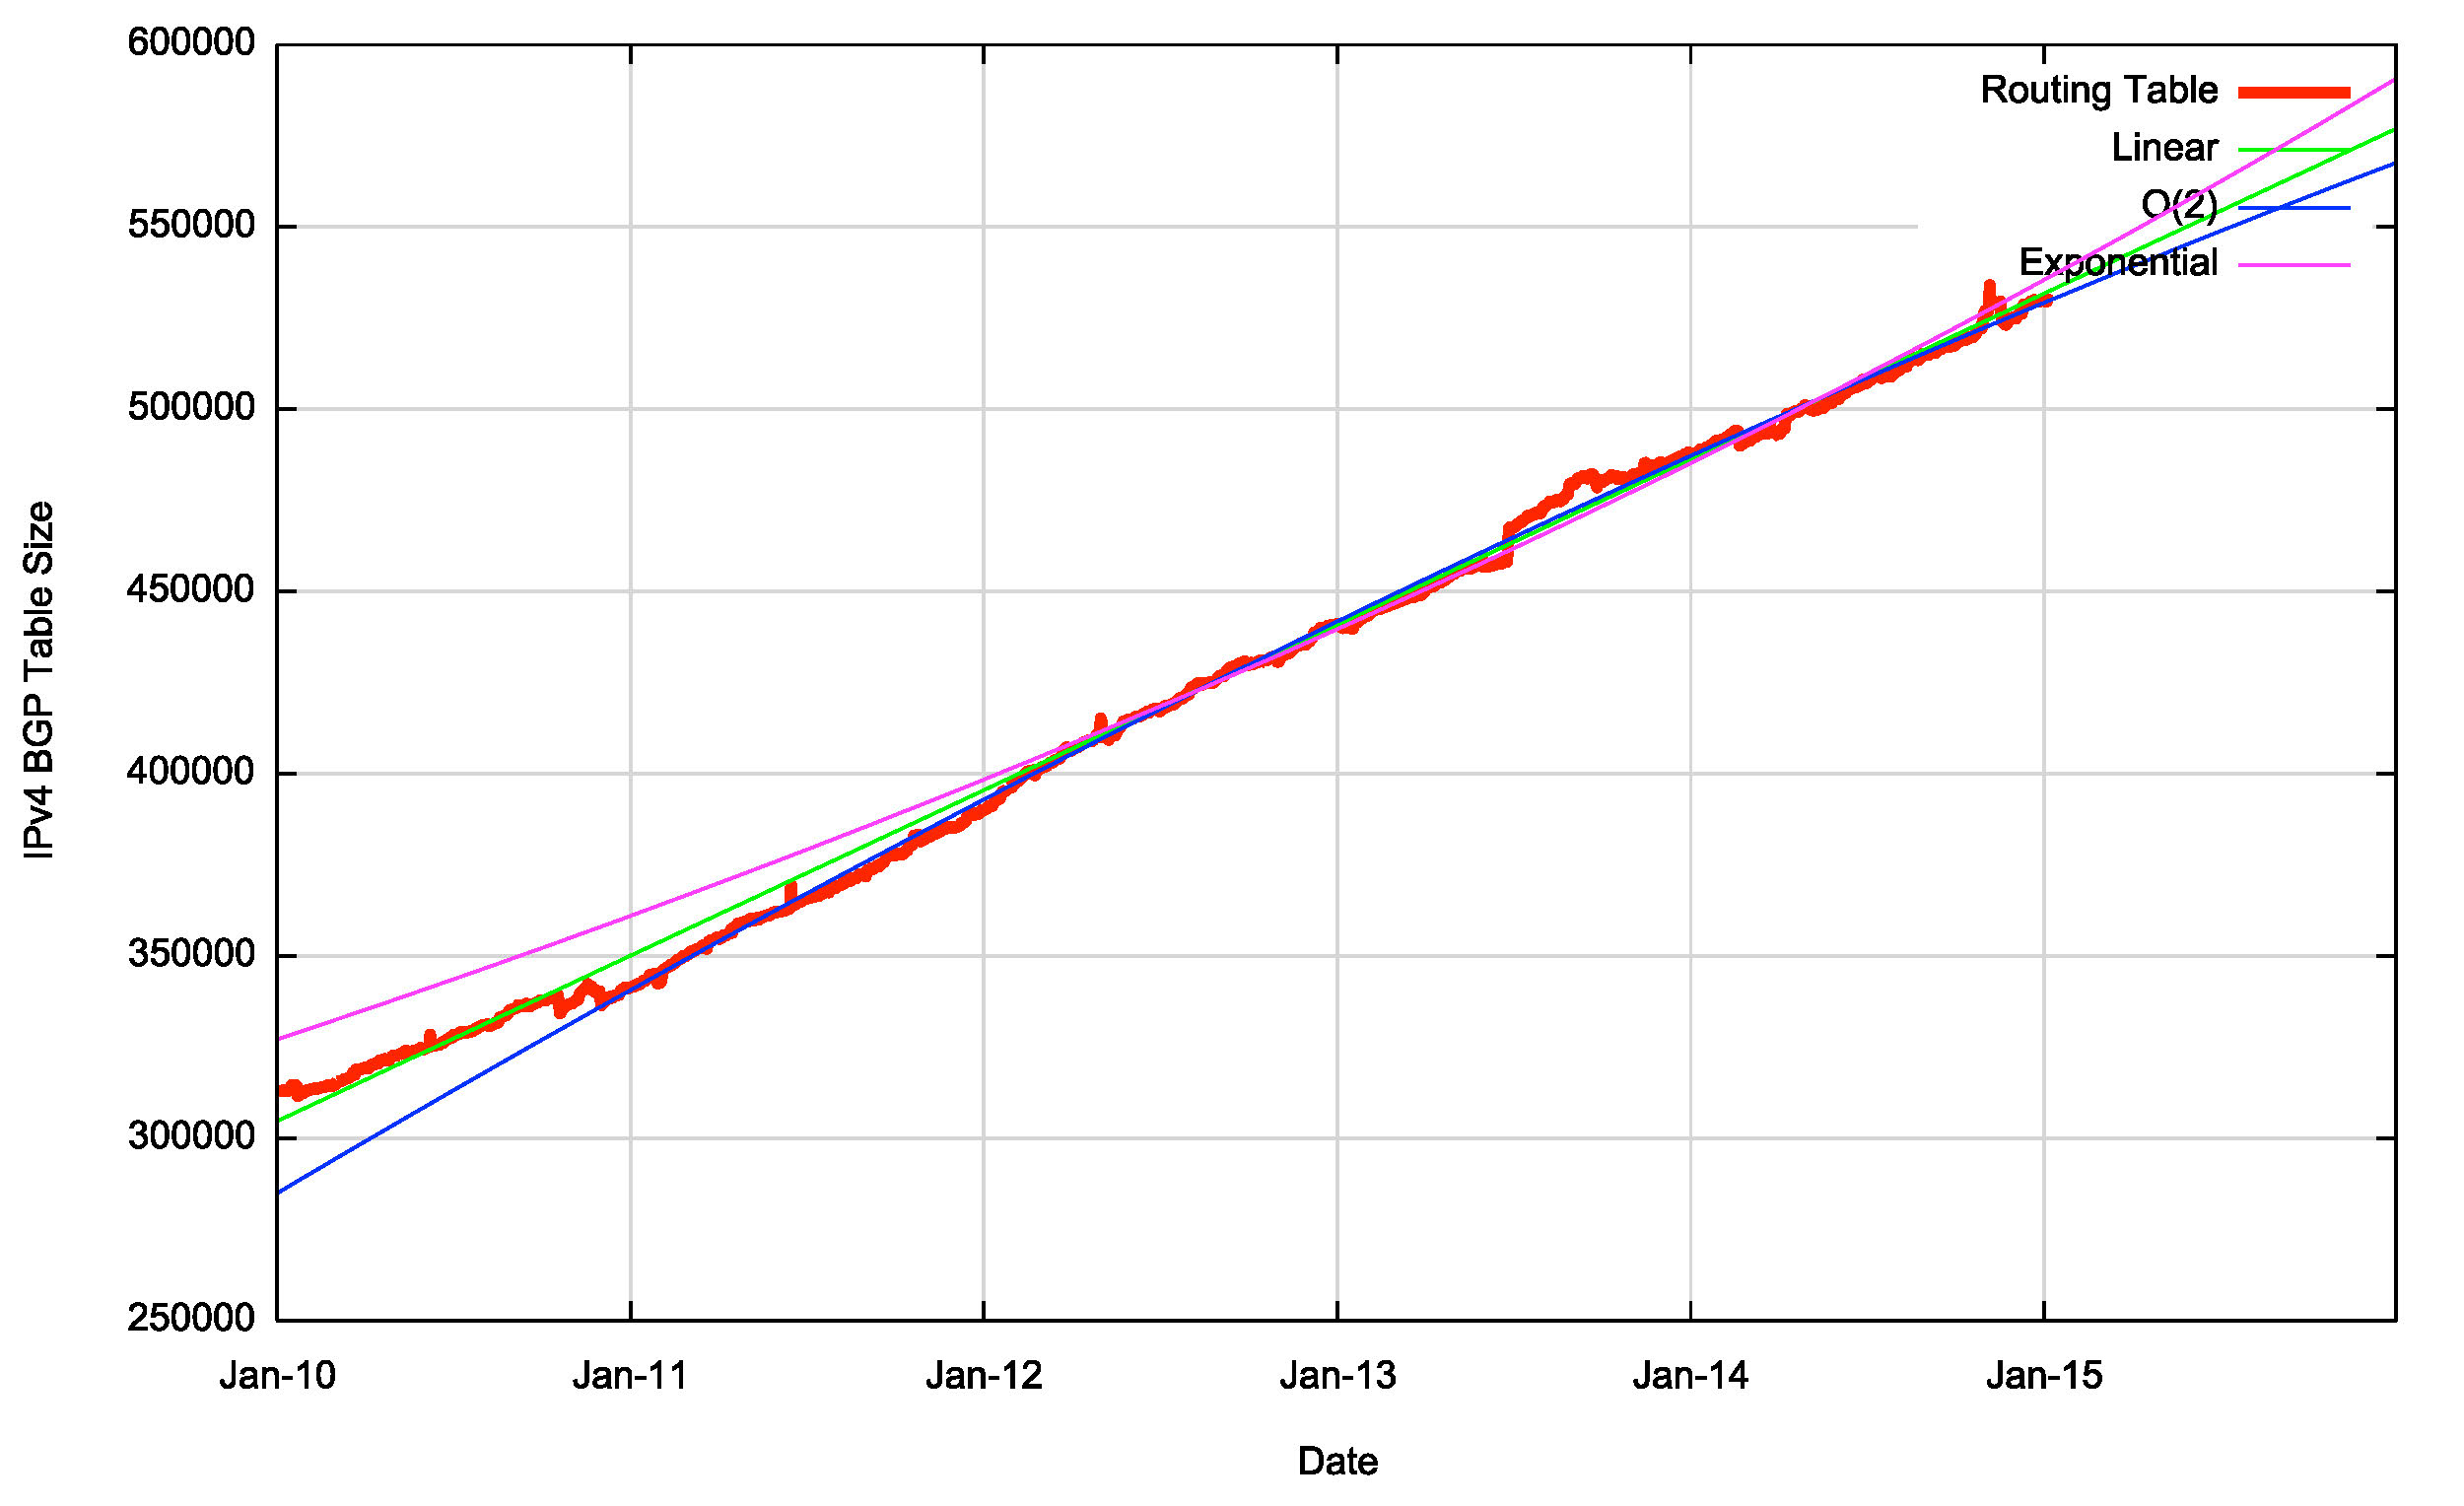
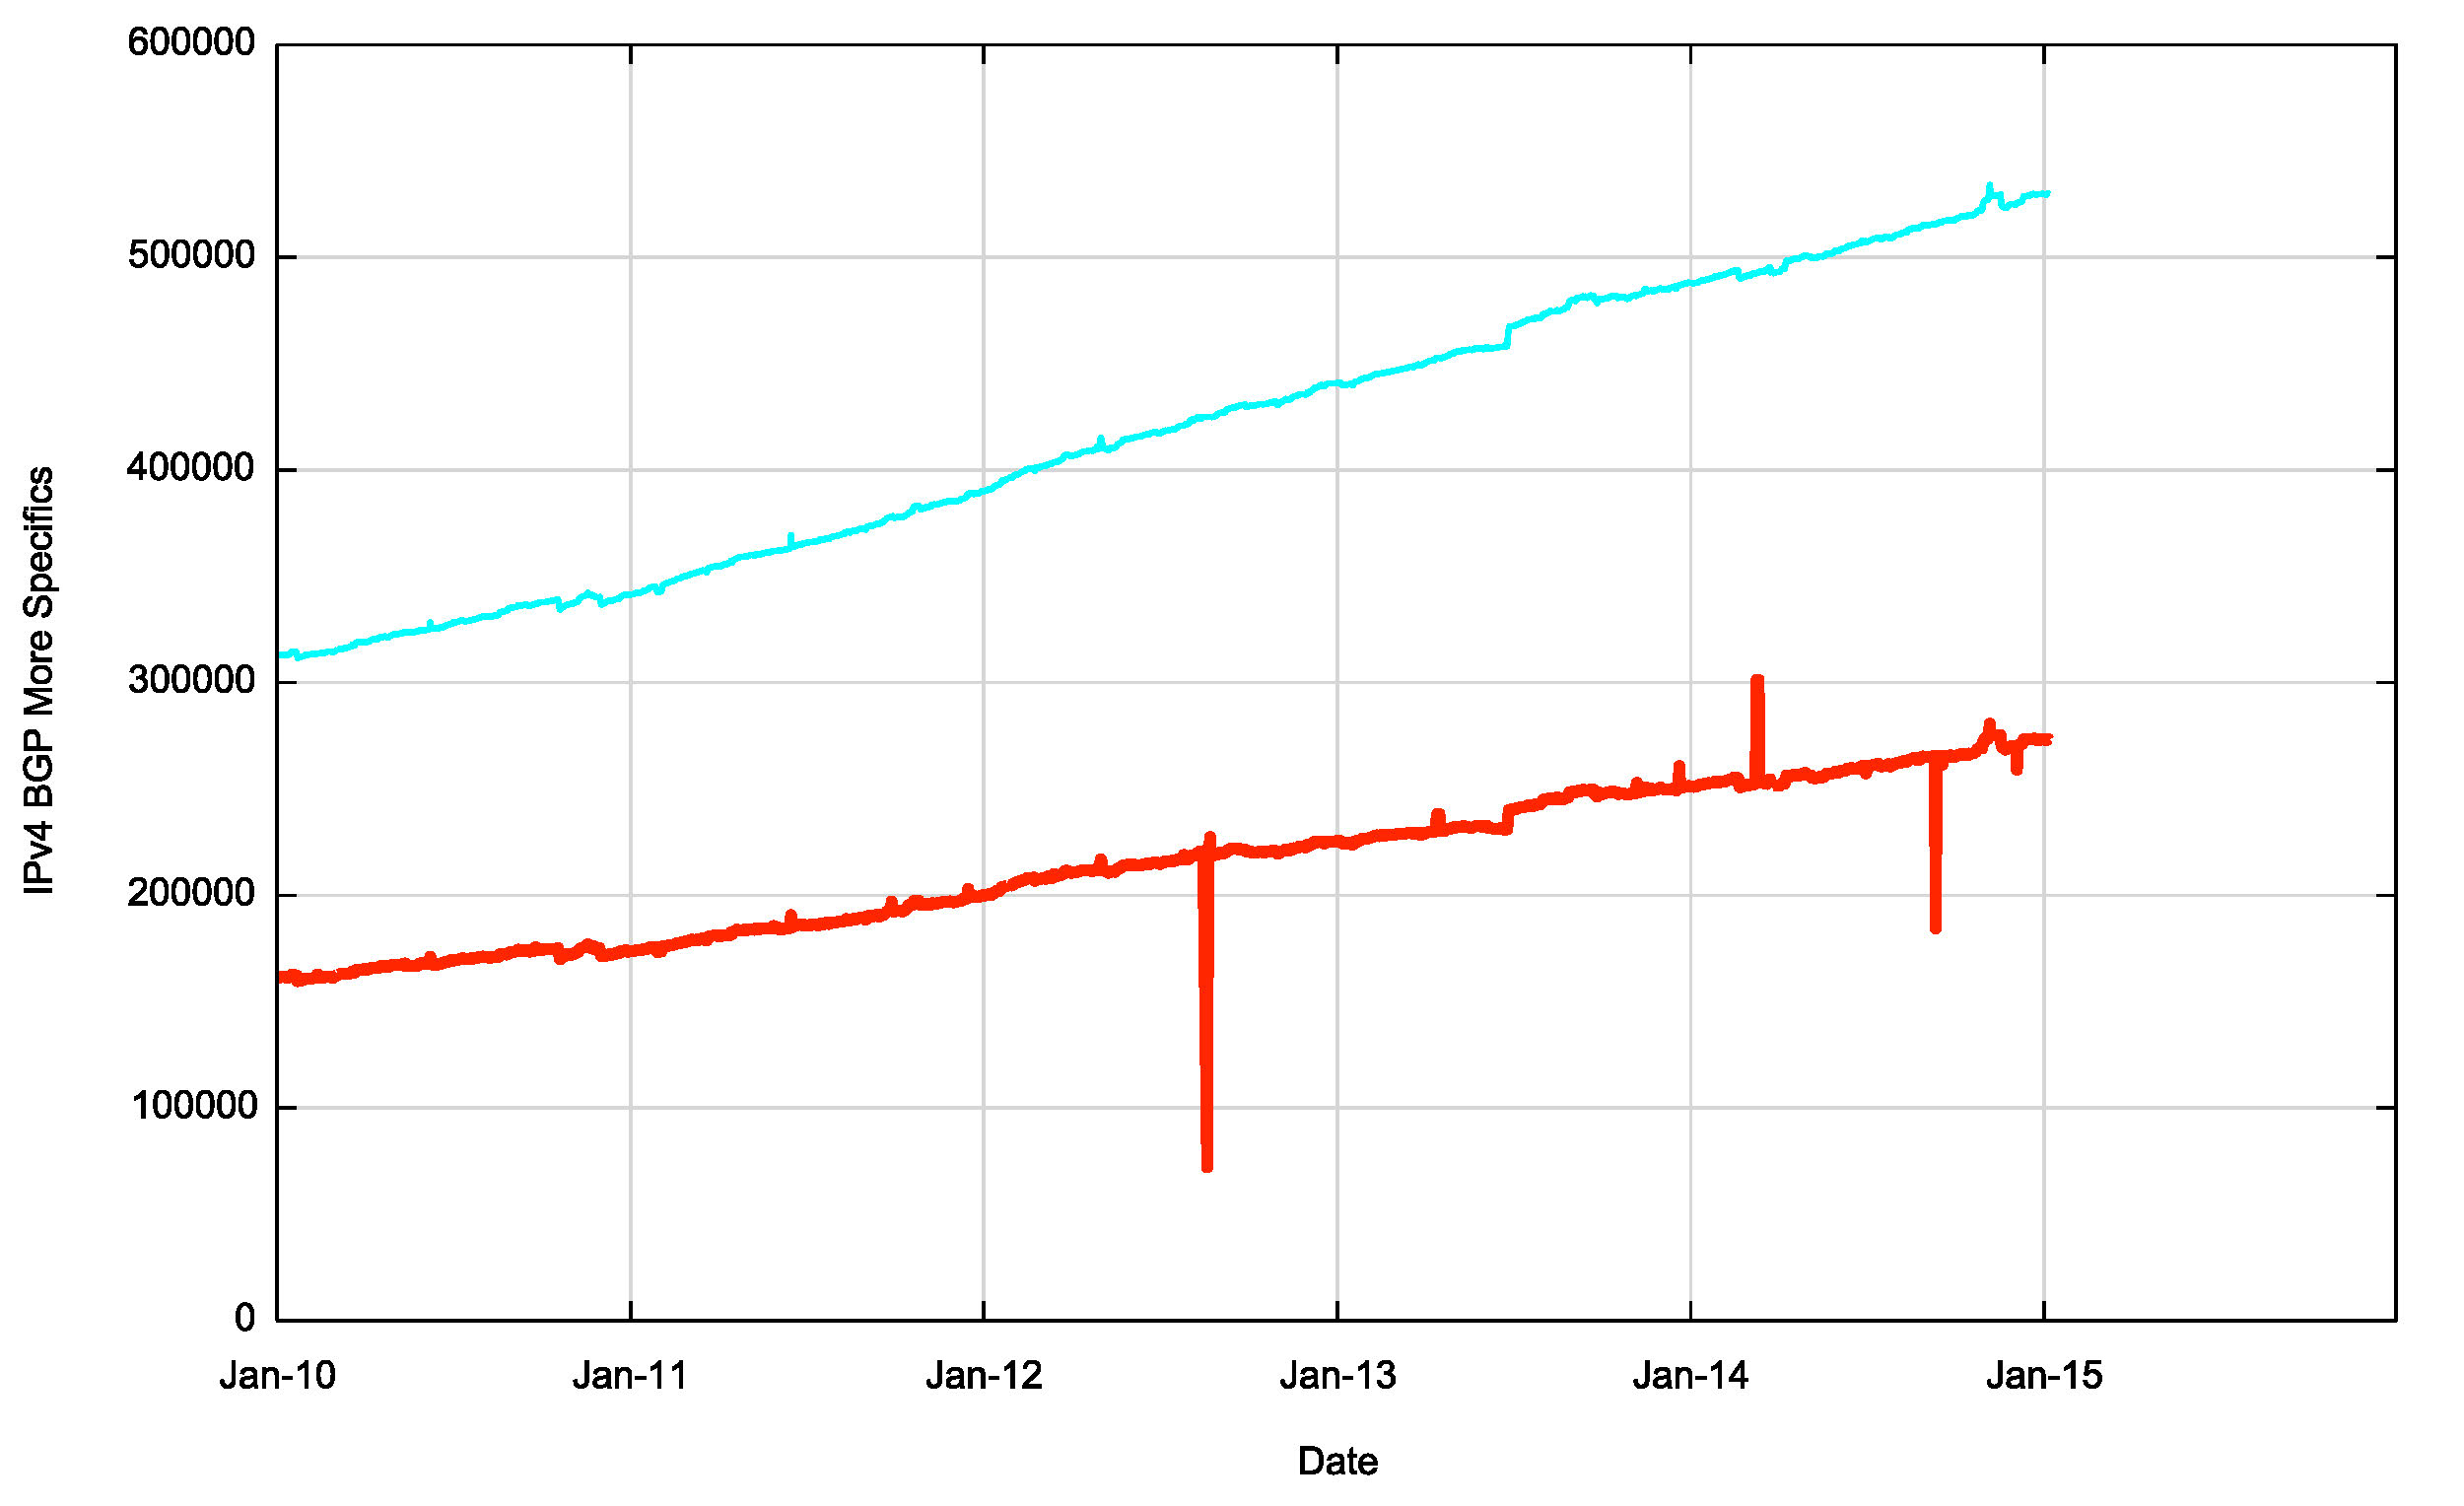
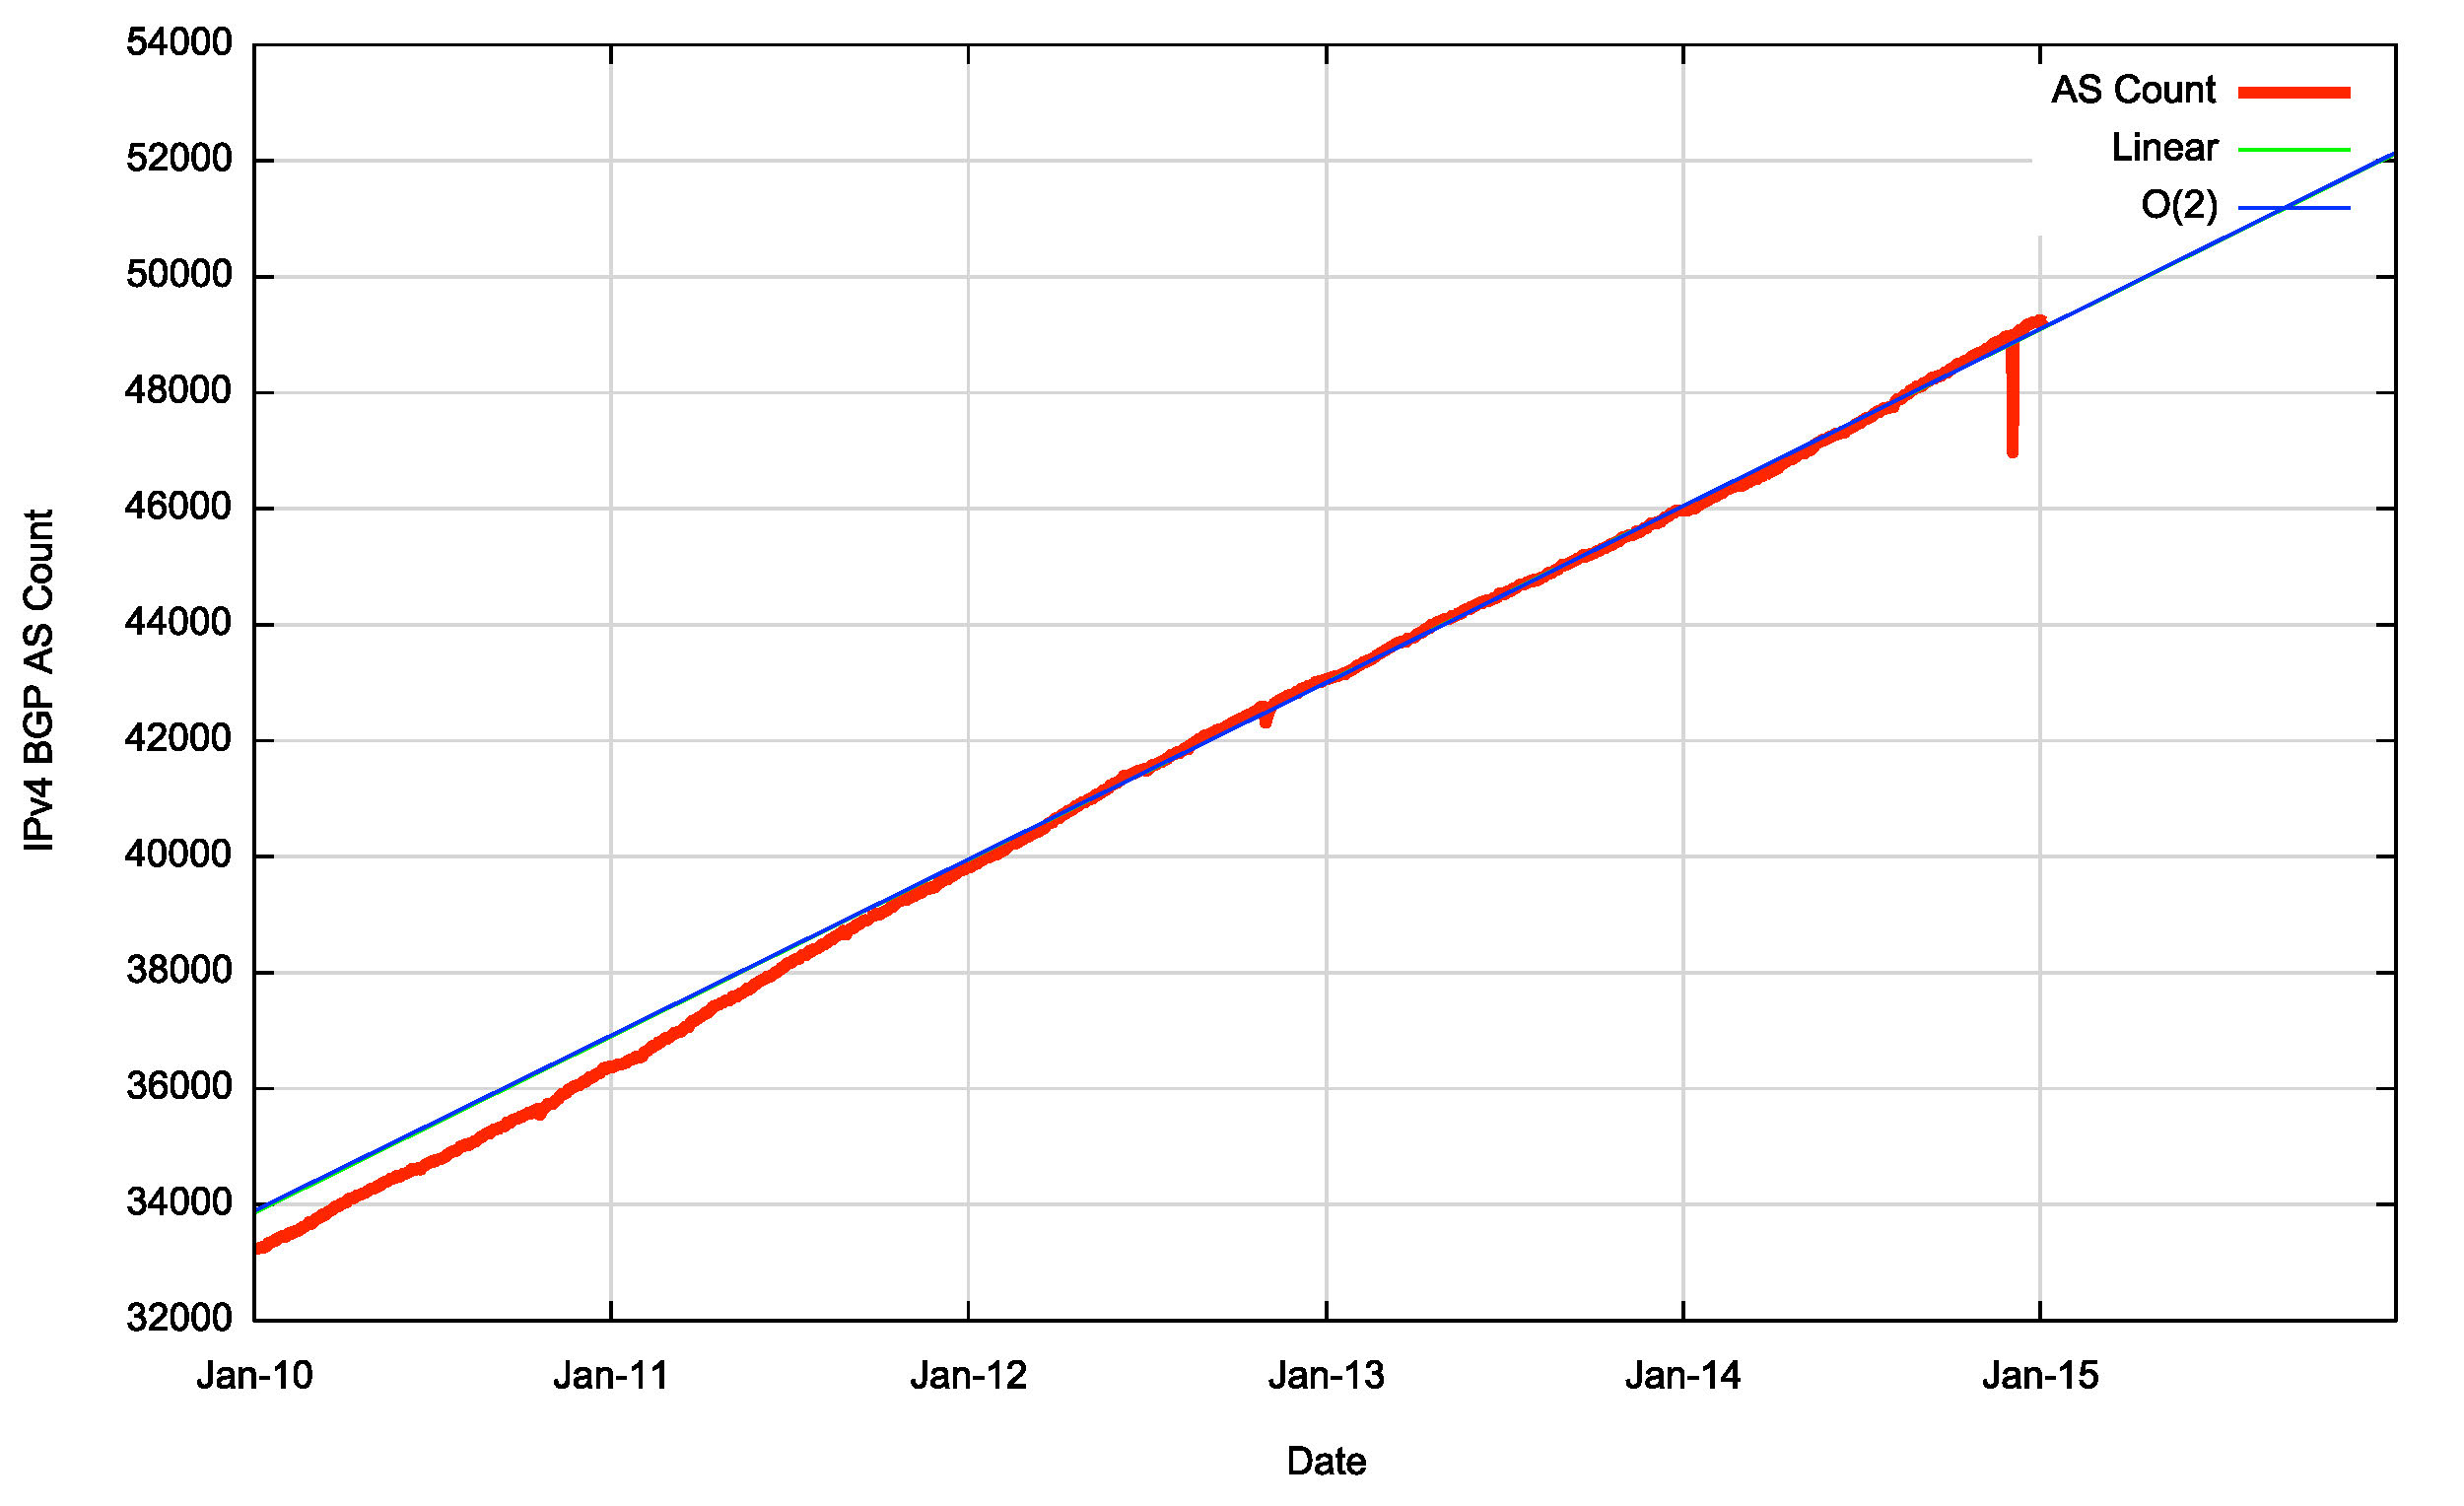
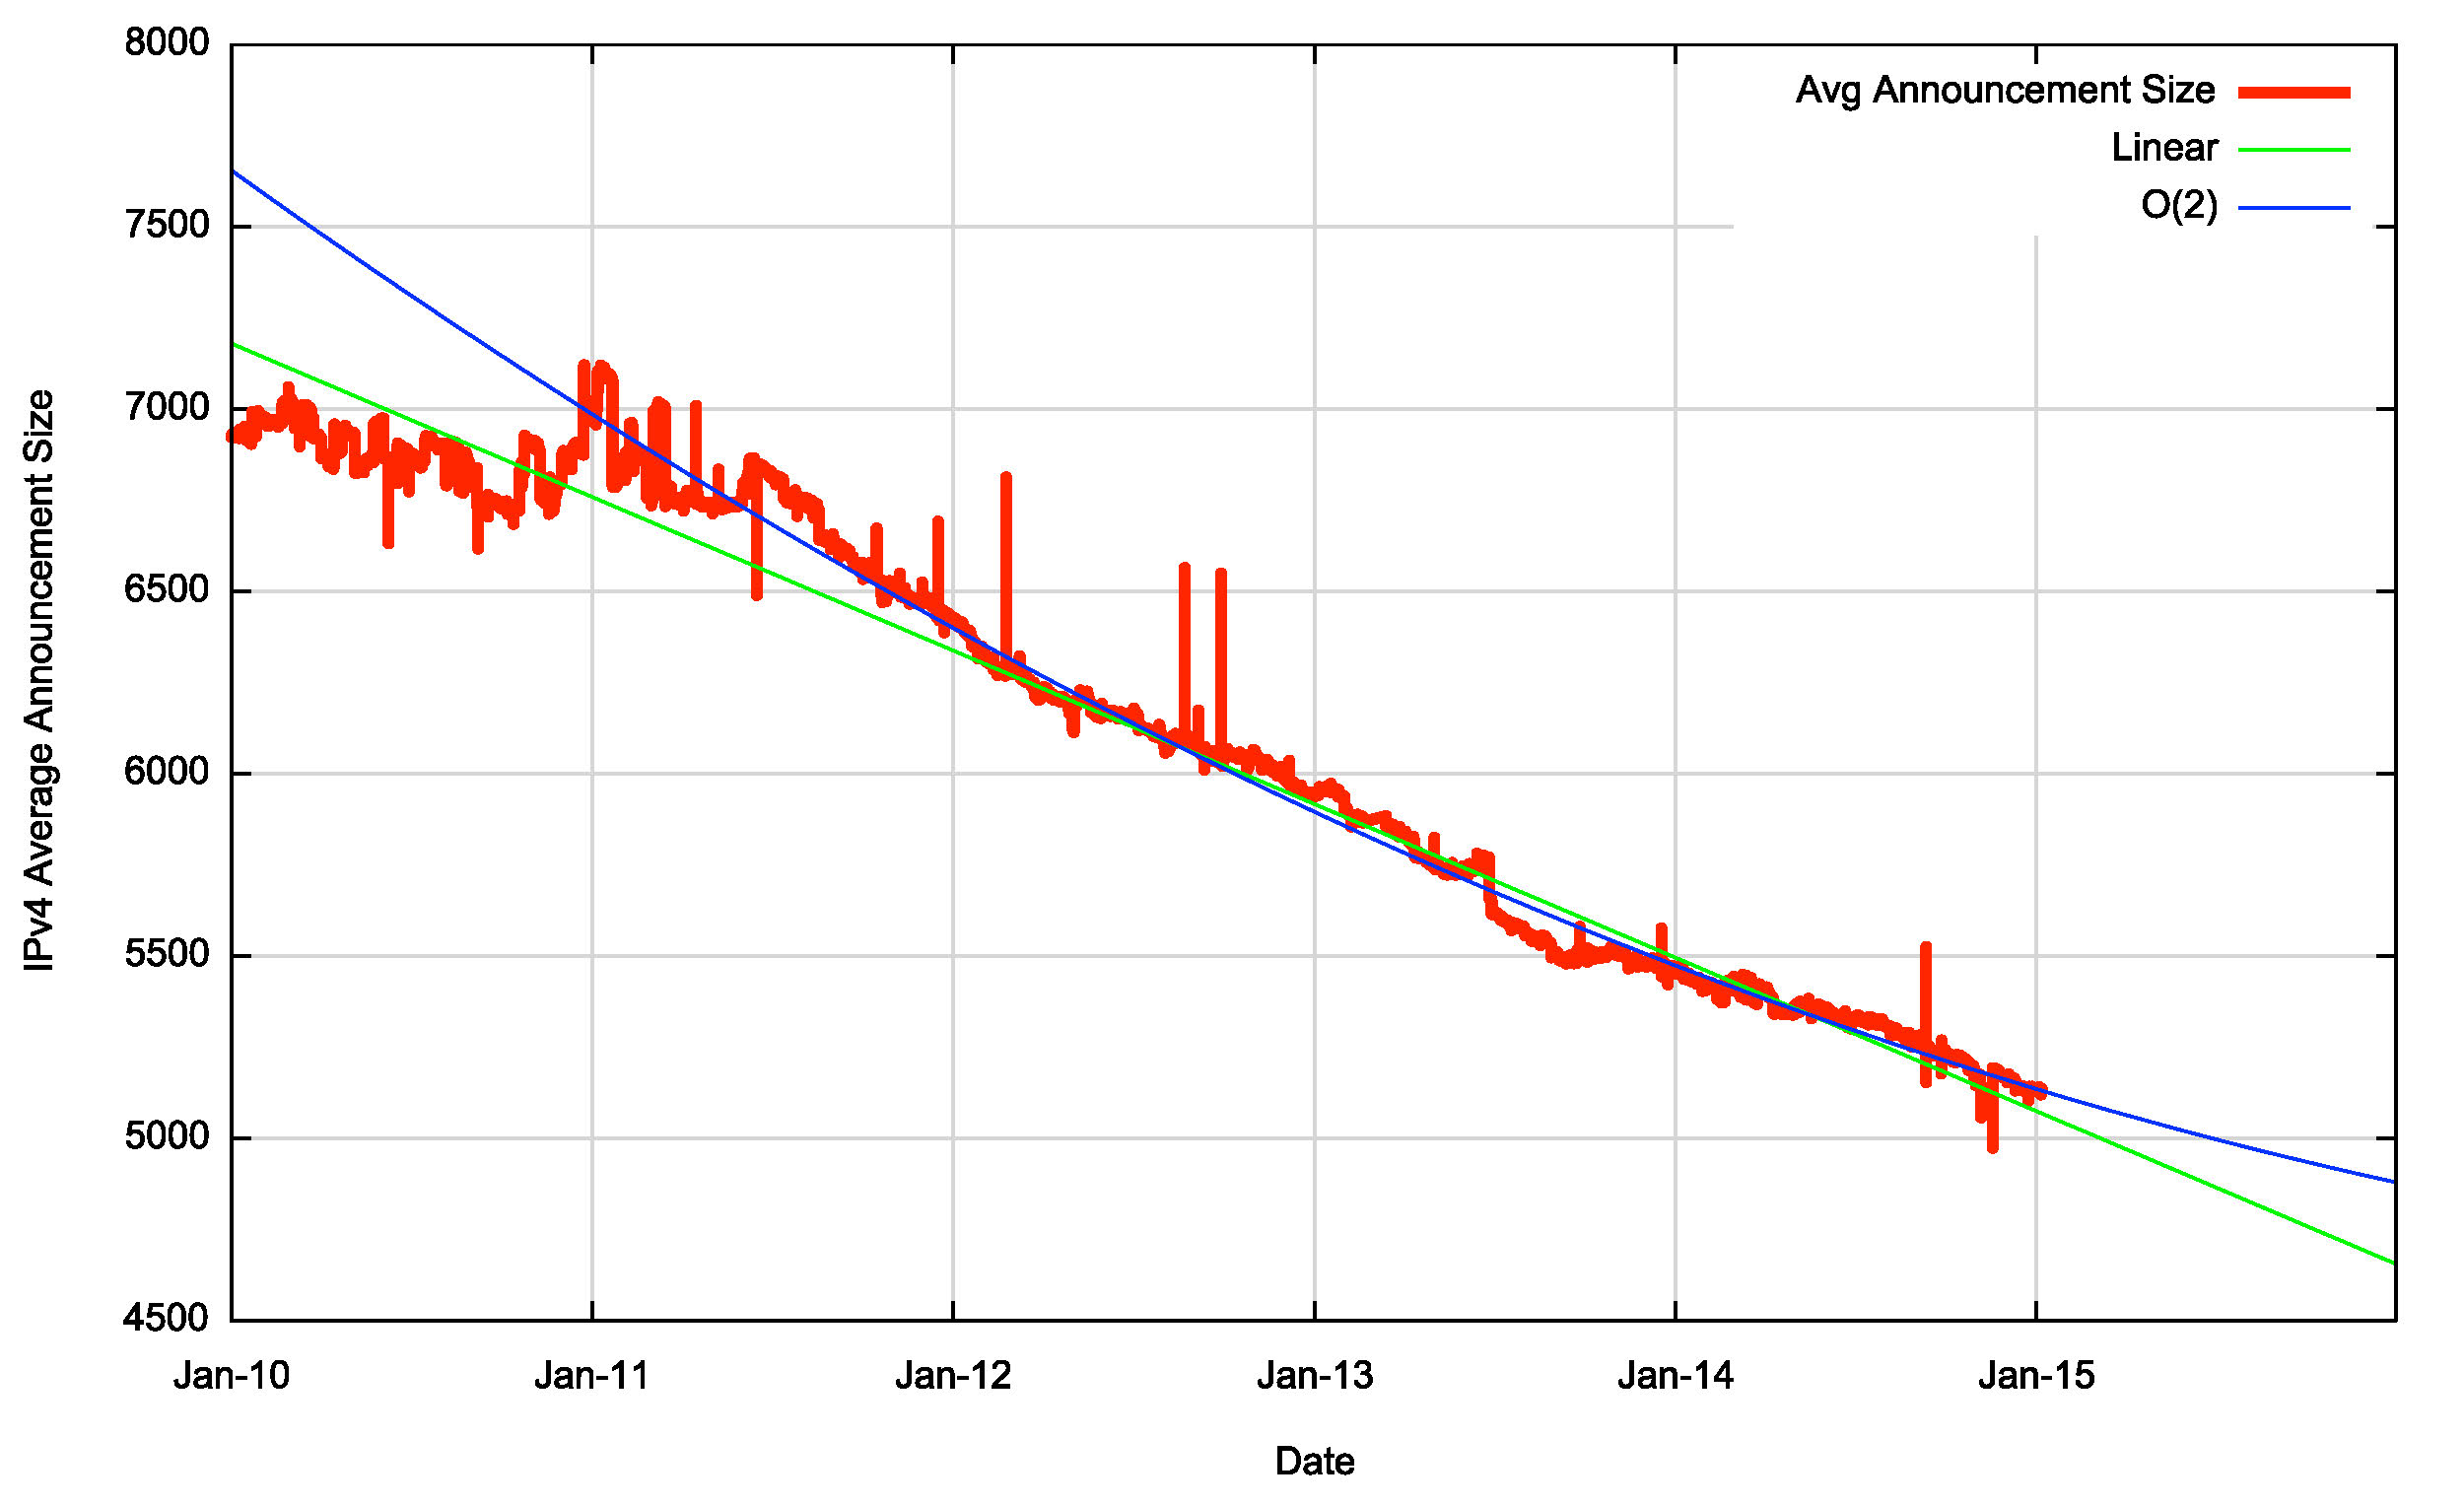
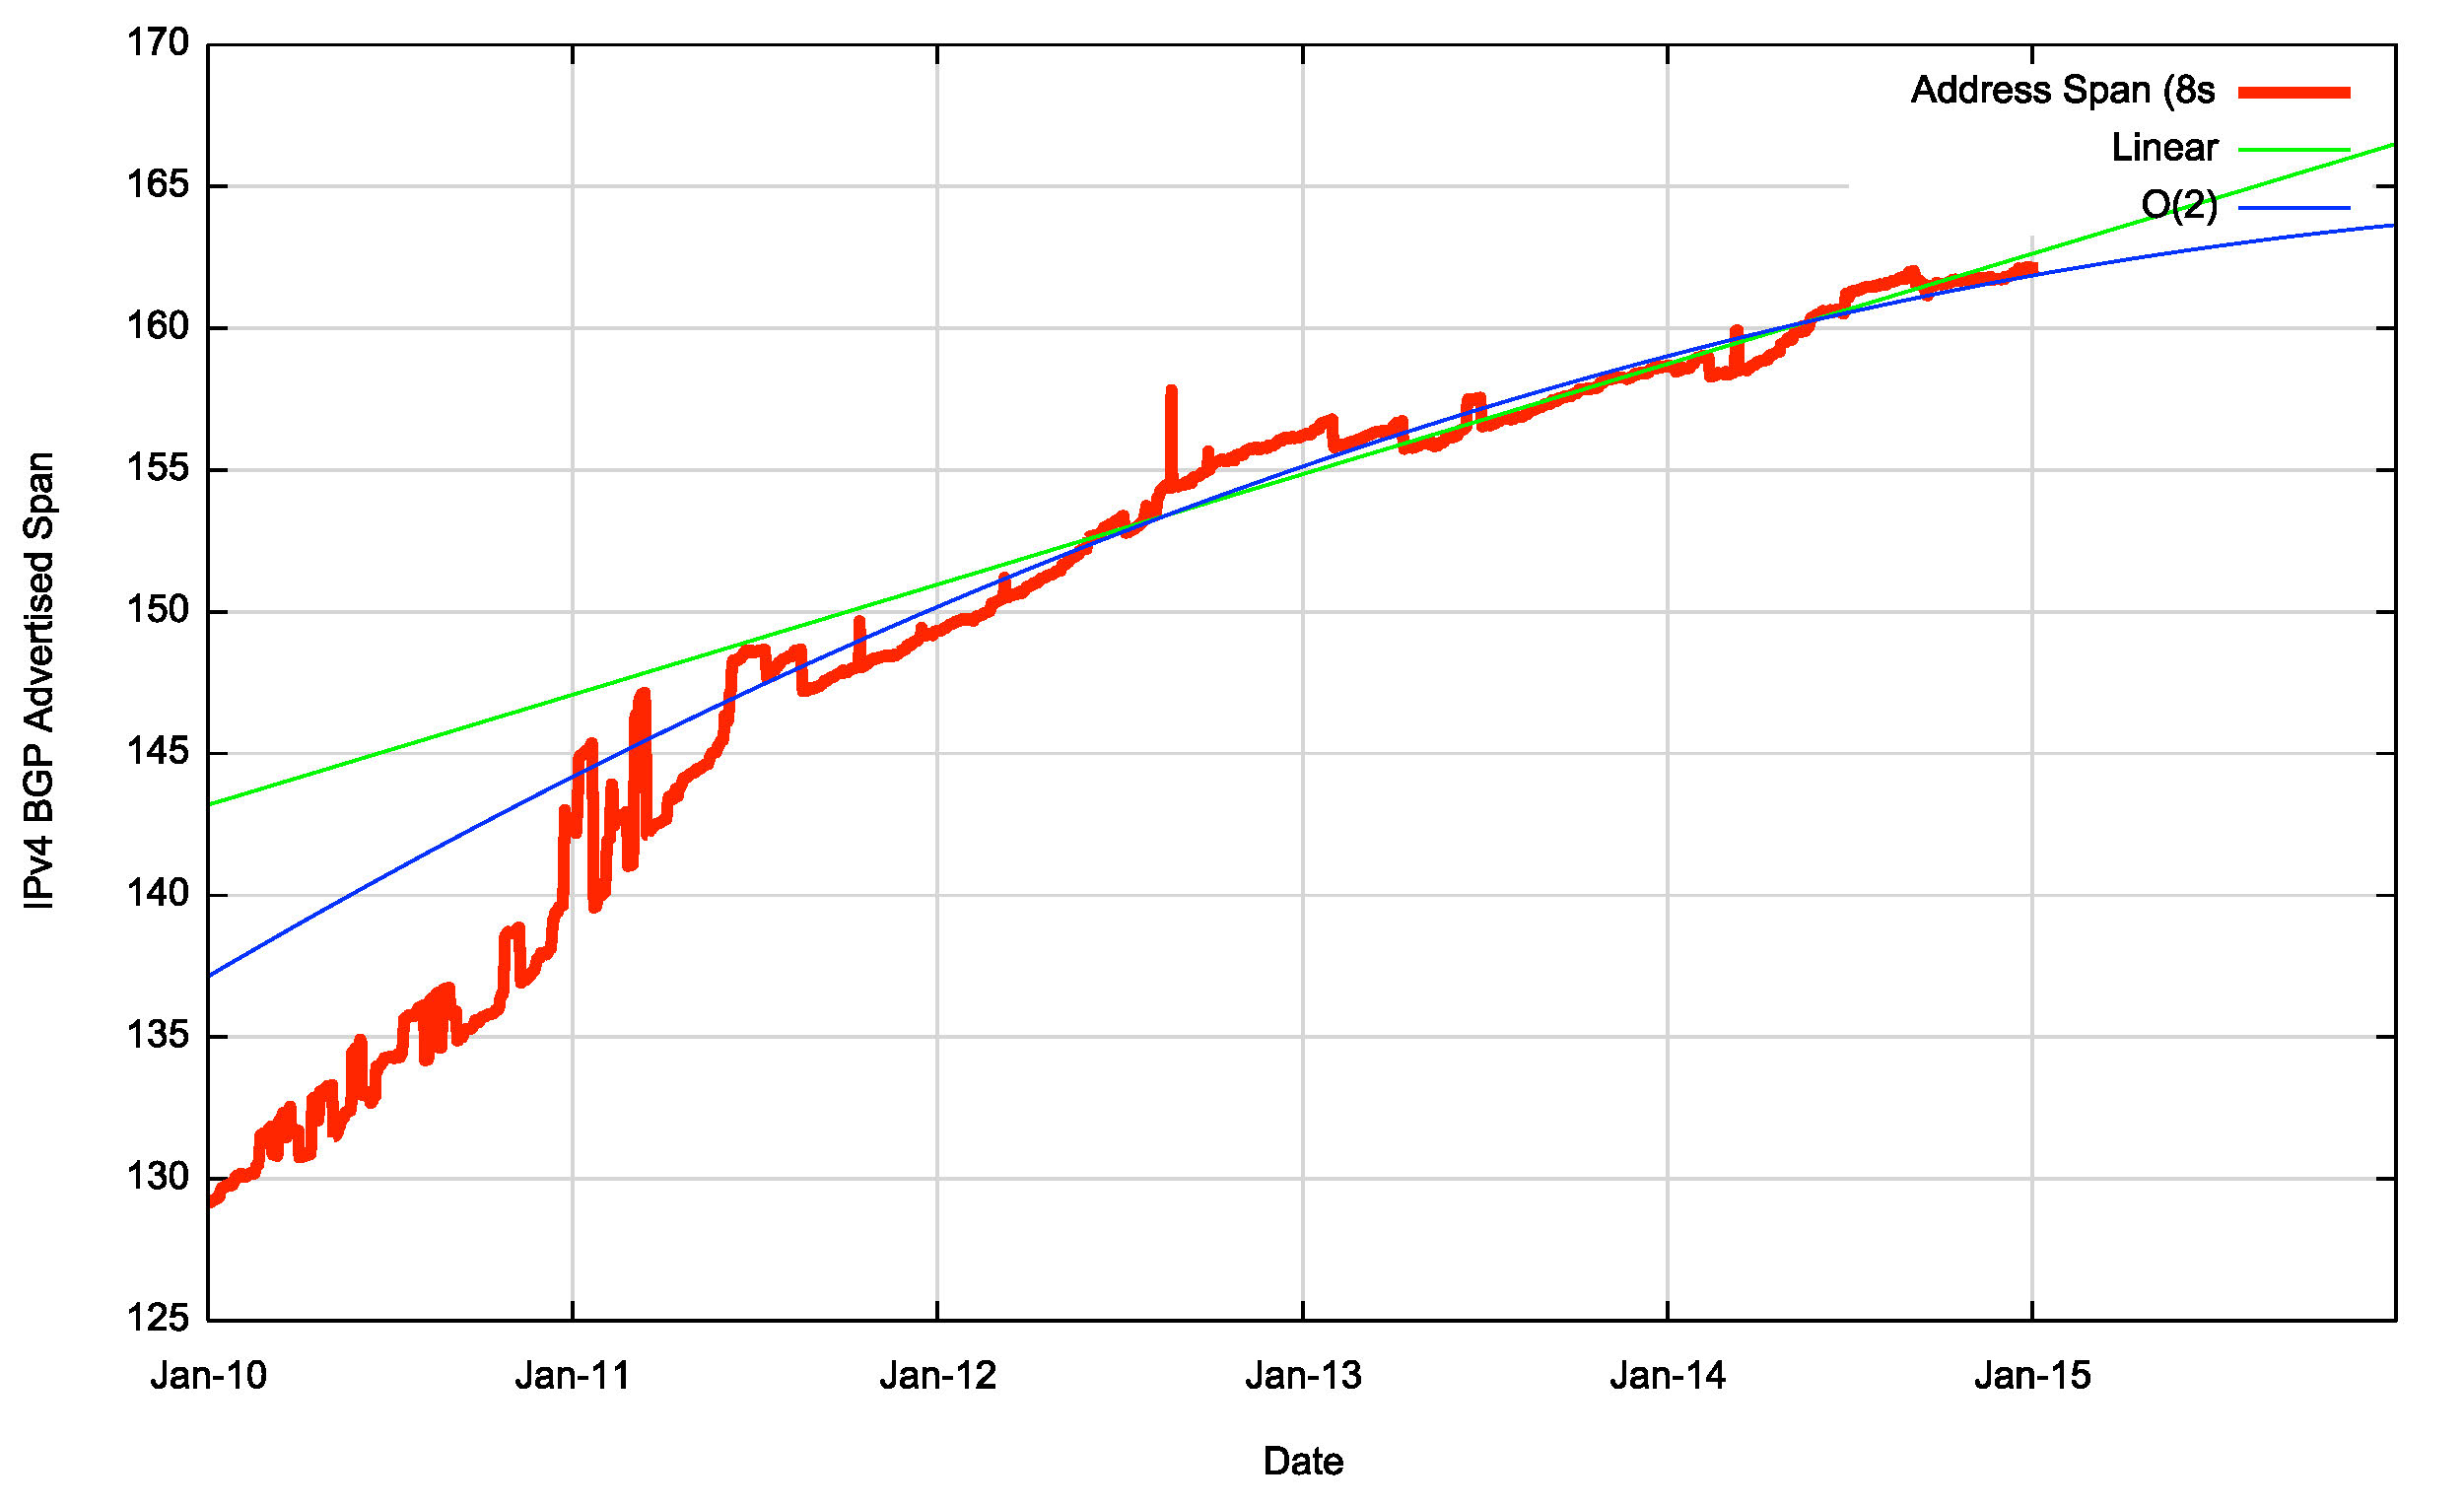

Figure 7 shows the day-by-day progress of the size of the routing table through 2014. The growth of the routing table as relatively consistent over the year, with the overall growth of some 42,000 routes even distributed over the year. In the first week of November 2014 the BGP vantage point at AS 131072 observed a leak of some 10,000 additional routes that was sustained for approximately two weeks. However, if we take a comparable from a route collector, such as that operated by the Route Views project, then this route leak is only evident from a small subset of the peers of Route Views.
This illustrates an important principle in BGP, that there is no single authoritative view of the routing table – all views are in fact relative to the perspective of the BGP speaker. It also illustrates that at times the cause of changes in routing is not necessarily a change at the point of origination of the route which would be visible to all BGP speakers across the entire Internet, but it may well be a change in transit arrangements within the interior of the network that may expose, or hide, collections of routes. And thirdly, this illustrates the prevalent use of more specifics to affect traffic engineering. It is often the case that these more specifics are advertised with a limited scope, and if the changes to the transit arrangements move a BGP speaker in or out of this scope, then one can expect changes in the set of visible routes as a consequence.
The issue of route leaks and the advertisement of more specifics in the routing system could be seen as an instance of a “tragedy of the commons,†where the self interest of one actor in attempting to optimise its incoming traffic loads in order to minimise its transit service costs becomes an incremental cost in routing load that is borne by other actors. To quote the Wikipedia article on this topic “In absence of enlightened self-interest, some form of authority or federation is needed to solve the collective action problem.†This appears to be the case in the BGP realm, where there is an extensive reliance on enlightened self interest to be conservative in one’s own announcements, and the actions by a smaller set of actors are prominent because they fall well outside of the conventional “norm†of inter-domain routing practices.
Figure 8 also shows that the period between mid September 2014 until the end of the year was when each individual peer of Route Views exceeded 512,000 IPv4 routes. High Speed routing equipment uses high speed cache memory to store the routing table in the lookup tables, and the size of this lookup cache is a compromise between price, power and capability. Older routing equipment with these high speed lookup caches were typically configured to hold up to 512,000 IPv4 routing entries, and when this limit is exceeded then this equipment could perform erratically, including shutting down. By the end of 2014 most Route Views peers were carrying more than 512,000 routes, so the issues associated with this particular size threshold and older routing equipment have, hopefully been addressed.
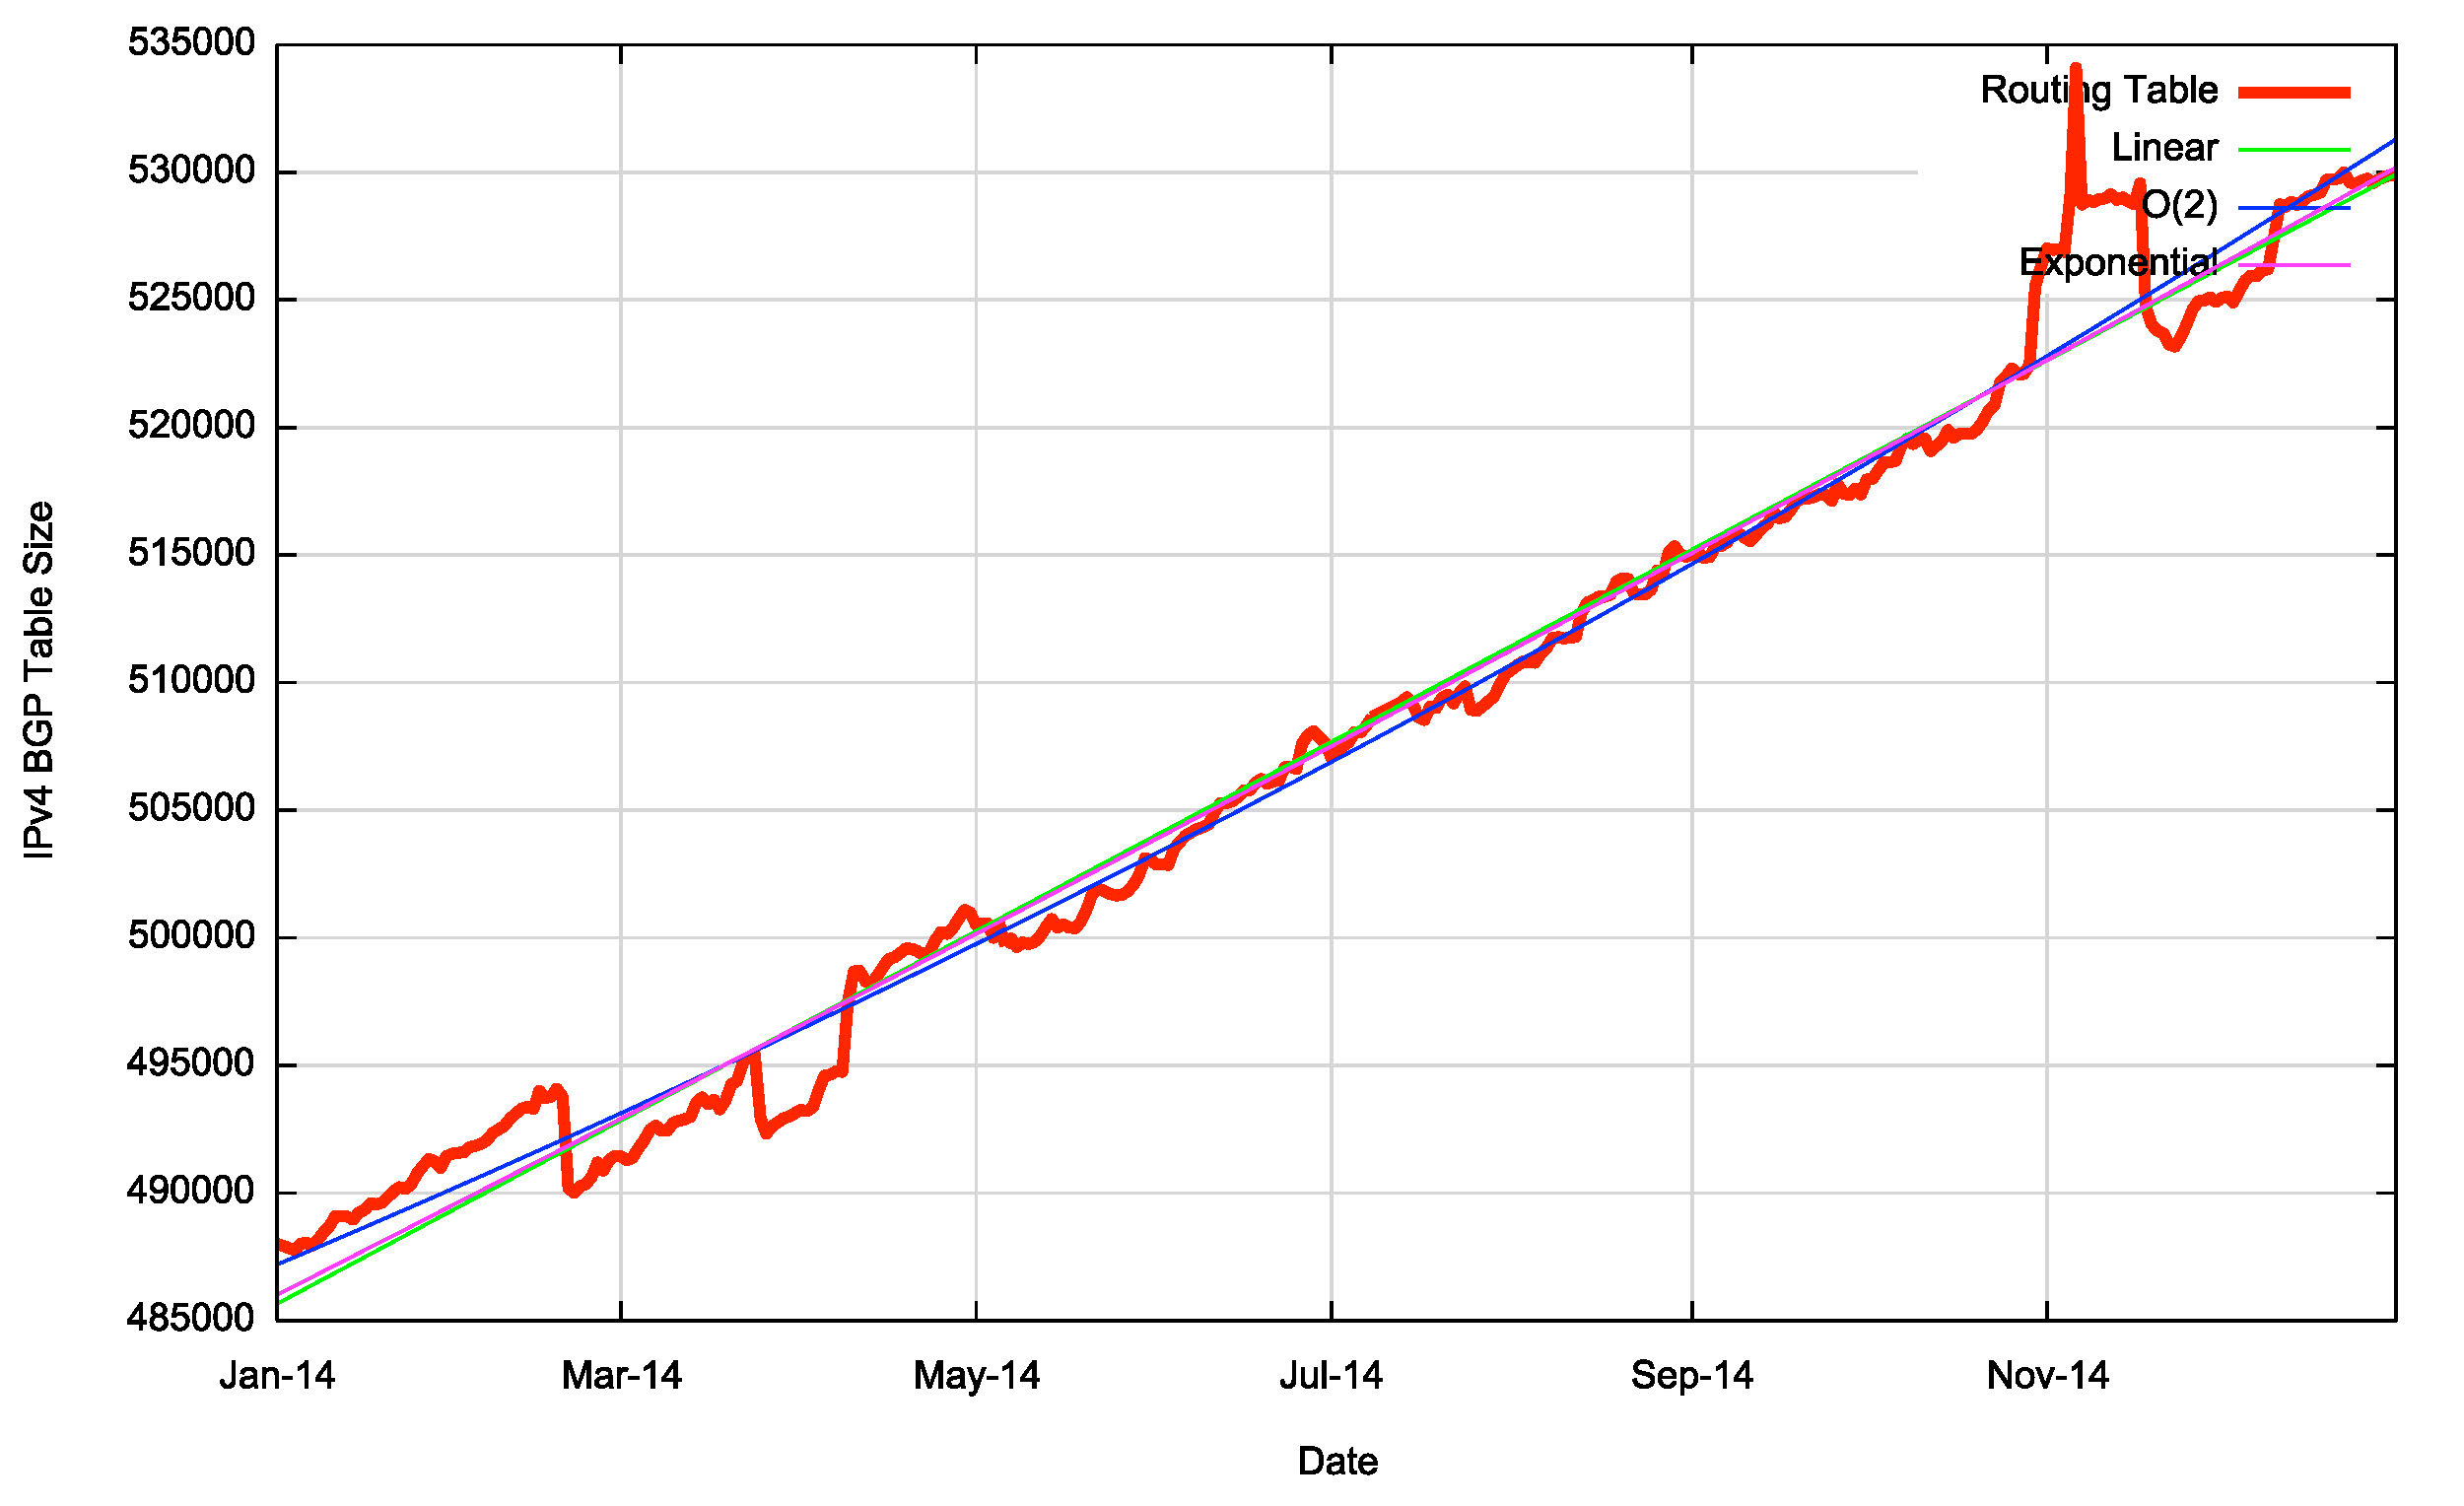
Figure 7 – IPv4 BGP Table in 2013, as seen by AS131072
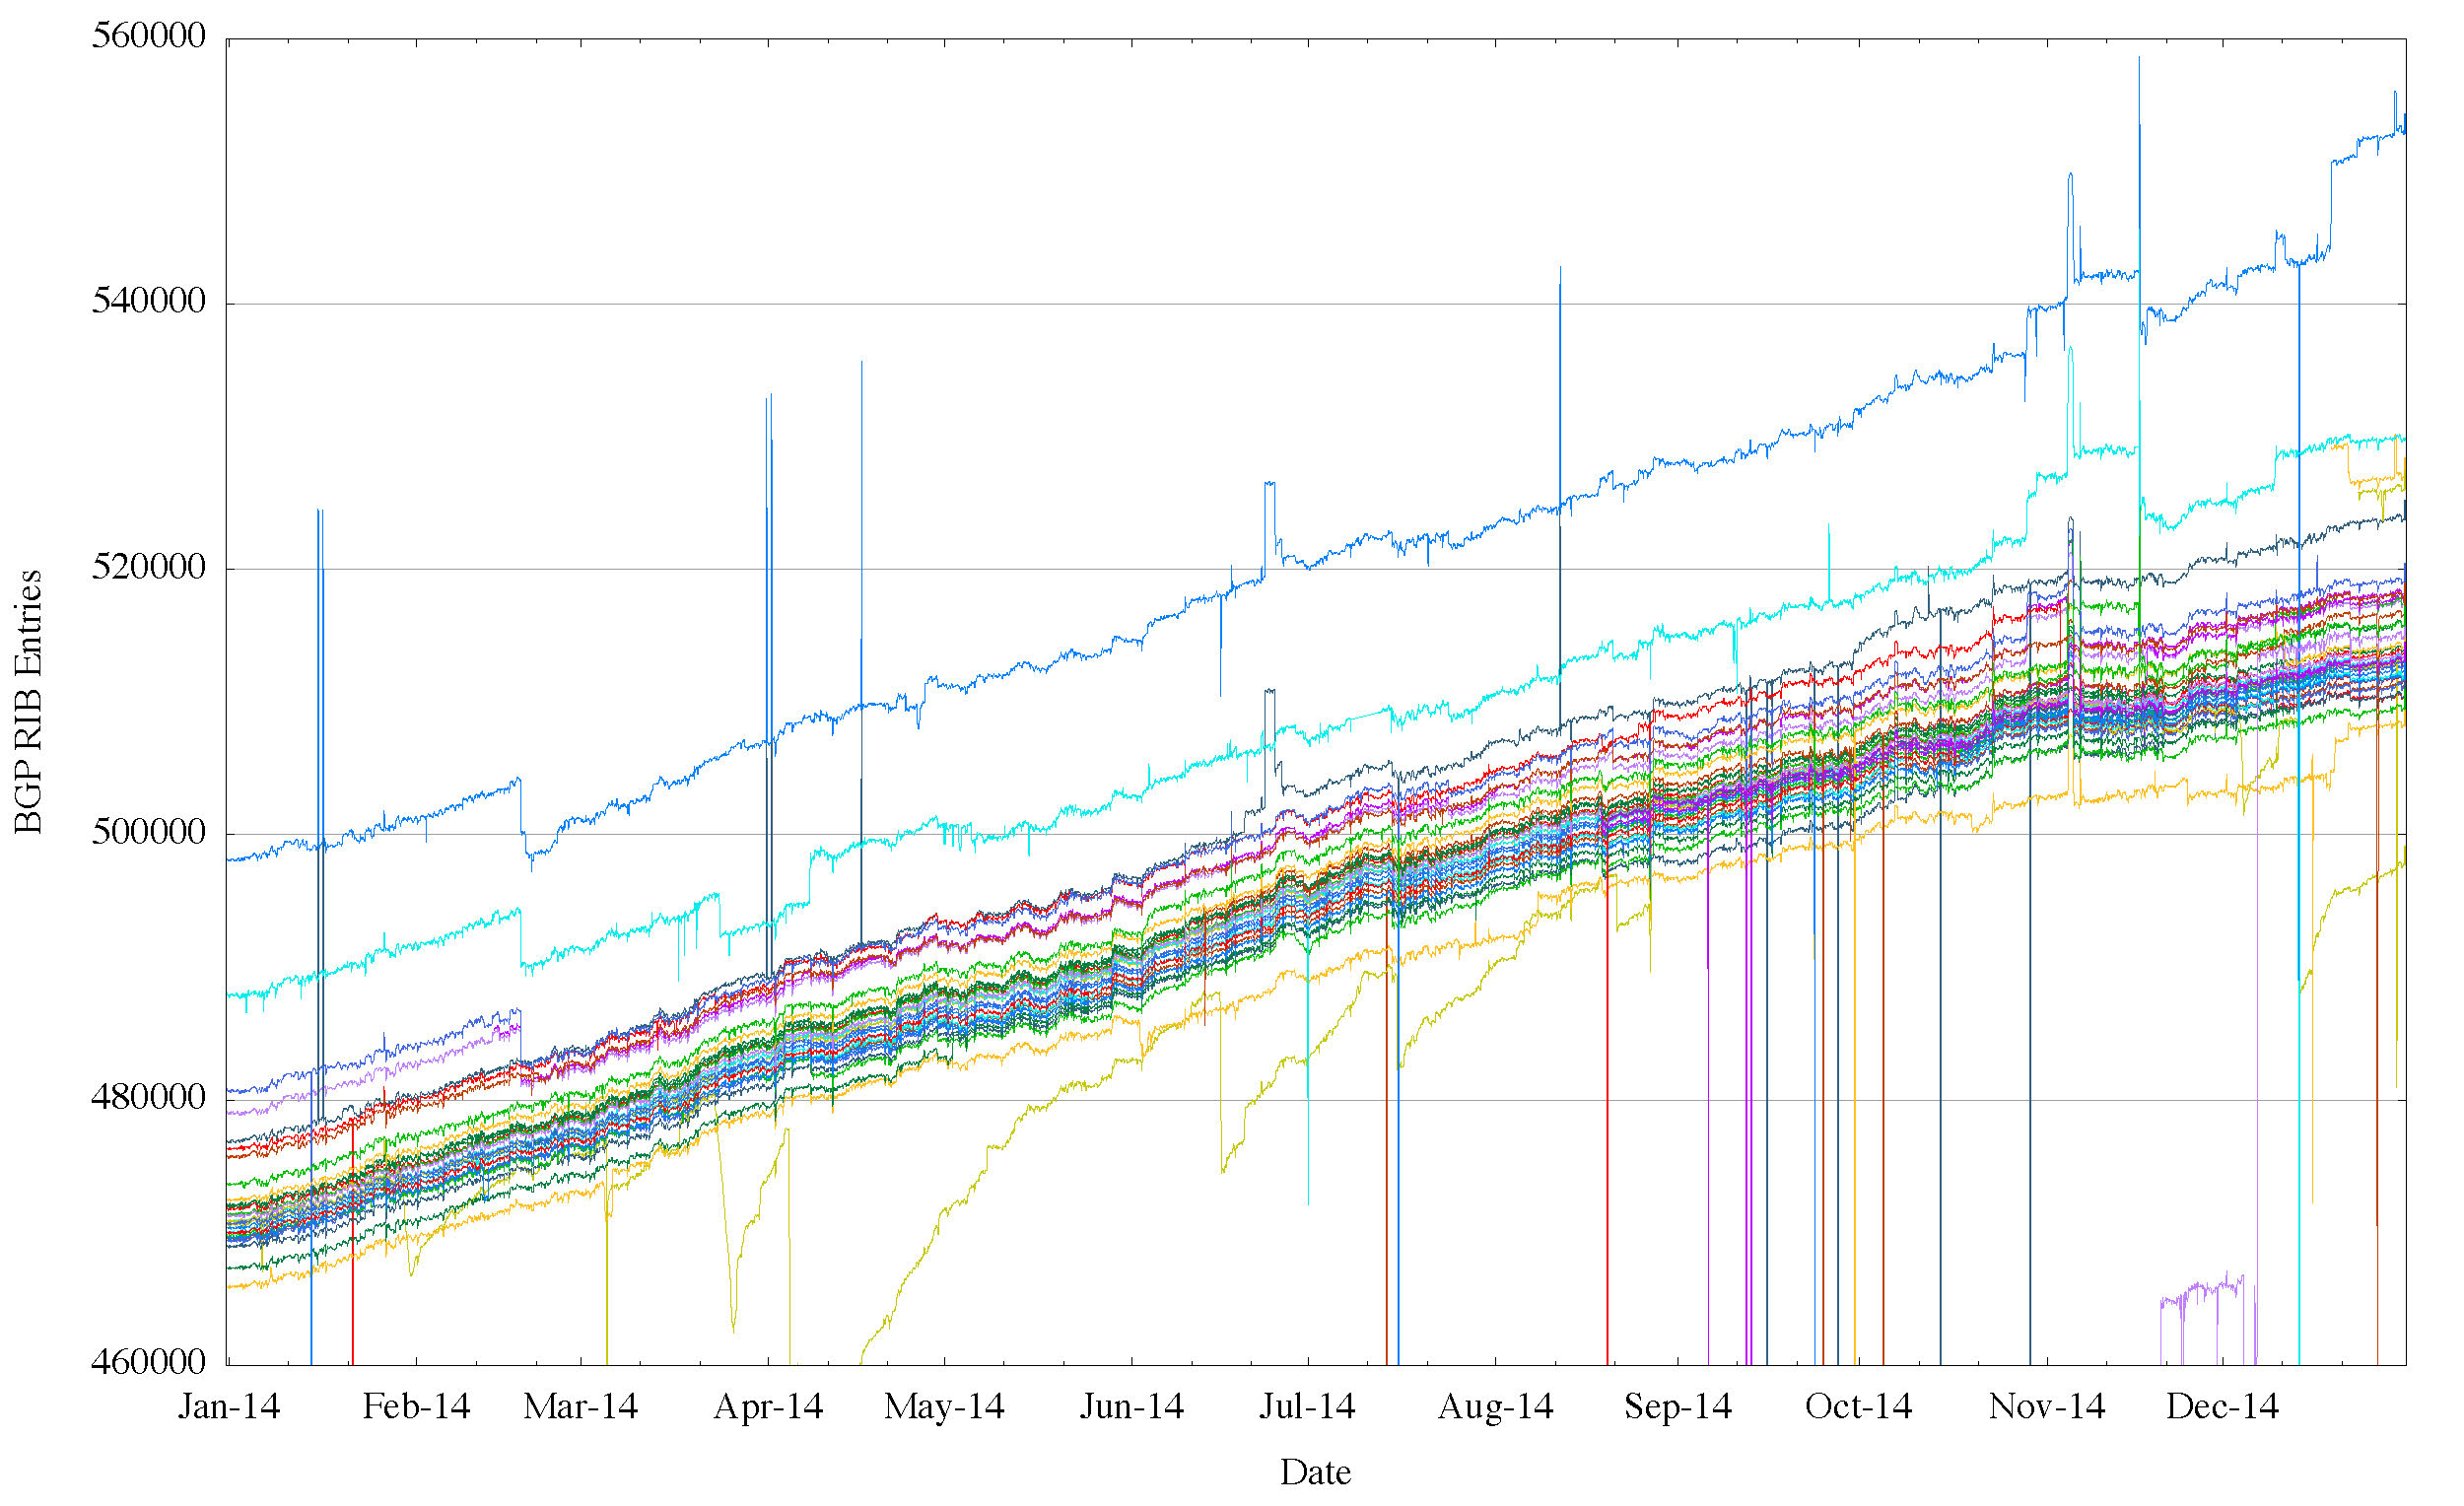
Figure 8 – IPv4 BGP Table in 2013, as seen by peers of Route Views
(each line tracks the daily size of an individual routing peer of the Route Views collector)
The summary of the IPv4 BGP network over the 2012-2014 period is shown in Table 1.
| Jan-12 |
Jan-13 | Jan-14 | Jan-15 | 2013 growth |
2014 growth |
|
| Prefix Count | 390,000 | 441,000 | 488,000 | 530,000 | 11% | 9% |
| Root Prefixes | 190,000 | 215,000 | 237,000 | 257,000 | 11% | 8% |
| More Specifics | 200,000 | 226,000 | 251,000 | 287,000 | 11% | 14% |
| Address Span (/8s) | 149.3 | 156.2 | 158.6 | 162.1 | 2% | 2% |
| AS Count | 39,800 | 43,100 | 46,000 | 49,000 | 7% | 7% |
| Transit AS Count | 5,500 | 6,000 | 6,400 | 7,000 | 7% | 9% |
| Stub AS Count | 43,300 | 37,100 | 39,000 | 42,000 | 7% | 8% |
Table 1 – IPv4 BGP Table Growth Profile
What this table indicates is that the IPv4 network growth in 2014 was similar to 2013. The number of routed stub AS numbers (new edge networks) grew by 8% in 2014, as compared to 7% is 2013. The effects of increasing scarcity of IPv4 addresses is evident, with the span of advertised networks growing by just 2% through 2014. It is also notable in the profile of route objects, with the number of more specific routes growing at a rate that is almost double that of the root or aggregate prefixes. It appears that the drivers for growth in the IPv4 network in 2014 continued at a pace that is similar to that of the previous 12 months, but in terms of addresses and routing we are seeing the address space being divided up into smaller units, and presumably this is accompanied by the increasing use of network address translation to accommodate the growth pressures in IPv4.
The overall conclusions from this collection of observations is that the V4 network continued to grow, but as the supply of new addresses is slowing down, what is now becoming evident is more efficient use of addresses, which results in the granularity of the IPv4 inter-domain routing system becoming finer. The density of inter-AS interconnection continues to increase. The growth of the Internet is not “growth from the edge” as the network is not getting any larger in terms of average AS path change. Instead, the growth is happening by increasing the density of the network by attaching new networks into the existing transit structure and peering at established exchange points. This makes for a network whose diameter, measured in AS hops, is essentially static, yet whose density, measured in terms of prefix count, AS interconnectivity and AS Path diversity, continues to increase. This denser mesh of interconnectivity could be potentially problematical in terms of convergence times if the BGP routing system used a dense mesh of peer connectivity, but the topology of the network continues along a clustered hub and spoke model, where a small number of transit ASs directly service a large number of stub edge networks. This implies that the performance of BGP in terms of time and updates required to reach convergence continues to be relatively static.
IPv6 BGP Table Data
A similar exercise has been undertaken for IPv6 routing data, and the comparable figures for the IPv6 Internet are shown in Figures 9 through 14.
|
|
|
|
|
|
|
|
|
The summary of the IPv6 Internet for the period 2011-2013 is as follows:
| Jan-12 |
Jan-13 | Jan-14 | 2013 growth |
2014 growth |
||
| Prefix Count | 7,700 | 11,900 | 16,700 | 21,000 | 40% | 26% |
| Root Prefixes | 5,800 | 8,600 | 11,400 | 14,600 | 33% | 28% |
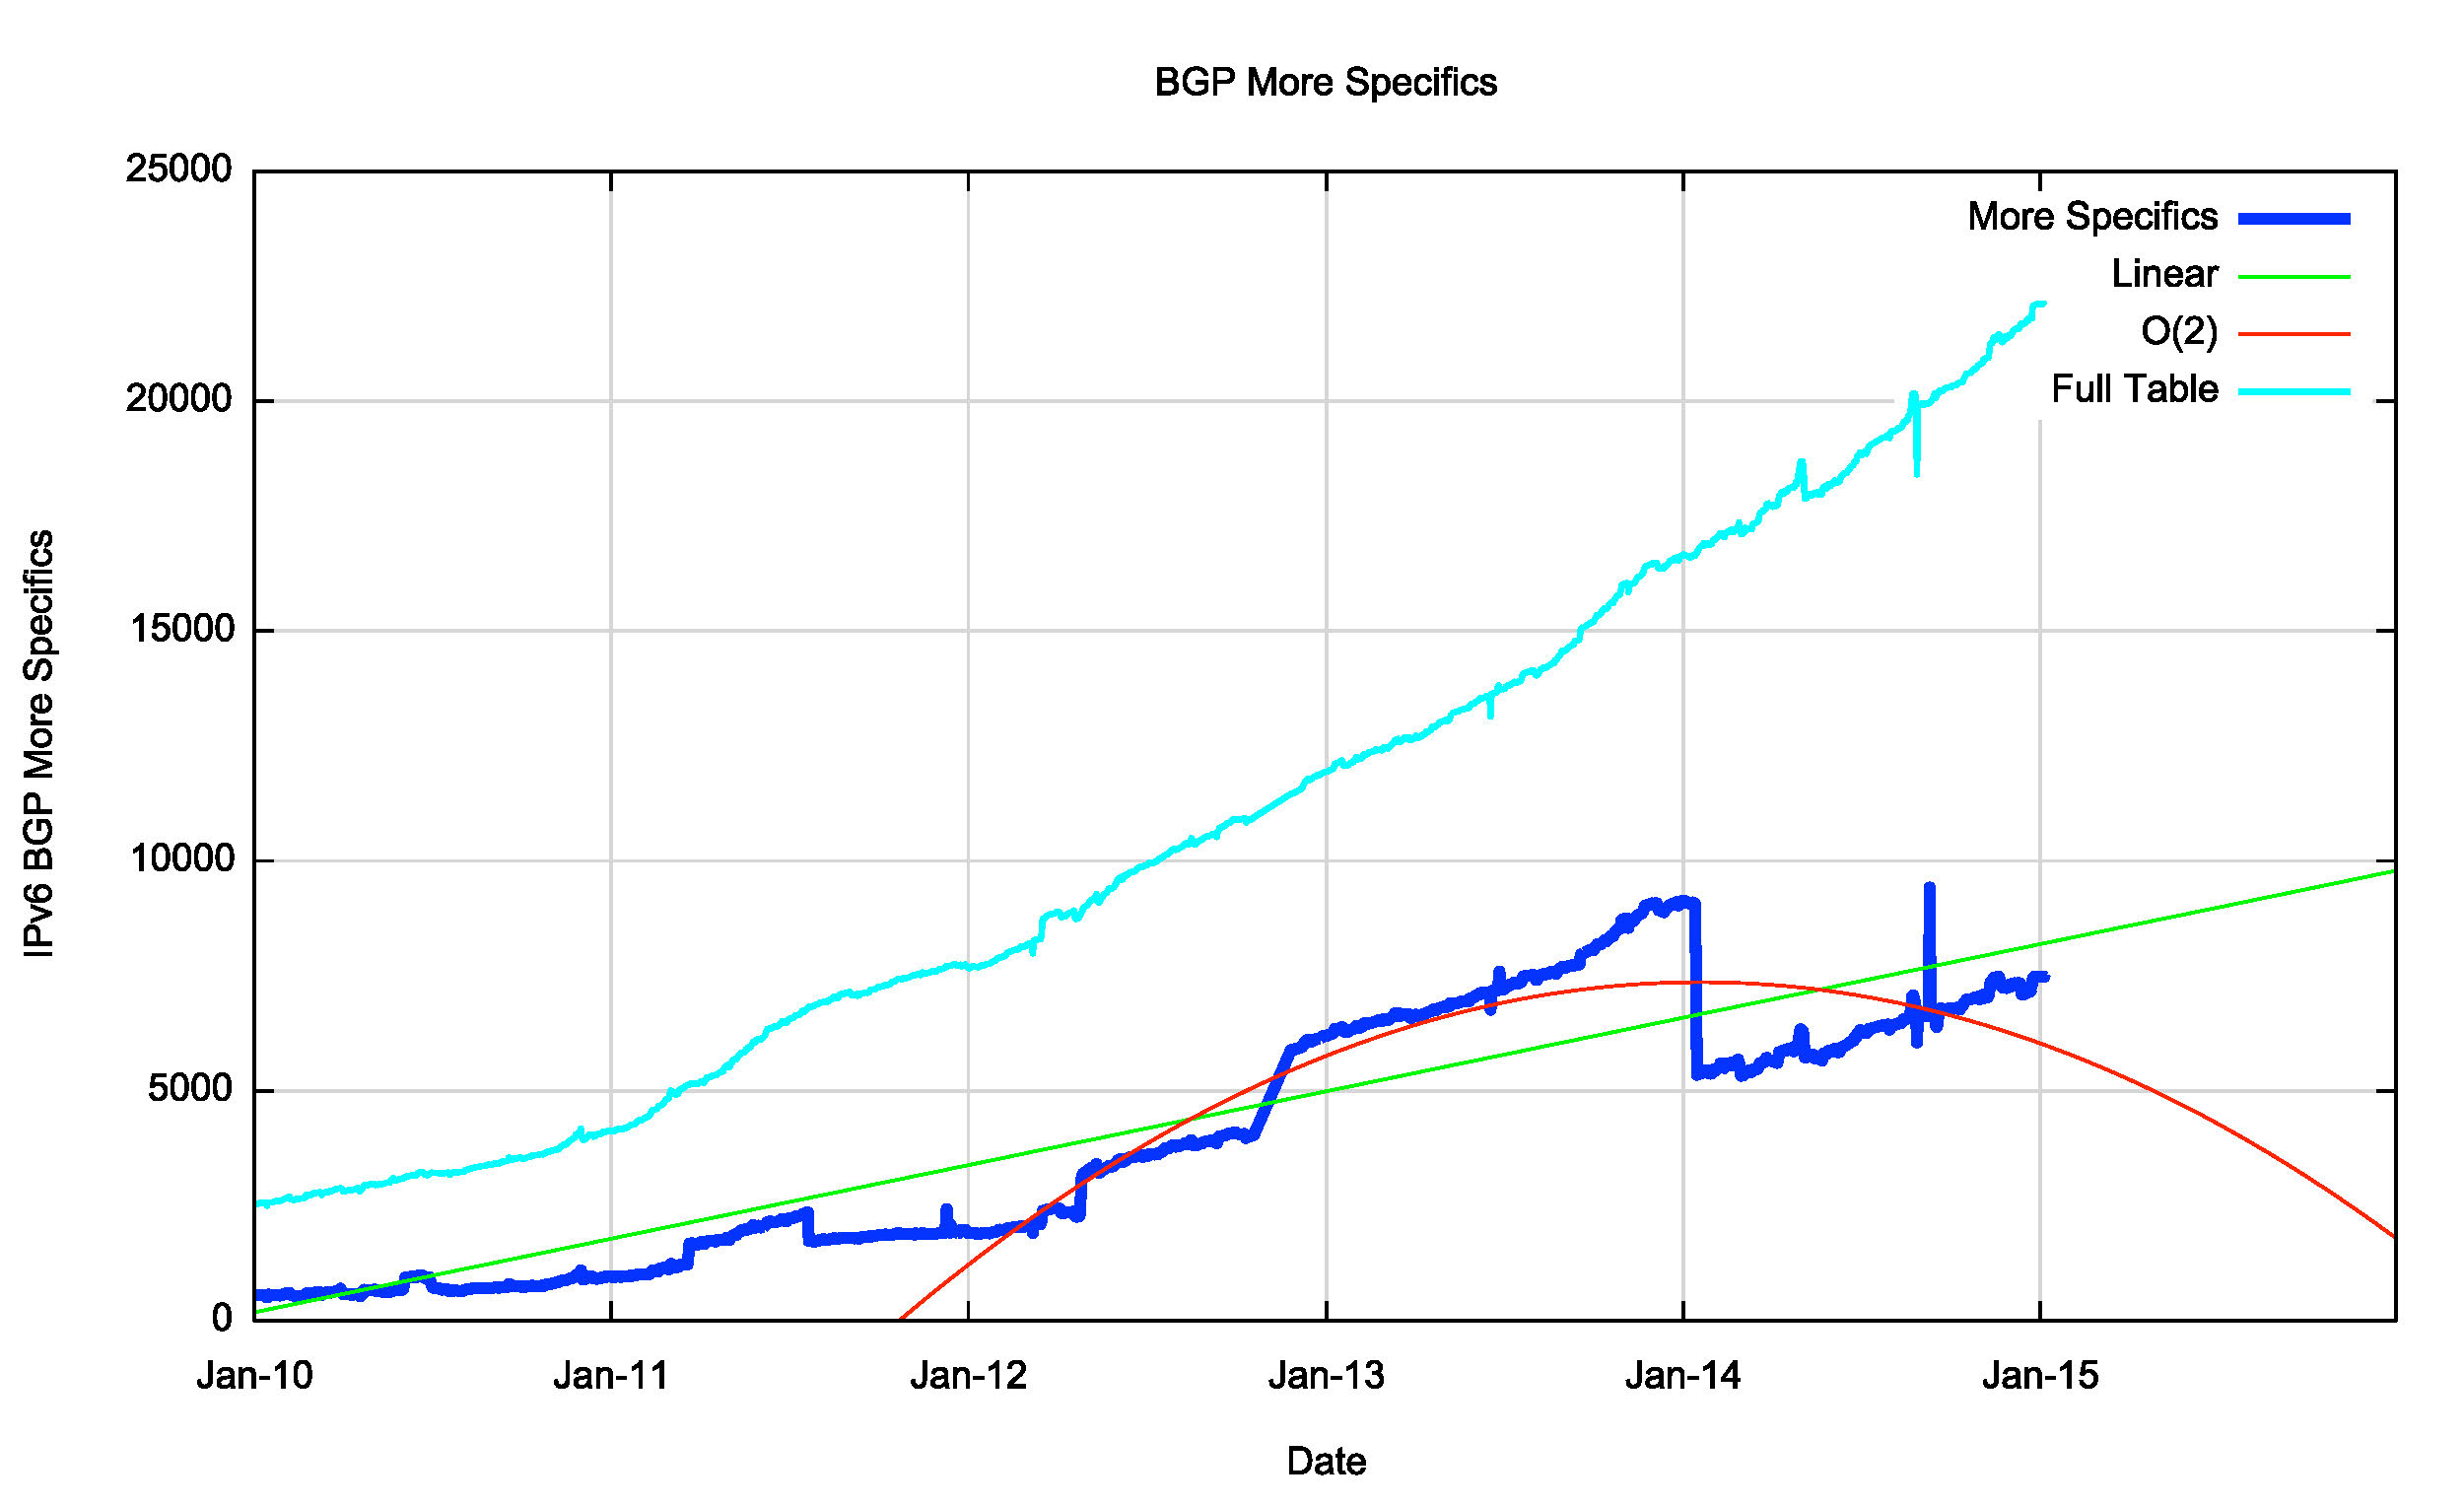
| More Specifics | 1,900 | 3,300 | 5,300 | 6,400 | 61% | 21% |
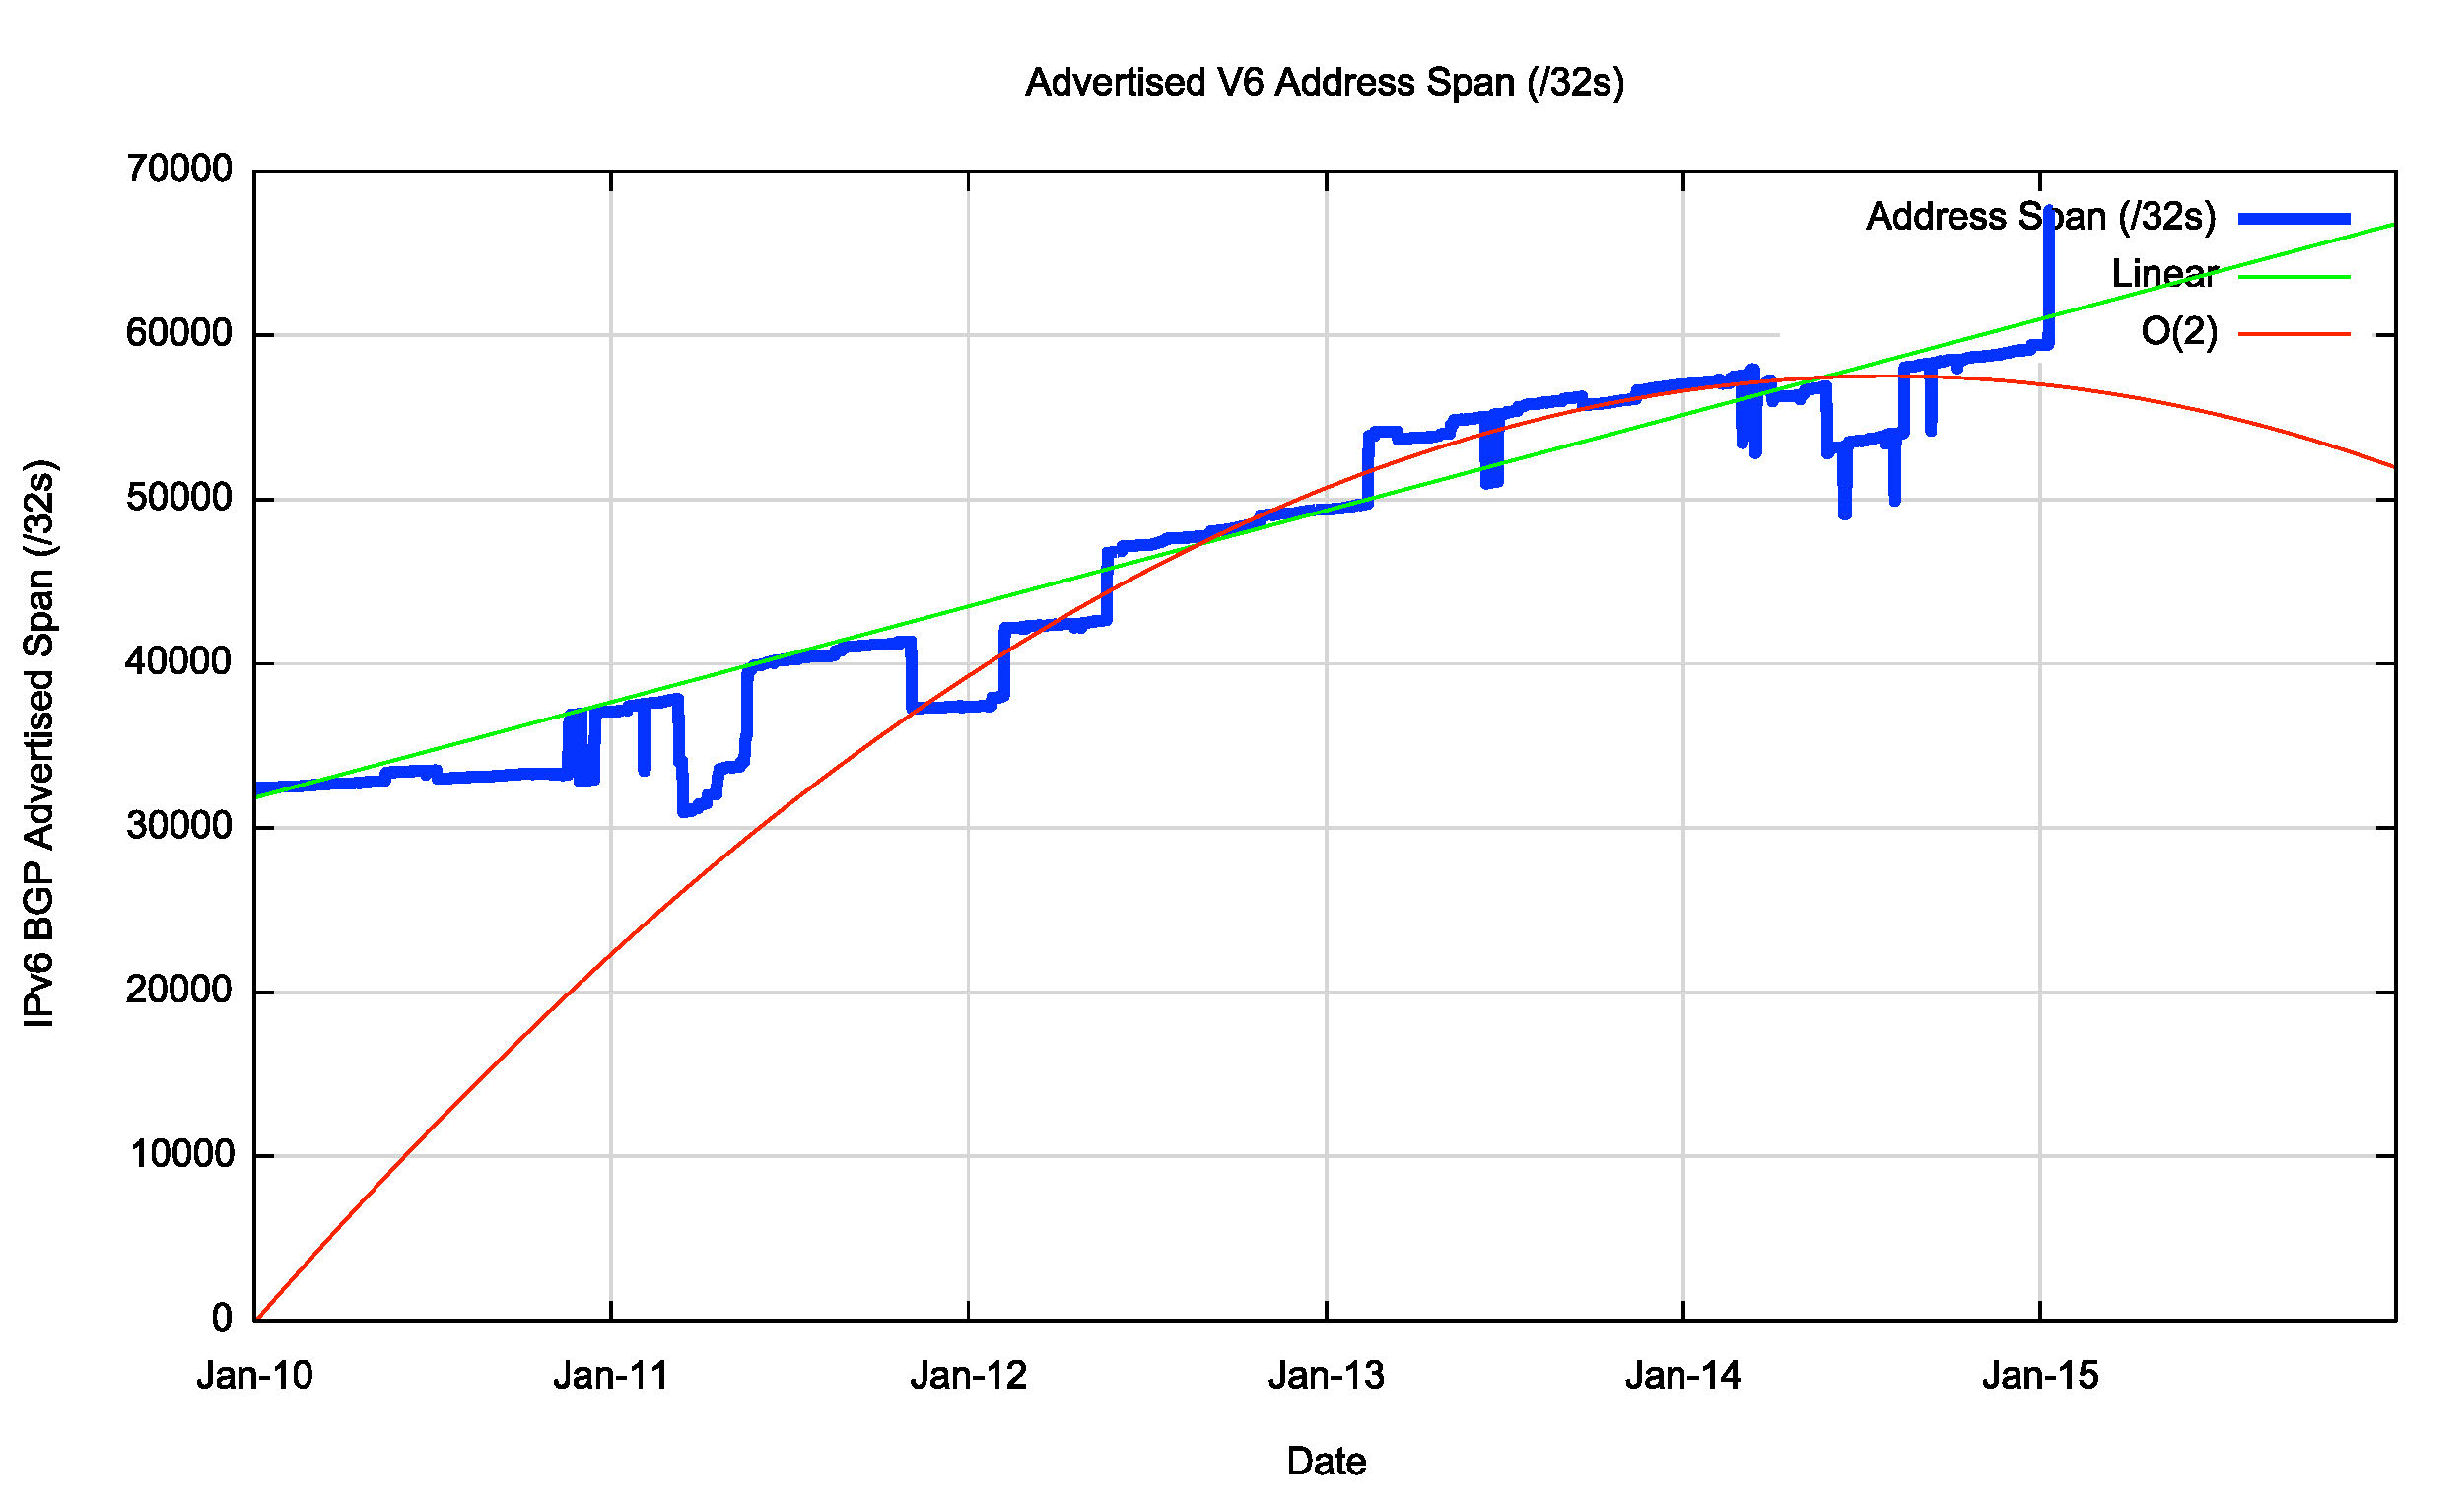
| Address Span (/32s) | 53,300 | 65,100 | 72,200 | 74,500 | 11% | 3% |
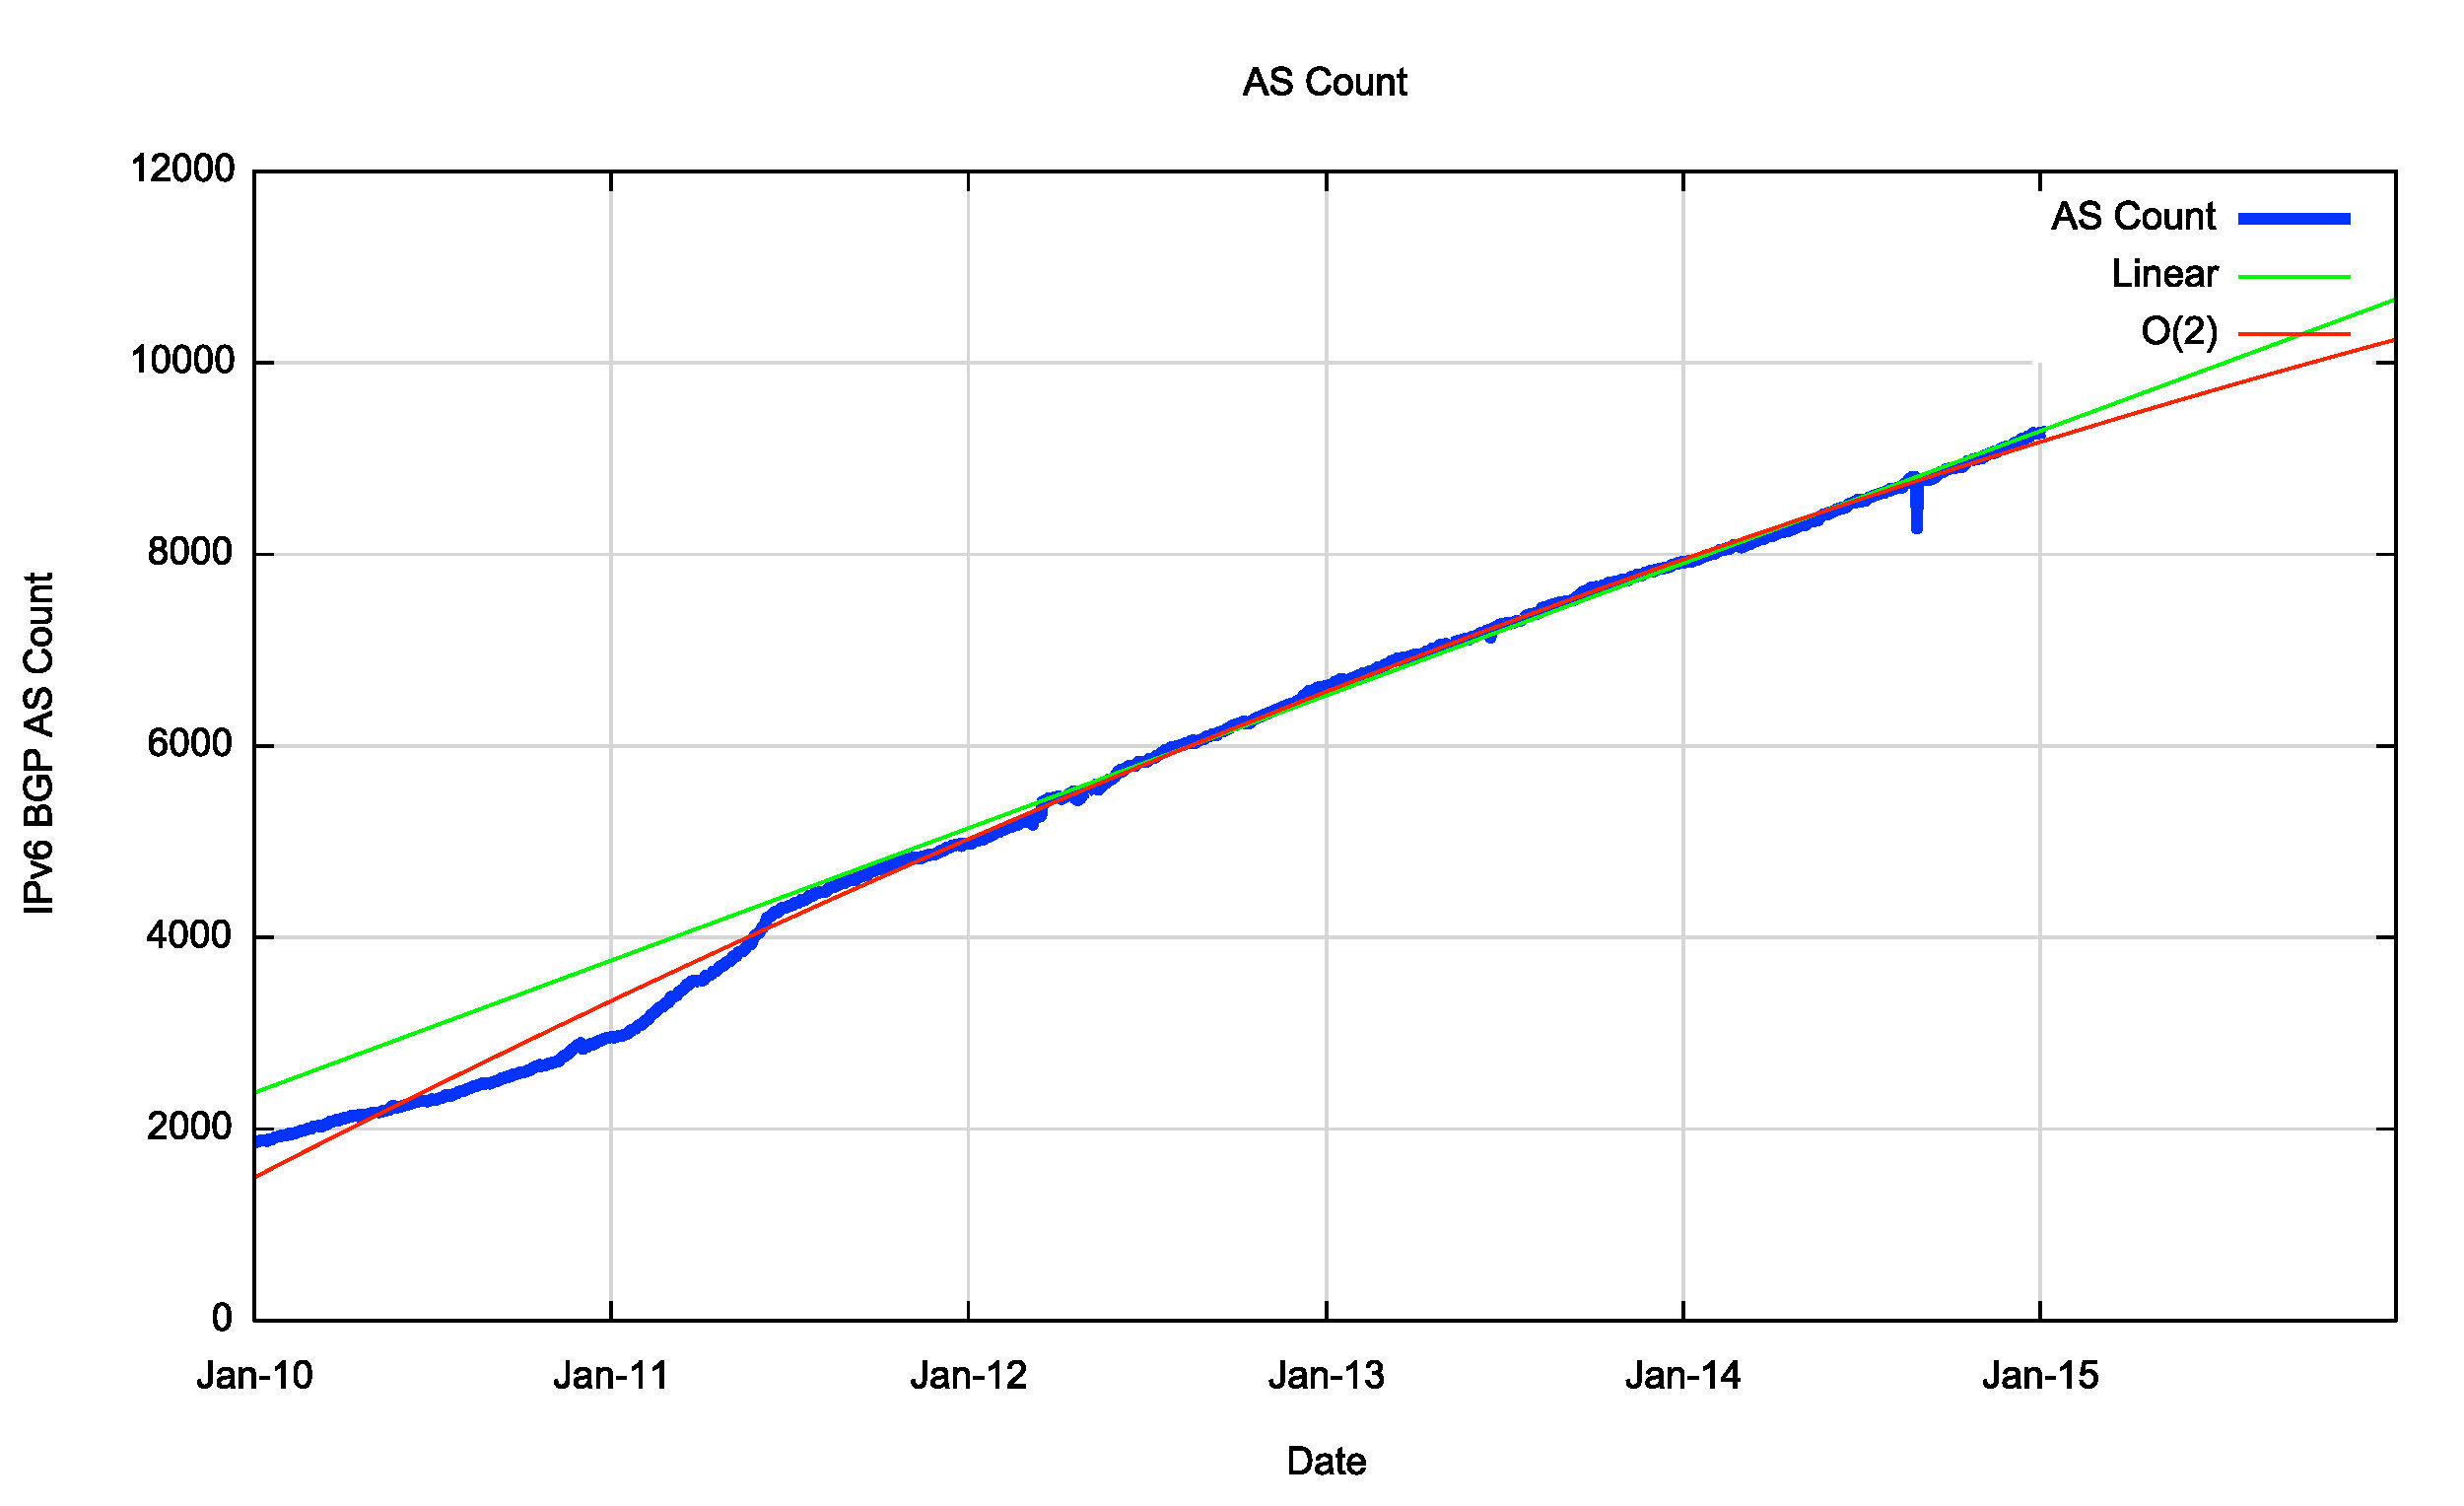
| AS Count | 5,000 | 6,600 | 7,900 | 9,100 | 20% | 15% |
| Transit AS Count | 1,000 | 1,300 | 1,600 | 1,700 | 23% | 6% |
| Stub AS Count | 4,000 | 5,300 | 6,300 | 7,400 | 19% | 17% |
Table 2 – IPv6 BGP Table Growth Profile
There are a number of interesting aspects to this growth where the characteristics of IPv4 look to be appearing in IPv6. The number of more specific advertisements of existing aggregate announcements is rising faster than the number of aggregate announcements. More specifics are now 31% of the total IPv6 routing table. Also the number of transit AS networks is falling, and its now 19% of all AS’s in IPv6, as compared to 14% in IPv4. However, most notable is an inherent contradiction in the metrics for the IPv6 network. In 2013 the relative number of users who are running IPv6 more that doubled from 0.8% of all users to 1.7% by the end of the year, and this momentum of growth in the IPv6 end user population doubled again in 2014, to 3.6% by the end of 2014. Yet the metrics of routing IPv6 do not reflect that growth, and the 2014 growth rates for the infrastructure of the IPv6 internet are falling from 2013 levels.
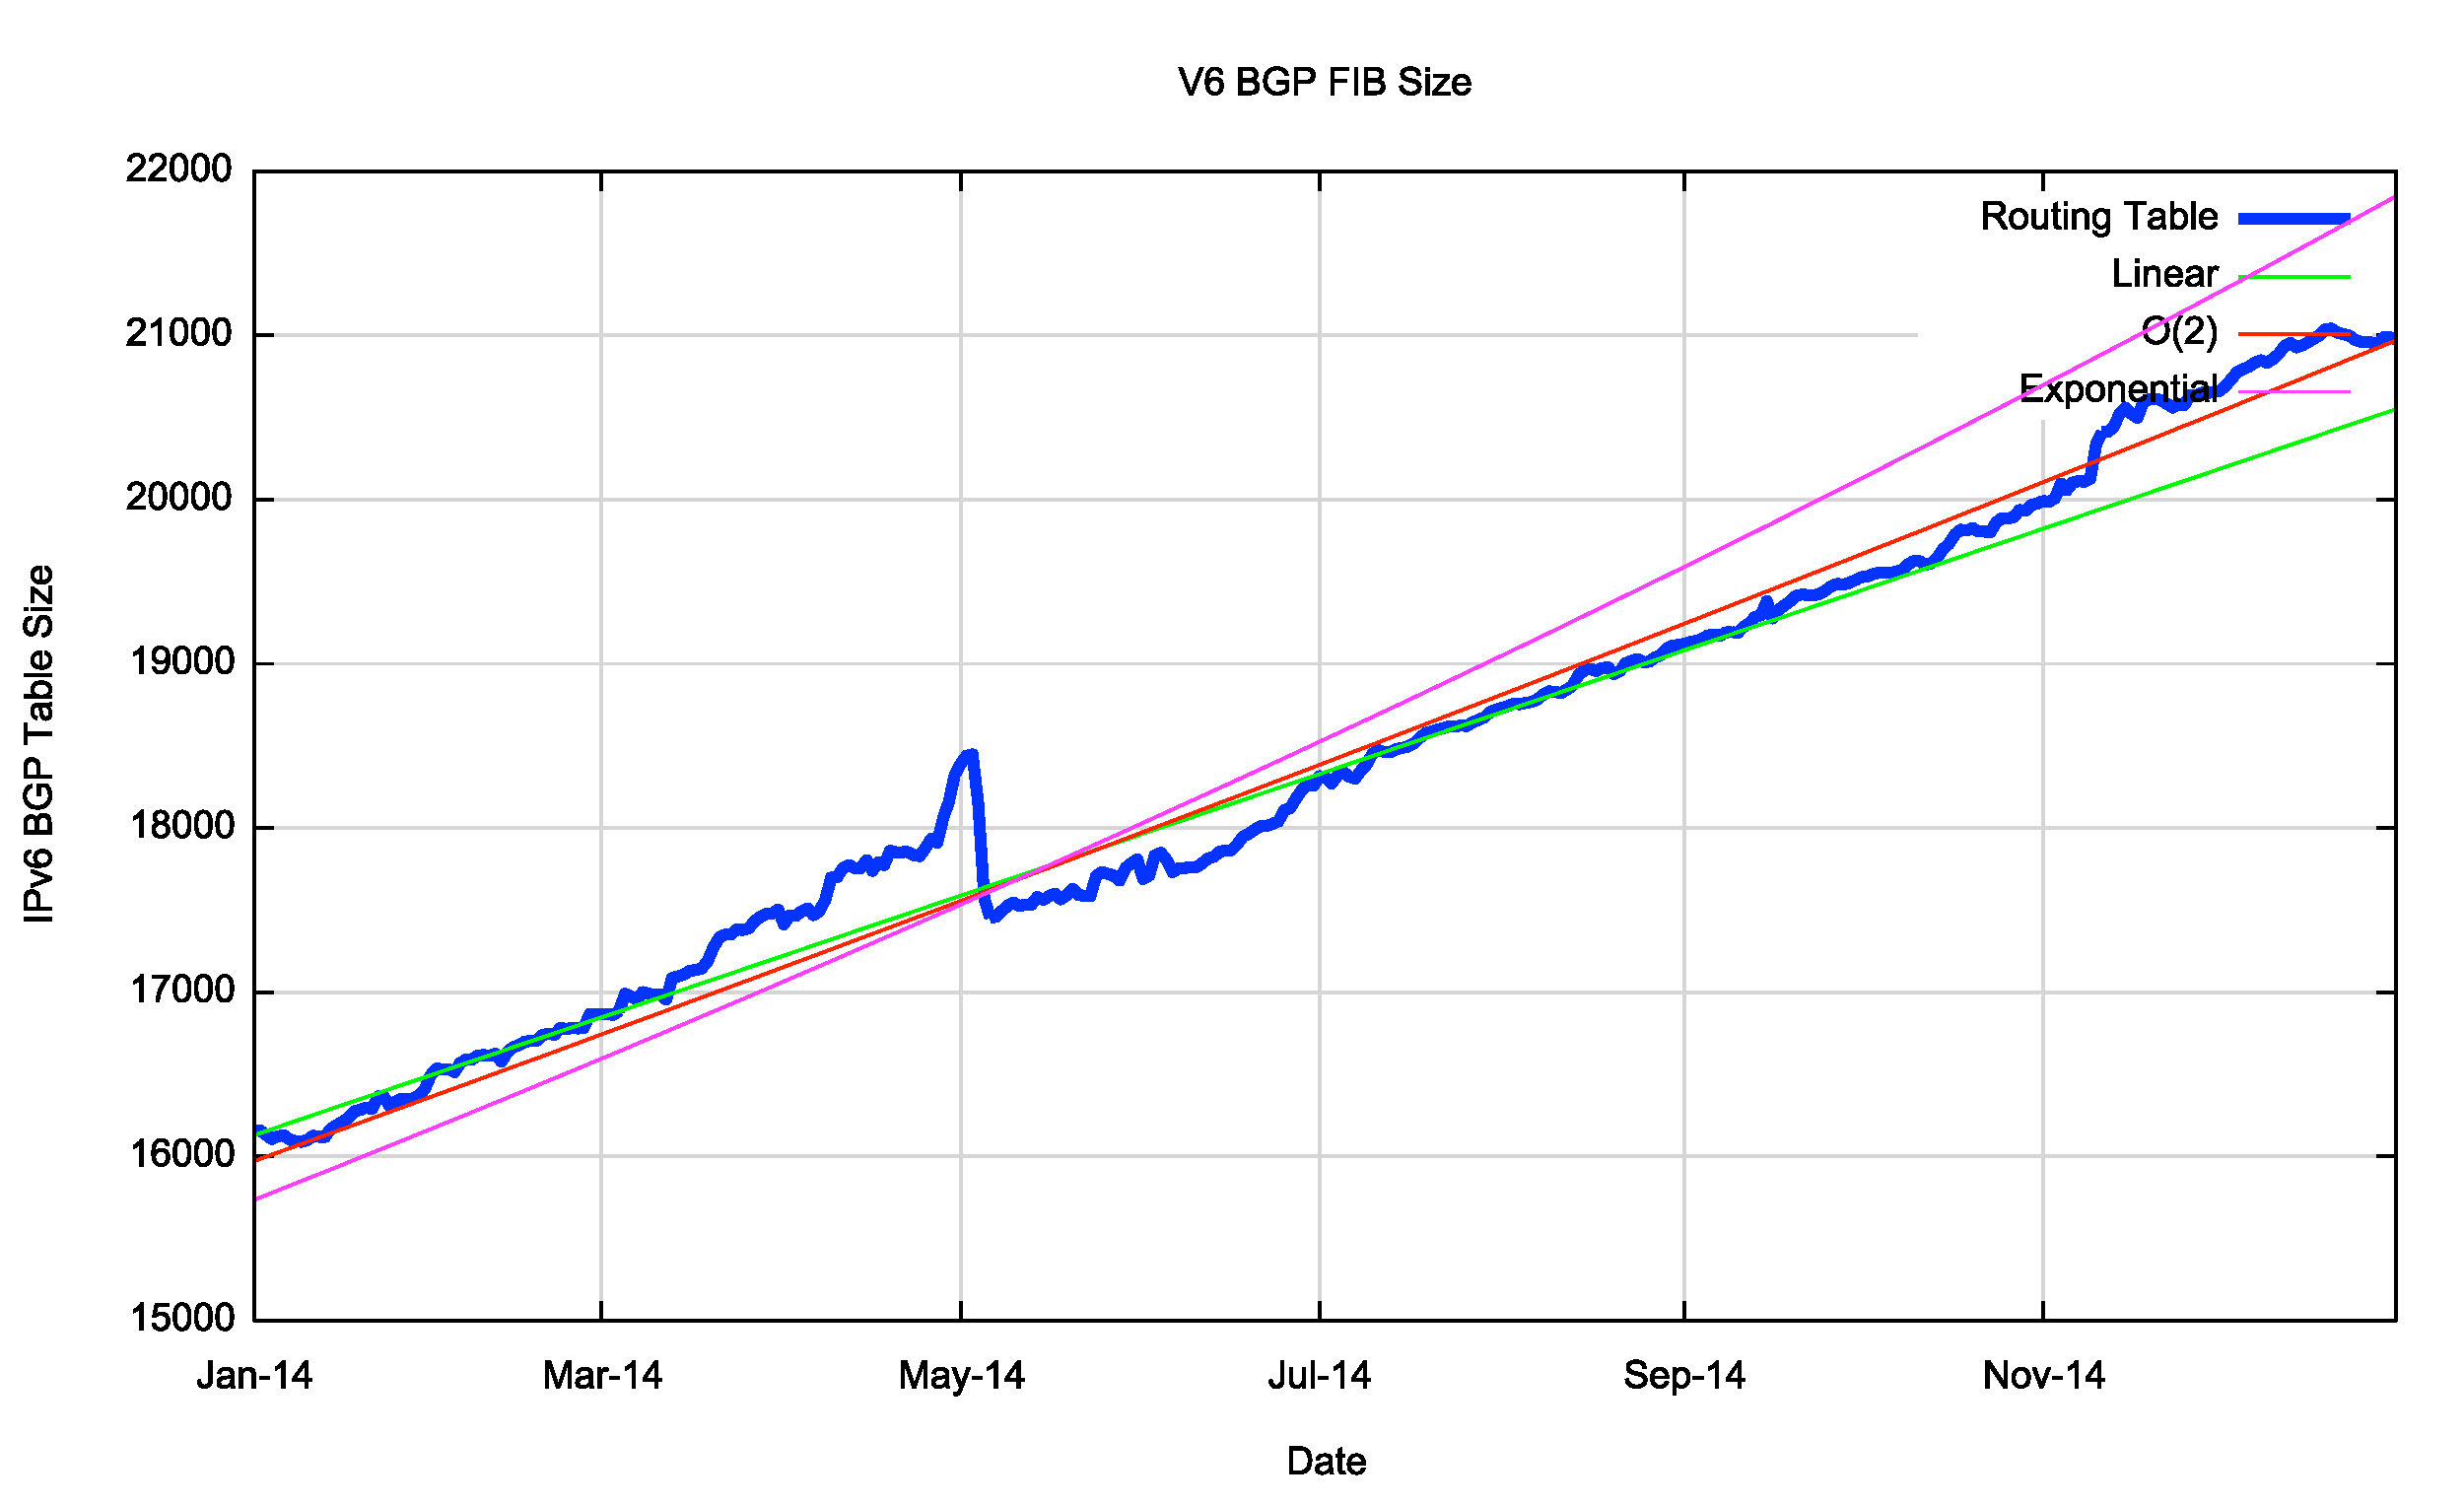
Figure 15 – IPv6 Table Growth in 2014
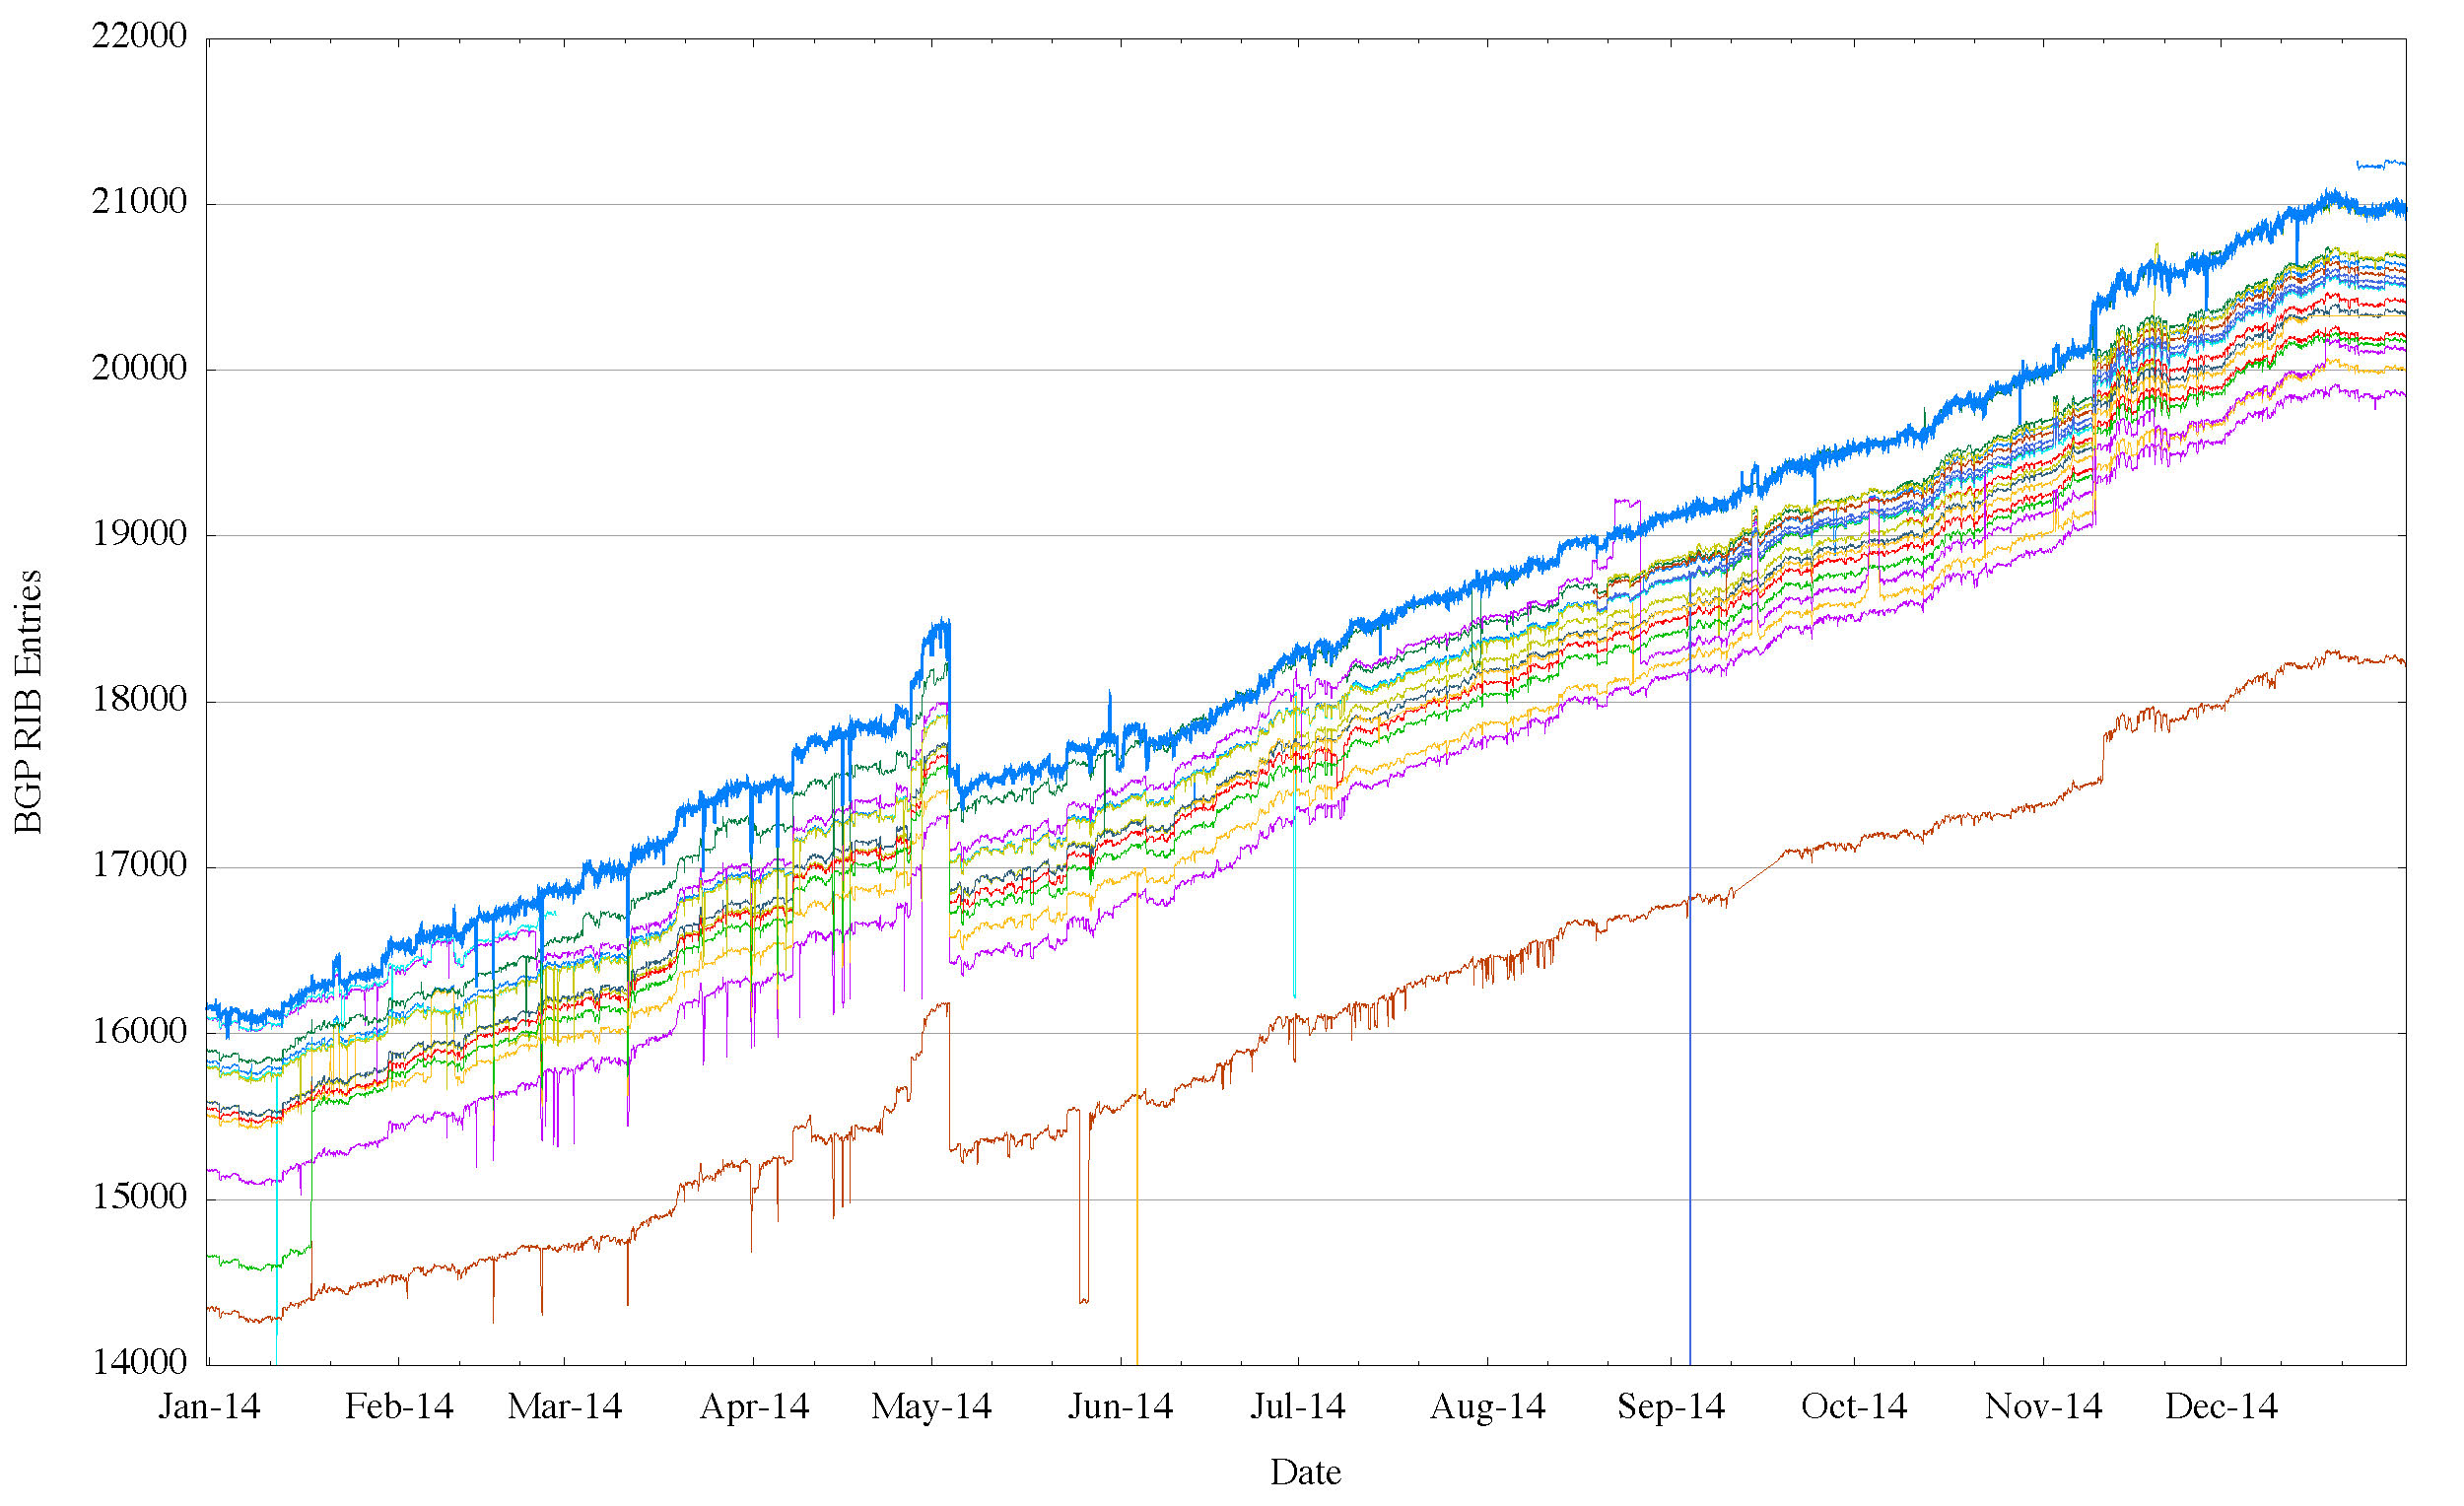
Figure 15 – IPv6 BGP Table in 2014, as seen by peers of Route Views
(each line tracks the daily size of an individual routing peer of the Route Views collector)
To compare the perspective of the routing table as seen by AS131072 and the perspectives from other networks, Figure 16 shows a set of views from the peers of the Route Views aggregator.
The Predictions
What can this data from 2014 tell us in terms of projections of the future of BGP in terms of BGP table size?
At the outset it’s appropriate to observe that this is a time of extreme uncertainty in the BGP prediction business! The run down of the available IPv4 address pools in the Asia Pacific region, Europe and the Middle East and in Latin and South America will be followed by a similar run down event for North America, currently anticipated to occur in early 2015. What was observed in the Asia Pacific region was an initial dampening on the growth in the advertised prefixes from Asia Pacific, followed by an acceleration in growth coming from the advertisement of smaller prefixes. It remains to be seen what will occur in the Americas, post exhaustion. What appears to be happening is that in the areas where the continued supply of IPv4 addresses is now operating under some form of austerity measure we are seeing the use of smaller address prefixes, presumably with the associated use of address sharing through NATs. It is unclear how long this will be sustained, and unclear the extent to which the routed environment in the IPv4 Internet moves to ever-smaller advertised prefix sizes.
So with the caveat that we are now heading deep into highly speculative areas, and the associated warning that the predictions being made here come with a very high level of uncertainty, lets look at the predictions for the Internet’s routing system for the coming few years.
Forecasting the IPv4 BGP Table
Figure 17 shows the data set for BGP from the 1st January 2010 until January 2014, and also shows the fit of the most recent 3 years of data to various models.
The first order differential, or the rate of growth, of the BGP routing table is shown in Figure 18. The rate of growth of the routing table appears to be increasing in the period 2009 to 2012. With the exception of the mid-2013 deaggregation event, the table growth in 2013 is at much the same level as 2012. The 2014 growth rate varied between 100 and 150 additional entries per day, which is consistent with the range of growth in the previous two years. From 2011 to the end of 2014 the average daily growth in the Ipv4 routing table has dropped from some 145 new entries per day to the current rate of some 130 new entries per day. If the first order differential matches a flat line, then the data set matches a linear slope. The data shows a slowly declining rate of growth, which is more consistent with a linear growth model than one of compound growth. The consequent predictions of IPv4 BGP table size using this constant growth model are shown in Table 3.

Figure 17 – IPv4 BGP Table in 2010 – 2014
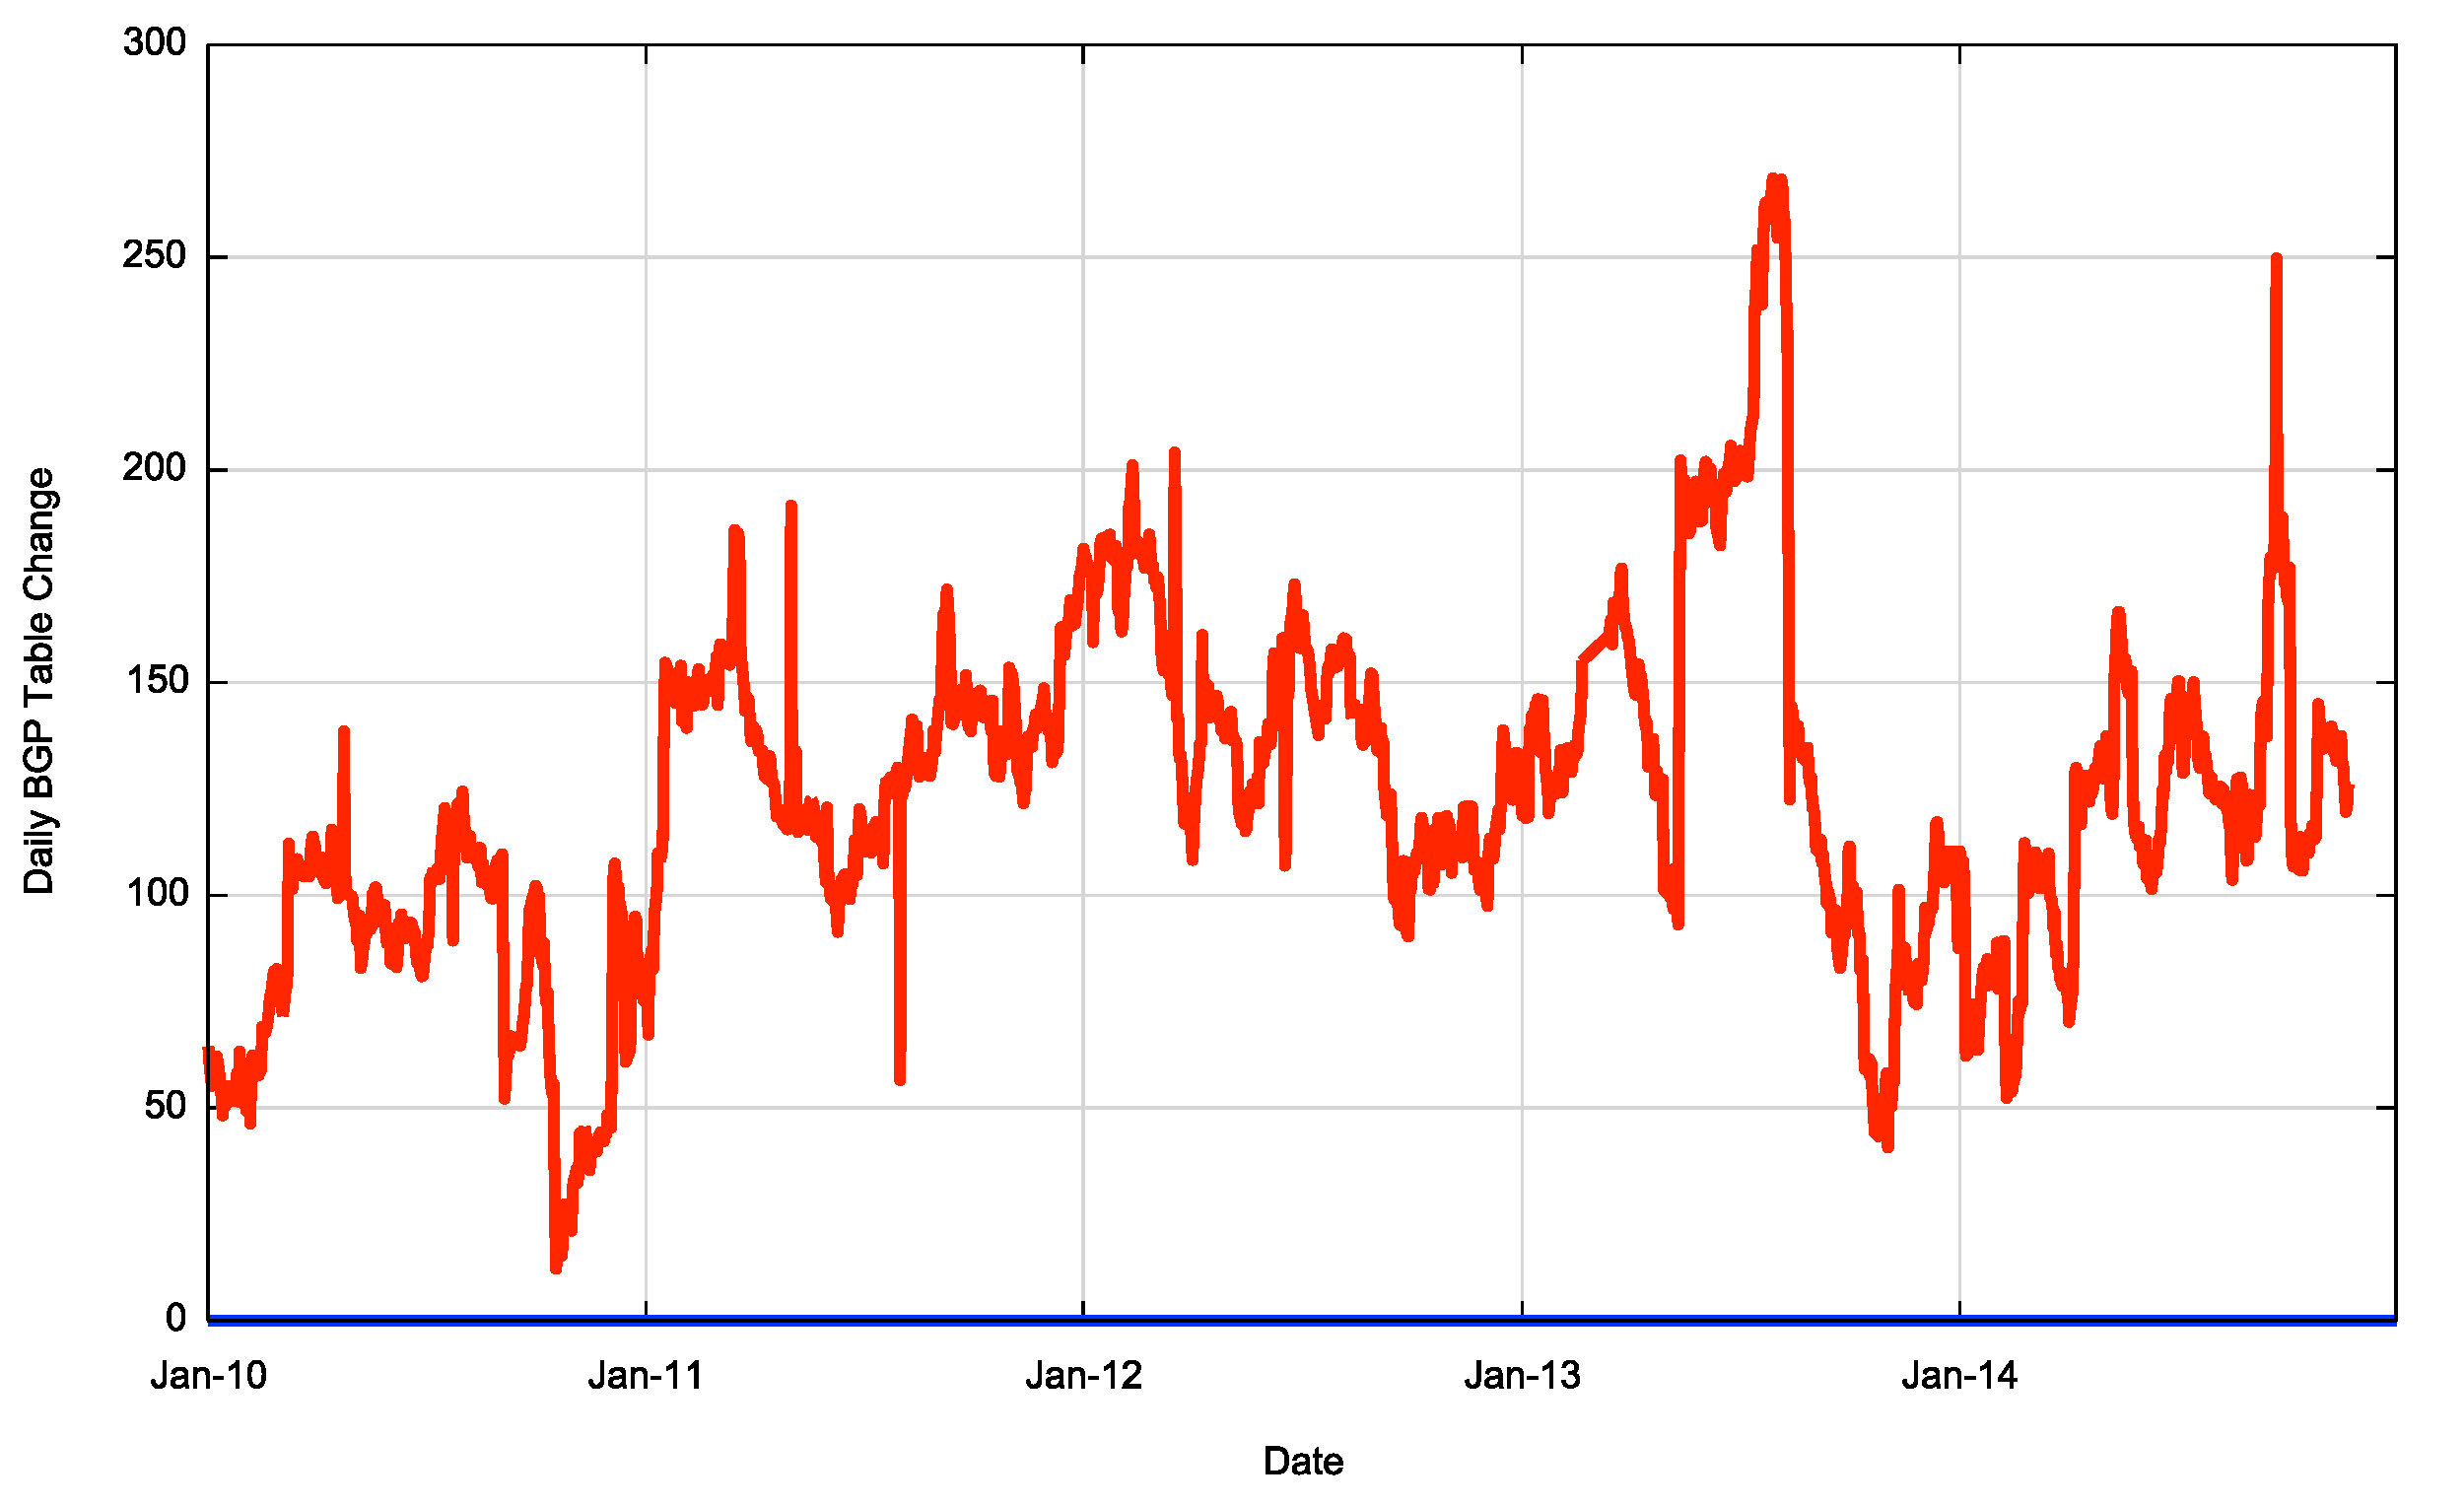
Figure 18 – First Order Differential of Smoothed IPv4 BGP Table Size
| IPv4 Table | IPv4 Prediction | |
| Jan 2012 | 389,983 | |
| Jan 2013 | 441,172 | |
| Jan 2014 | 488,011 | |
| Jan 2015 | 529,806 | |
| Jan 2016 | 580,000 | |
| Jan 2017 | 620,000 | |
| Jan 2018 | 670,000 | |
| Jan 2019 | 710,000 | Jan 2020 | 760,000 |
Table 3 – IPv4 BGP Table Size Prediction
With the caveat that this prediction is based on the assumption that tomorrow will be a lot like today and that the influences that shape tomorrow have already shaped today, then its reasonable to predict that the IPv4 routing table in a little over five years time, at the start of 2020, will contain an additional 250,000 entries, making a total for IPv4 of some 760,000 entries in the BGP routing table at that time.
However I’m not all that confident in the predictions generated by this model. It is simply not possible to use the current models of BGP growth to peer into the longer term aspects of this post-exhaustion IPv4 routing environment. Further growth in the IPv4 routing environment is going to be fuelled in ever-finer granularity in the size of prefix announcements, rather than the release of “new†address space. To what extent this tend of increasingly finer levels of granularity in the routing system is feasible remains an open question.
A Second Look at IPv4 Routing Advertisements
These predictions for the size of the IPv4 BGP network growing by a continued 45,000 new routing entries per year assume that the near term future will continue to play out much the same as the recent past. But, as we’ve noted, the issues related to IPv4 address exhaustion make this assumption somewhat implausible. So lets take a more detailed look at IPv4 across 2014, and to do this I’ll take a comparison of a snapshot of the routing table as of the start of 2014 to that at the end of the year.
At the start of the year the BGP routing table in AS131072 had 488,070 entries, and at the end of the year it had 529,879 entries. The routing table grew by 41,809 entries through the year – right?
Mathematically that correct, but it’s not the entire story. The issue here is that BGP is not just used to glue the Internet together in a reachability sense. Routing is also the only tool we have to adjust the path taken by incoming traffic, so in a sense we could say that the routing table contains the cross product of reachability and routing policies. At any point in time there are a collection of “traffic engineering†prefixes, and a set of reachability prefixes. The sum of the two snapshots contains 598,487 entries. In fact there are were only 419,461 routing entries that were in both routing snapshots. Some 68,608 routes that were announced at the start of the year, but not at the end, while a further 110,417 routes were visible at the end of the year that were not announced at the start.
So can we differentiate between what appears to be the background of traffic engineering route changes from the routes that appear to be announcing reachability to previously unreachable addresses? One approach is to divide the routing table into “root†prefixes, that announce reachability, and “more specific†prefixes that refine this reachability for parts of this announced space. At the start of the year there were 238,664 root prefixes and 249,406 more specifics. At the end of the year there were 258,495 root prefixes and 271,384 more specifics. That’s a net growth in 19,831 roots and 21,978 more specifics.
Let’s look at these root prefixes slightly closer. What would be good to understand is which new root prefix announcements announce address space that was not announced at the start of the year. That is, which new prefixes contributed to a change in reachability? Furthermore can we determine the date when this new announced space was recorded in the RIR registry as being assigned or allocated? What is the distribution of the registry age of new addresses in the routing table? And how does this age distribution compare to the last full year of unconstrained IPv4 address allocations in 2010?
Figure 19 shows the relative age (as determined by the date of registration of the address) for addresses that were advertised each year since 2010. The effects of IPv4 address exhaustion are now clearly visible in that the amount of advertised addresses per year has dropped from just below 200 million addresses per year in 2010 and 2011, to around 100 million addresses in 2013 and 2014.
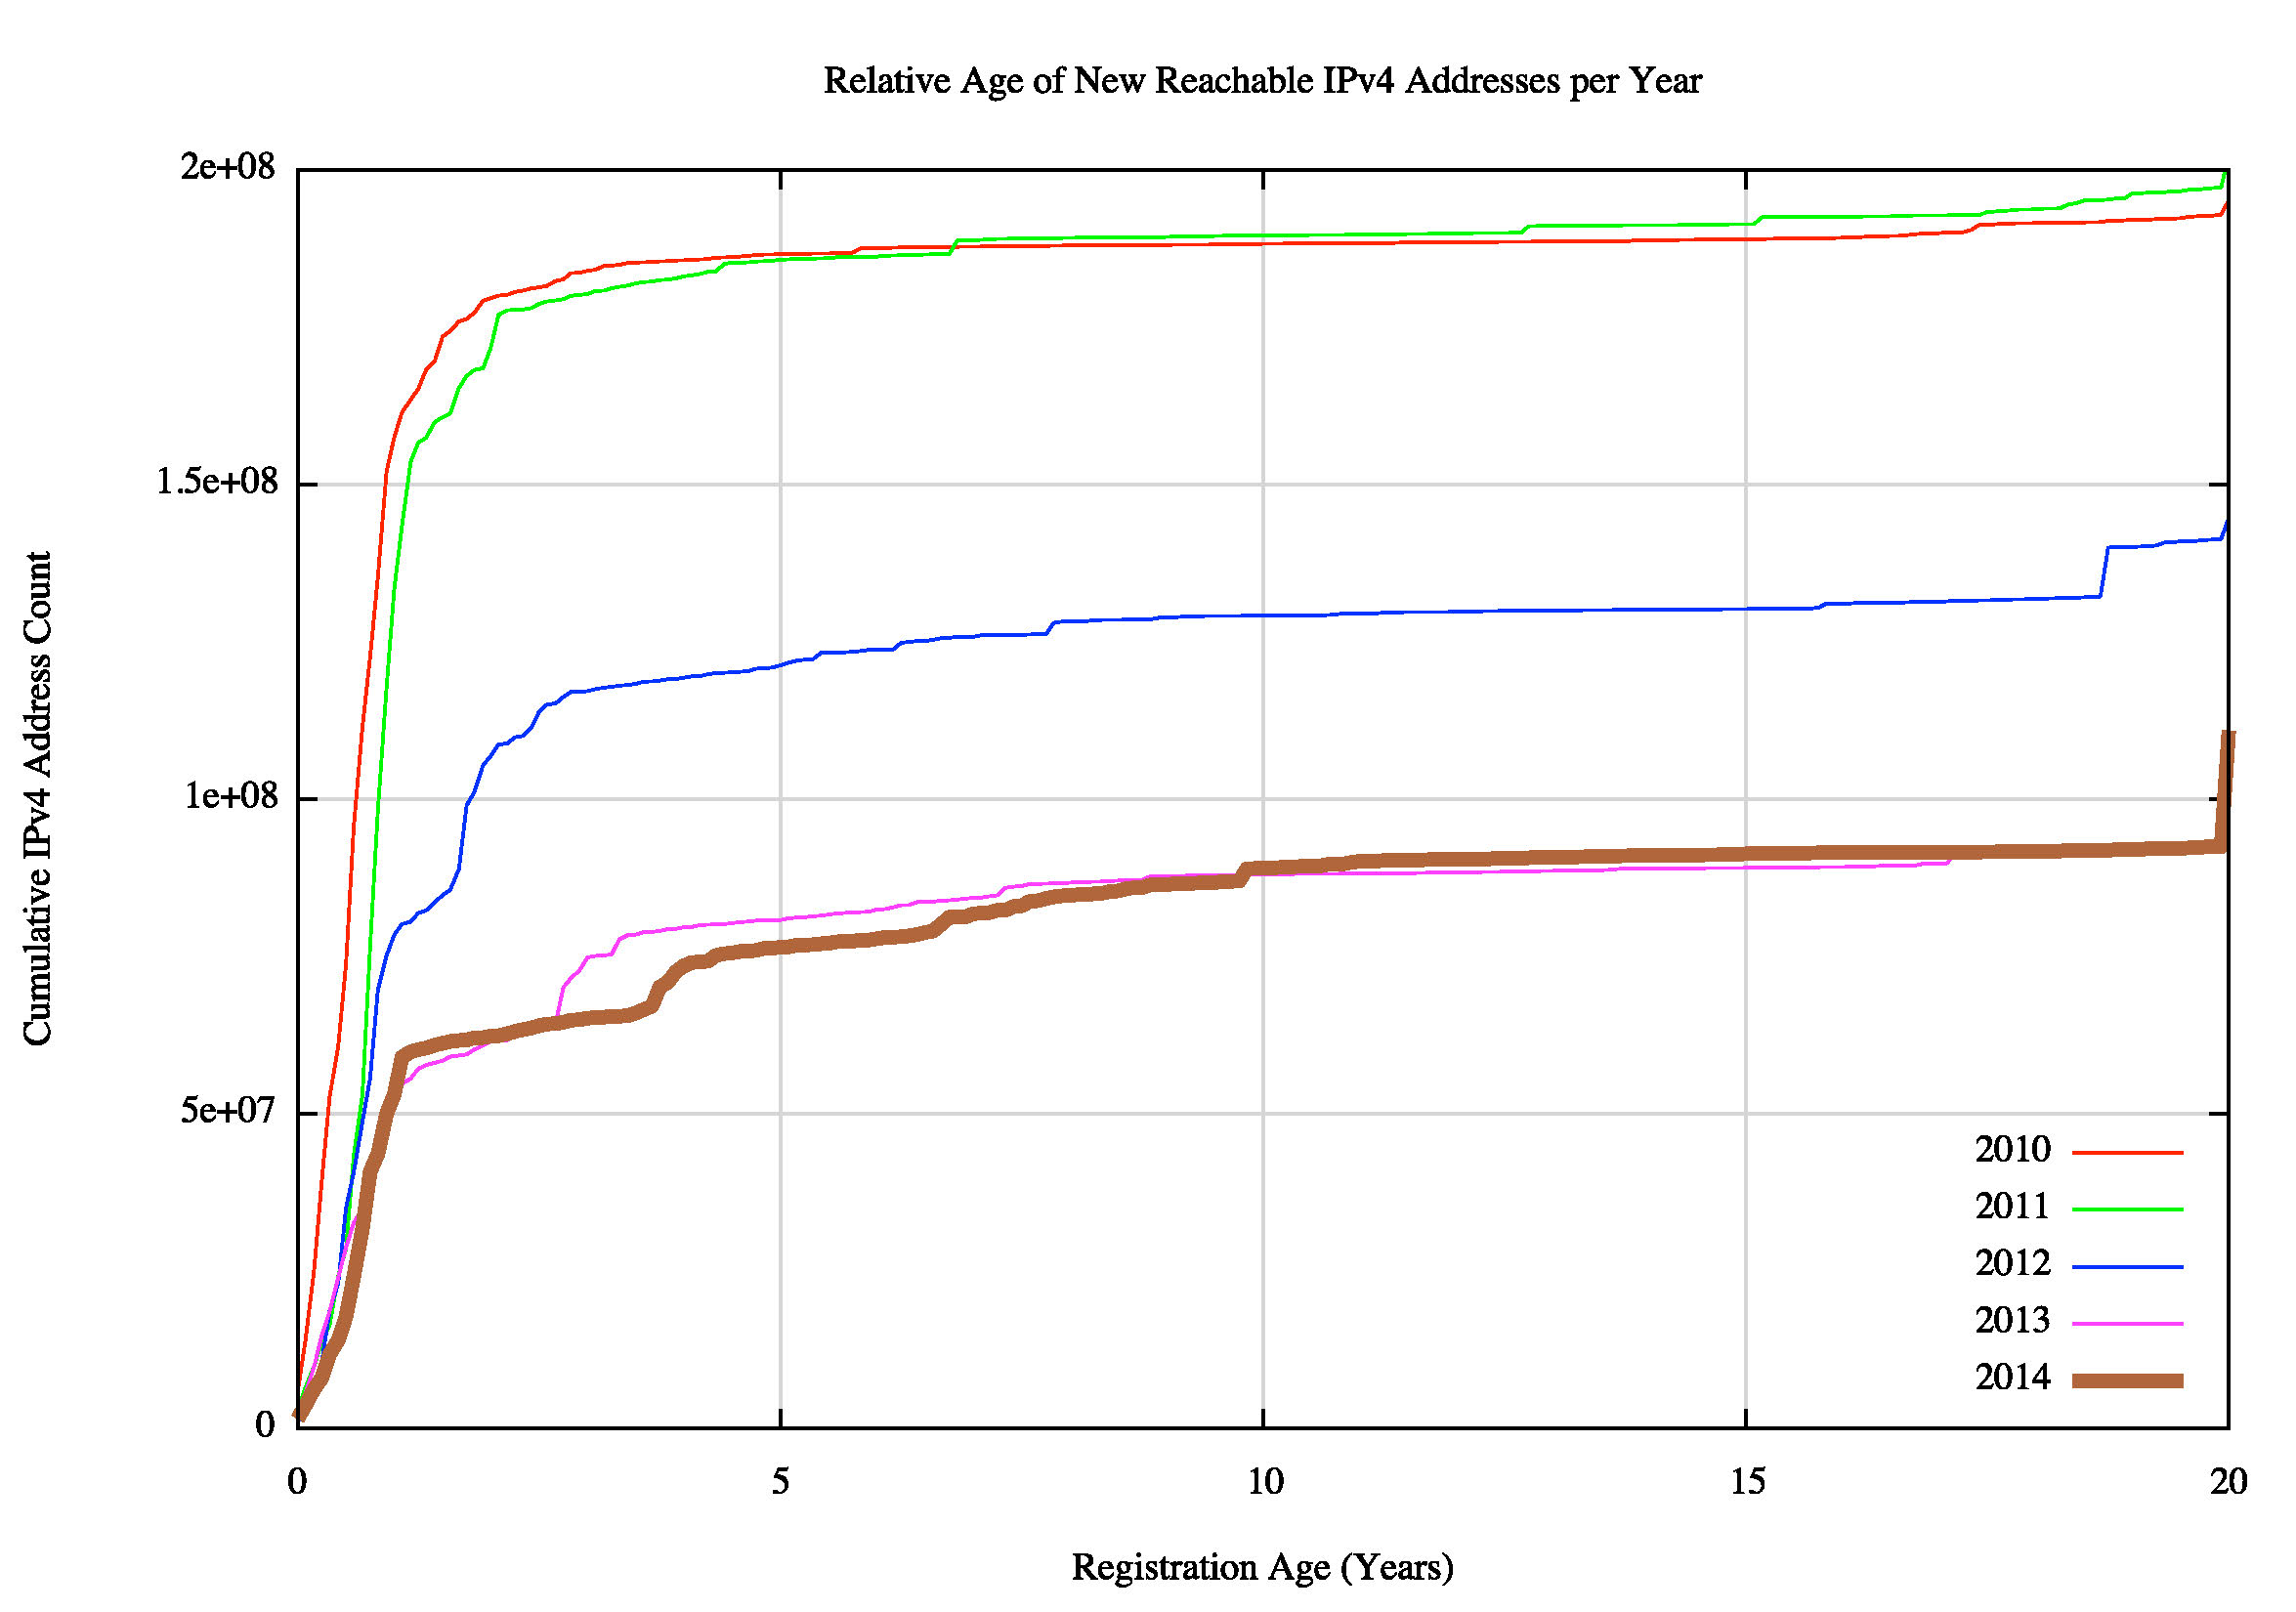
Figure 19 – Relative age of advertised addresses per year (from 2010)
With the onset of exhaustion of the general allocation pools of IPv4 addresses, we have seen the emergence of address trading. Is this visible in the routing table? Figure 20 shows the same data, using a cumulative relative % of allocated addresses per year, to allow us to directly compare the age profile each year.
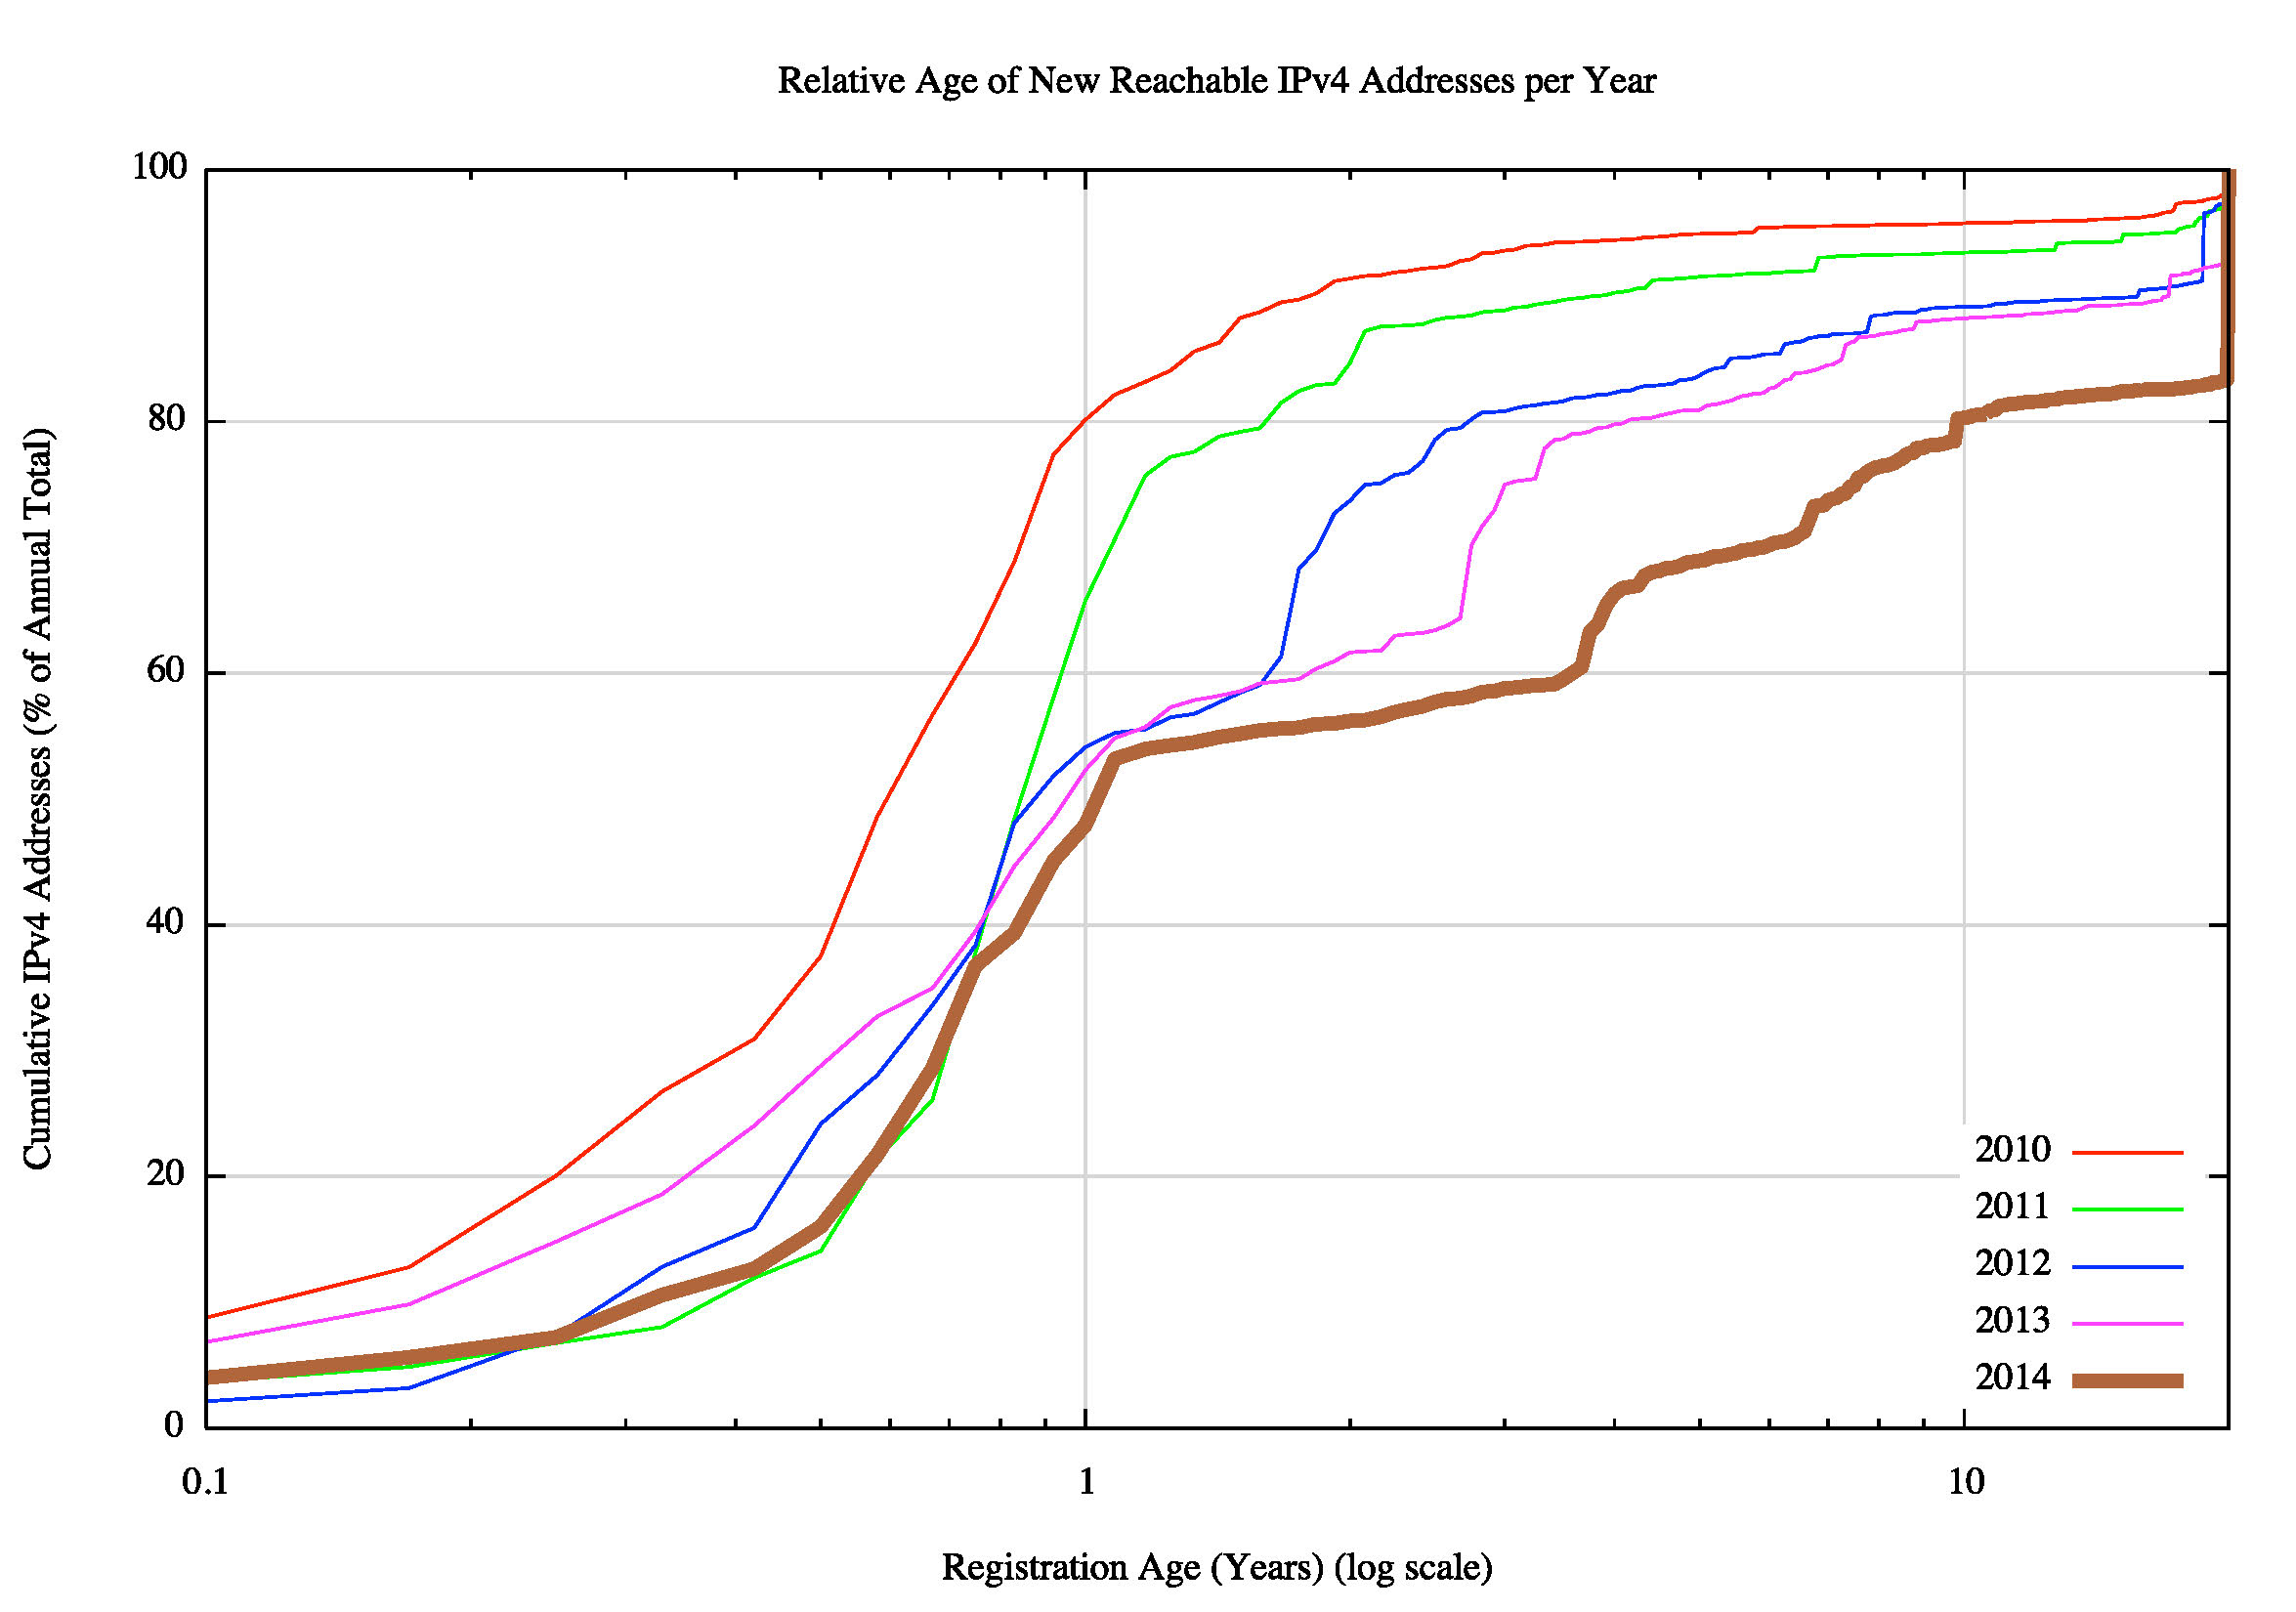
Figure 20 – Relative age profile of advertised addresses per year (from 2010)
In 2010, 80% of all newly advertised addresses in the year were allocated in the same year. In other words most of the growth in advertised addresses in 2010 came of new allocations of address space. But with the onset of address exhaustion from 2012 onward this level has dropped. In 2014 less than half the newly advertised addresses were allocated in 2014. Some 15% of these new addresses are between 1 and 3 years old. In 2010 less than 10% of newly advertised addresses were more than 3 years old. At the time, when network operators needed further IPv4 addresses they turned to allocations from their Regional Internet Registry. In 2014 this figure has jumped to 40% of advertised addresses being more than 3 years old, and some 17% of these addresses are more than 20 years old, and were part of the early allocations that form the “legacy†address pool.
This data tends to support the intended objective of address trading in a post-address exhaustion environment, namely to allow holders of otherwise idle or non-publically used IPv4 addresses to release them for use by current network operators.
This figure also shows that these new addresses that are announced in this manner are getting older each year. It appears that each year we searching for available addresses for transfer in ever-older original allocation records.
At the end of 2014 there are some 890 million IP v4 addresses that have been allocated but are not visible in the routing table. However the efficiency of recovery of these unadvertised addresses will decrease over time, and it is reasonable to expect that if the demand levels for IPv4 continue, then the pricing function in address transfer markets will reflect this increasing difficulty in obtaining available addresses in the coming years. This price escalation not only makes additional addresses accessible for transfer, but also increases the potential for address sharing technologies, such as Carrier Grade NATs, as a means of extracting ever high values from each address. It is also thought that that such a price escalation in the IPv4 address transfer market would also strengthen the case for operators to deploy IPv6 in their networks, although there is little in the way of direct evidence so far to substantiate such a claim.
So can we rationally expect the IPv4 address table to reach 750,000 entries in five years time? It is one possible scenario, but in so saying that, it also would imply that in five years time it would still not be a viable option to operate a network service using IPv6 exclusively. That scenario would be a clear signal of failure in the overall transition to IPv6 at the time. So what can we see in the Internet’s routing data about the prospects for IPv6?
Forecasting the IPv6 BGP Table
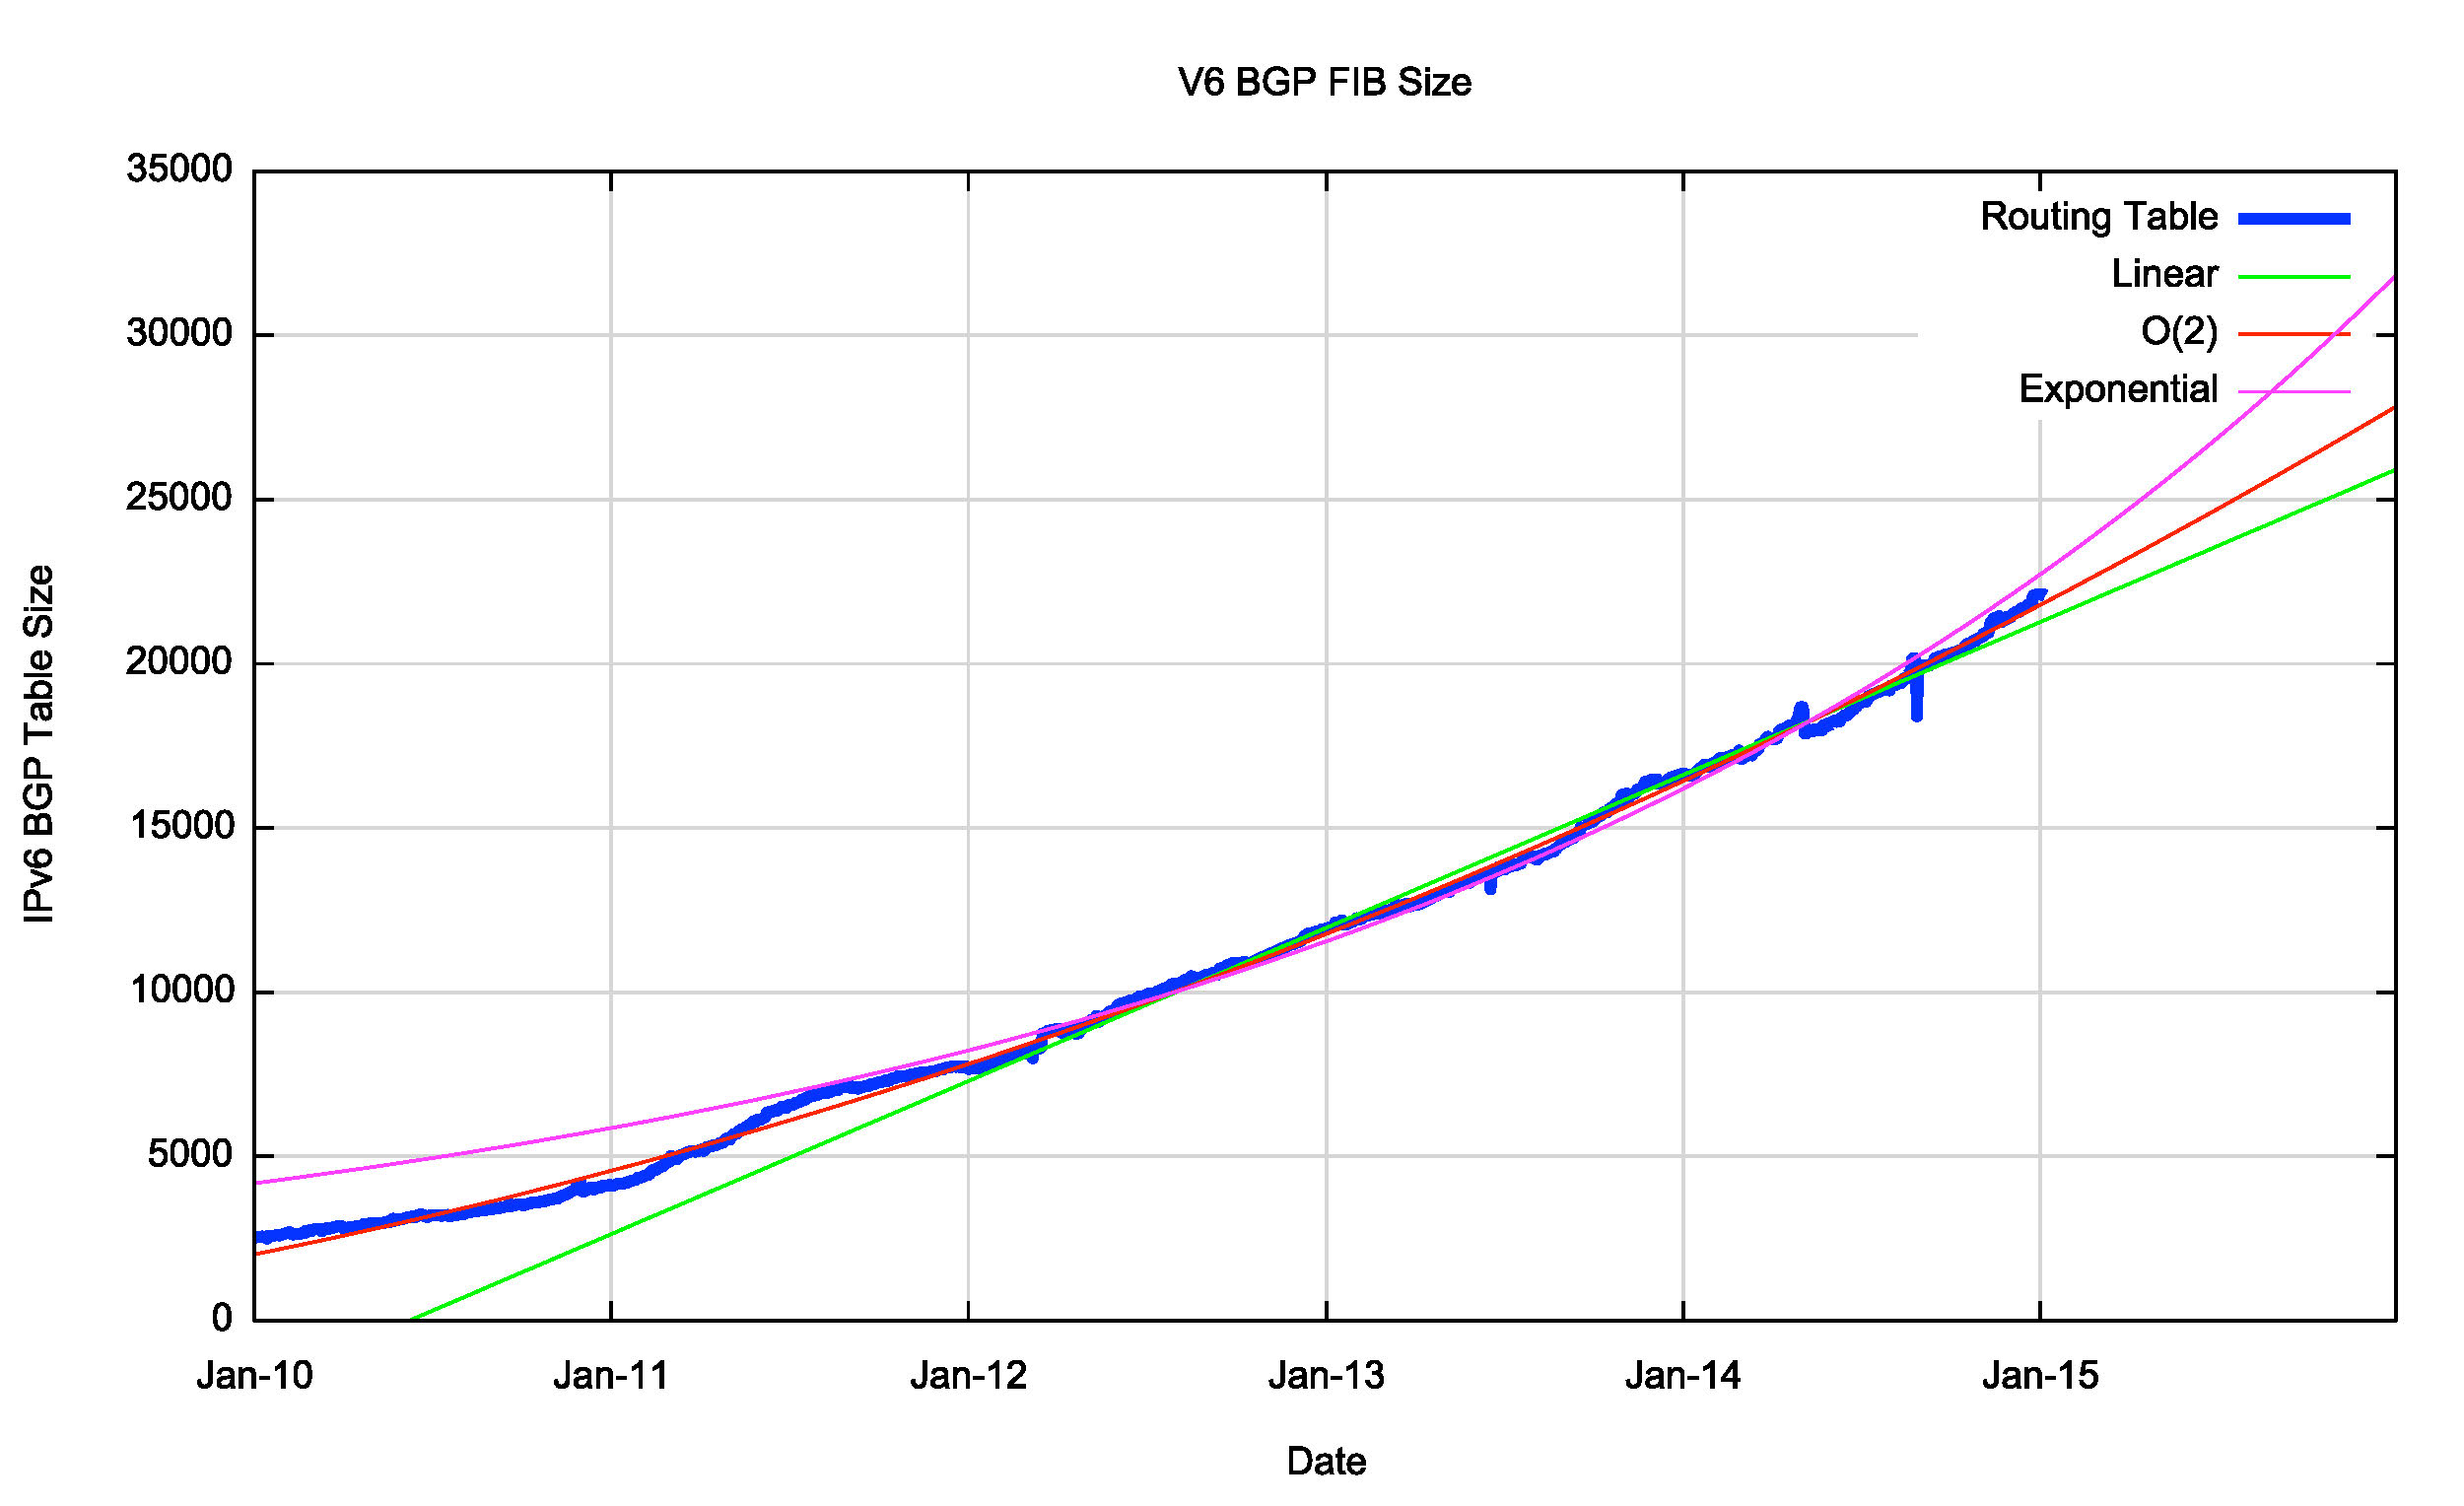
The same technique can be used for the IPv6 routing table. Figure 21 shows the data set for BGP from the 1st January 2010 until January 2015.
The first order differential, or the rate of growth of the IPv6 BGP routing table is shown in Figure 22. The picture for IPv6 was relatively modest in early 2009, with the table growing in size by an average of 2 new entries per day. The rate of growth has increased in the intervening period to the current to the current level of some 15 to 20 new entries per day. Obviously this is far lower than the equivalent figure in the IPv4 domain, which is growing by some 100 – 150 new entries per day, but it does show a consistent level of increasing growth.
This implies that a linear growth model is inappropriate for modelling growth in IPv6. A better fit to the data is a compound growth model, with a doubling factor of some 22 months. It is possible to fit a linear model to the first order differential of the data, which can be used to derive an O(2) polynomial fit to the original data. The fit of a linear, O(2) polynomial and an exponential model against the data is also shown in Figure 20.
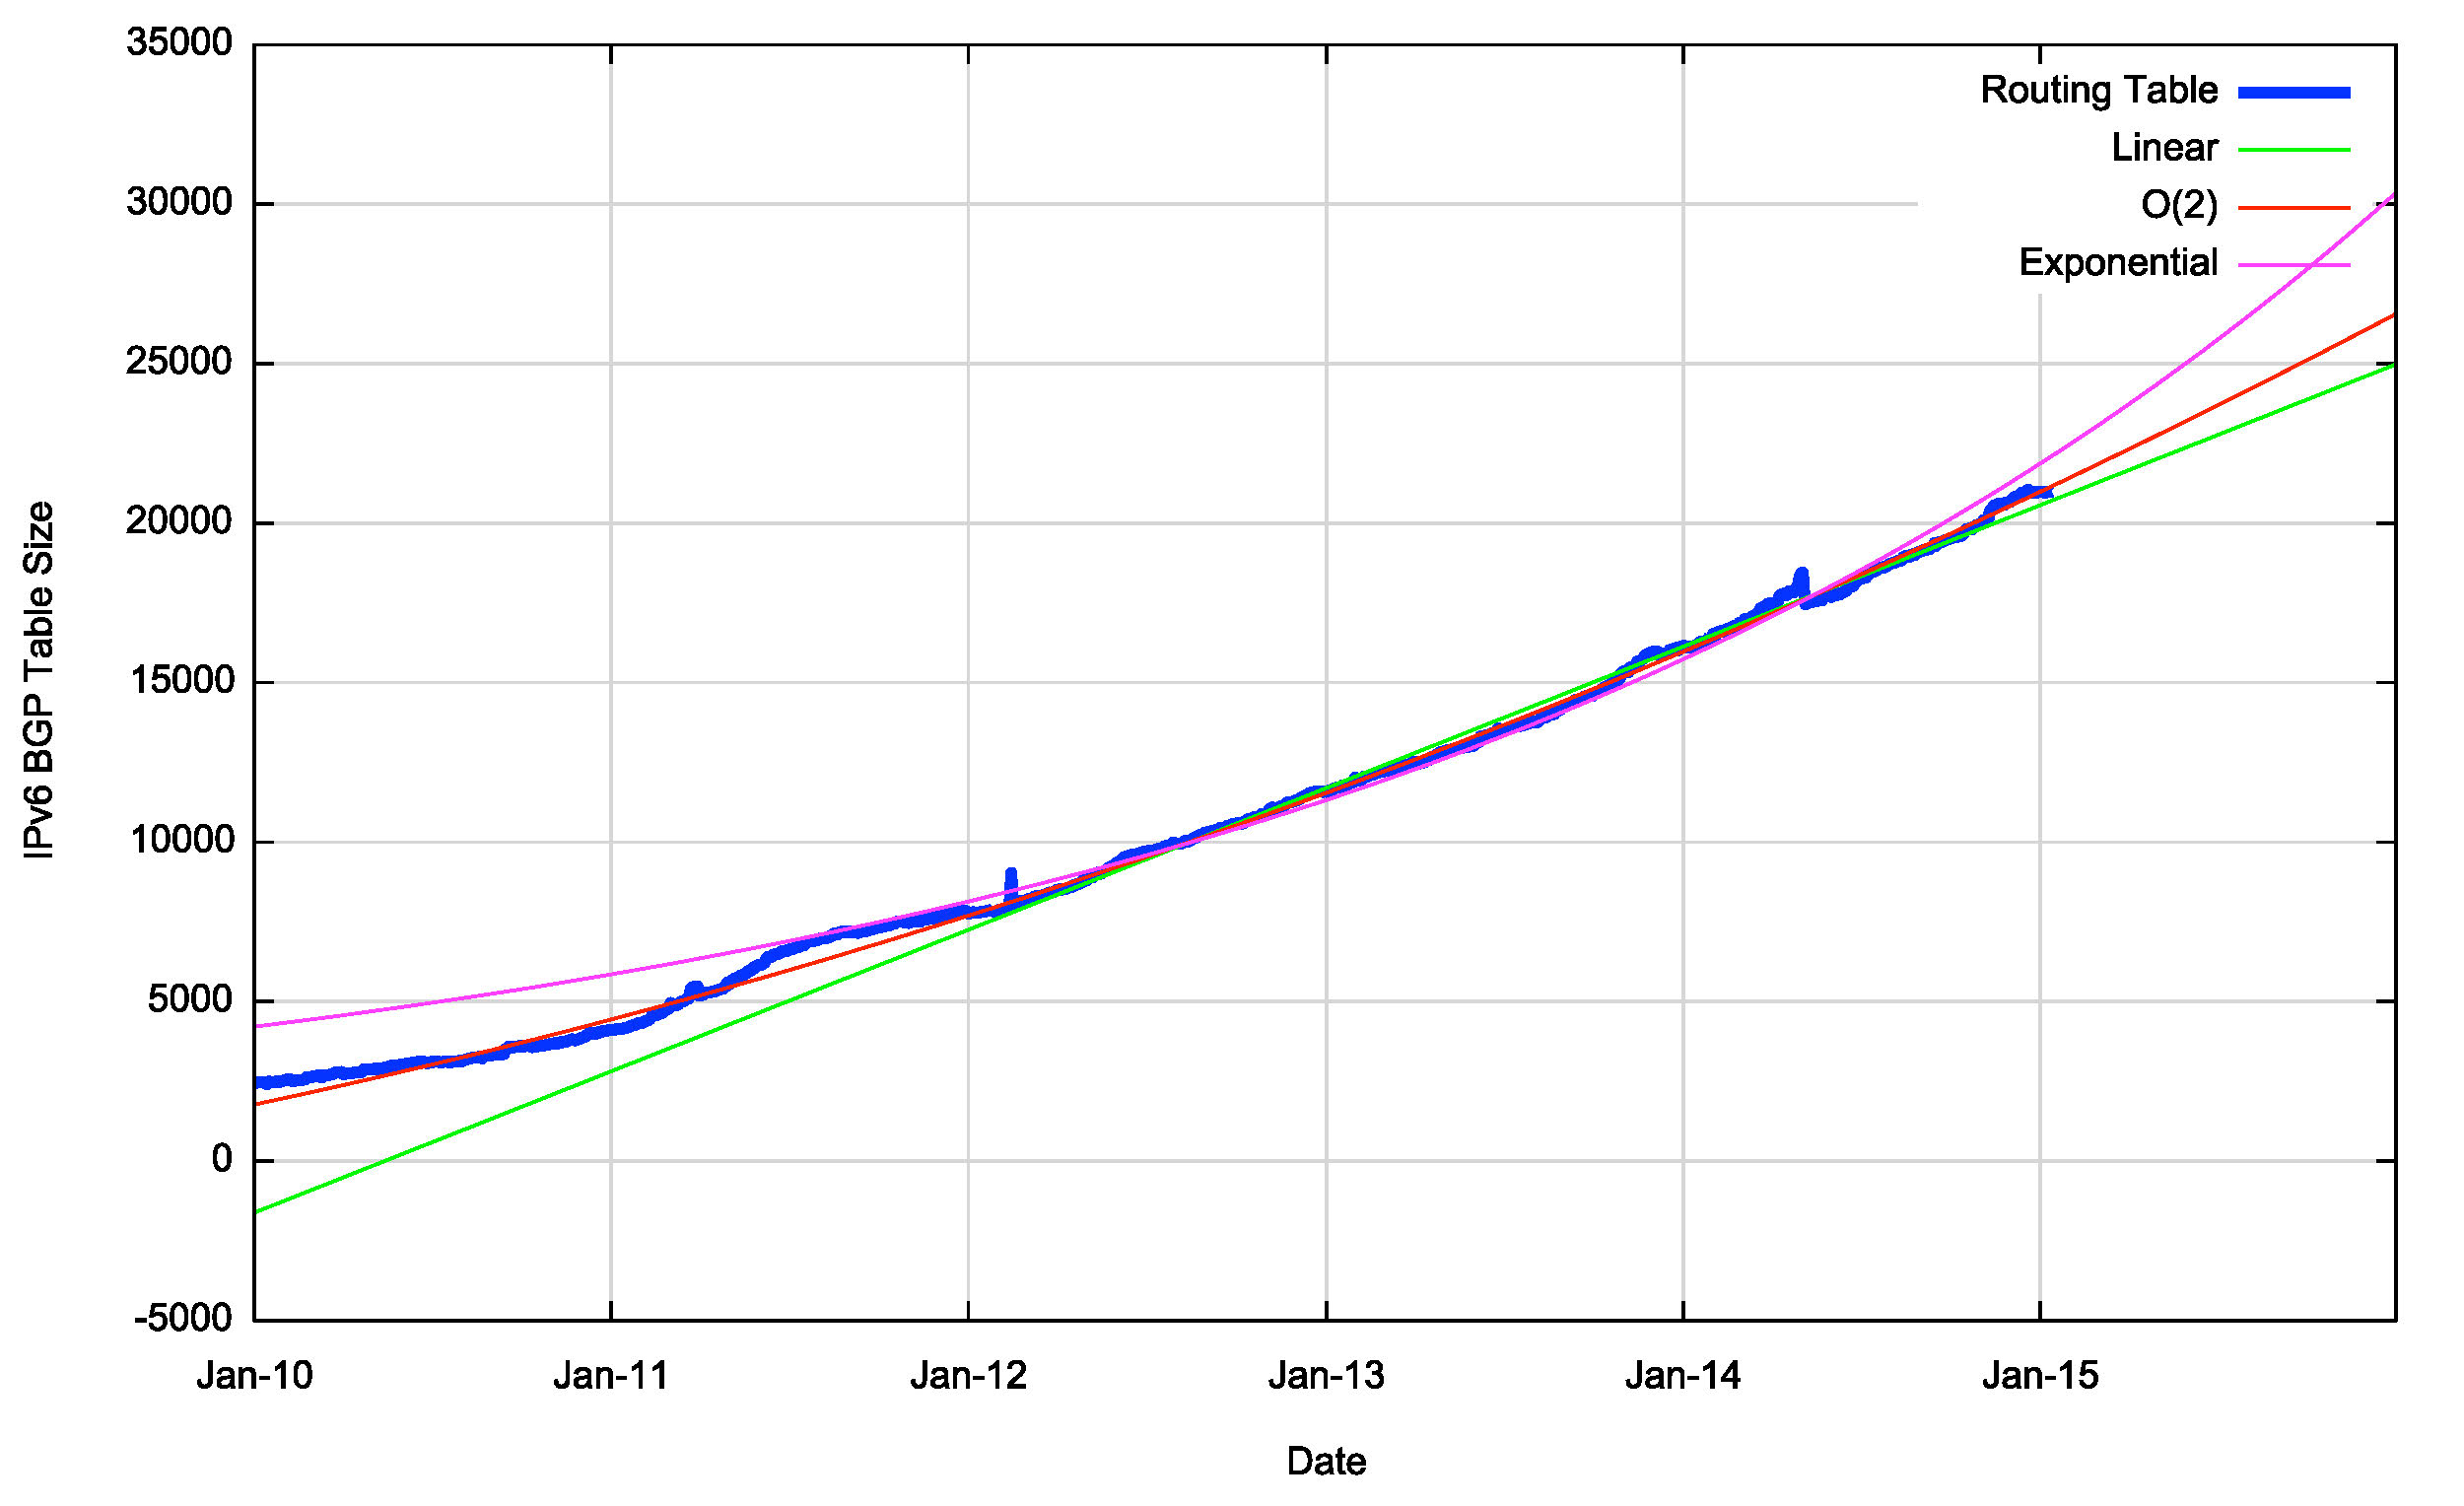
Figure 20 – IPv6 BGP Table Size from 1 January 2010
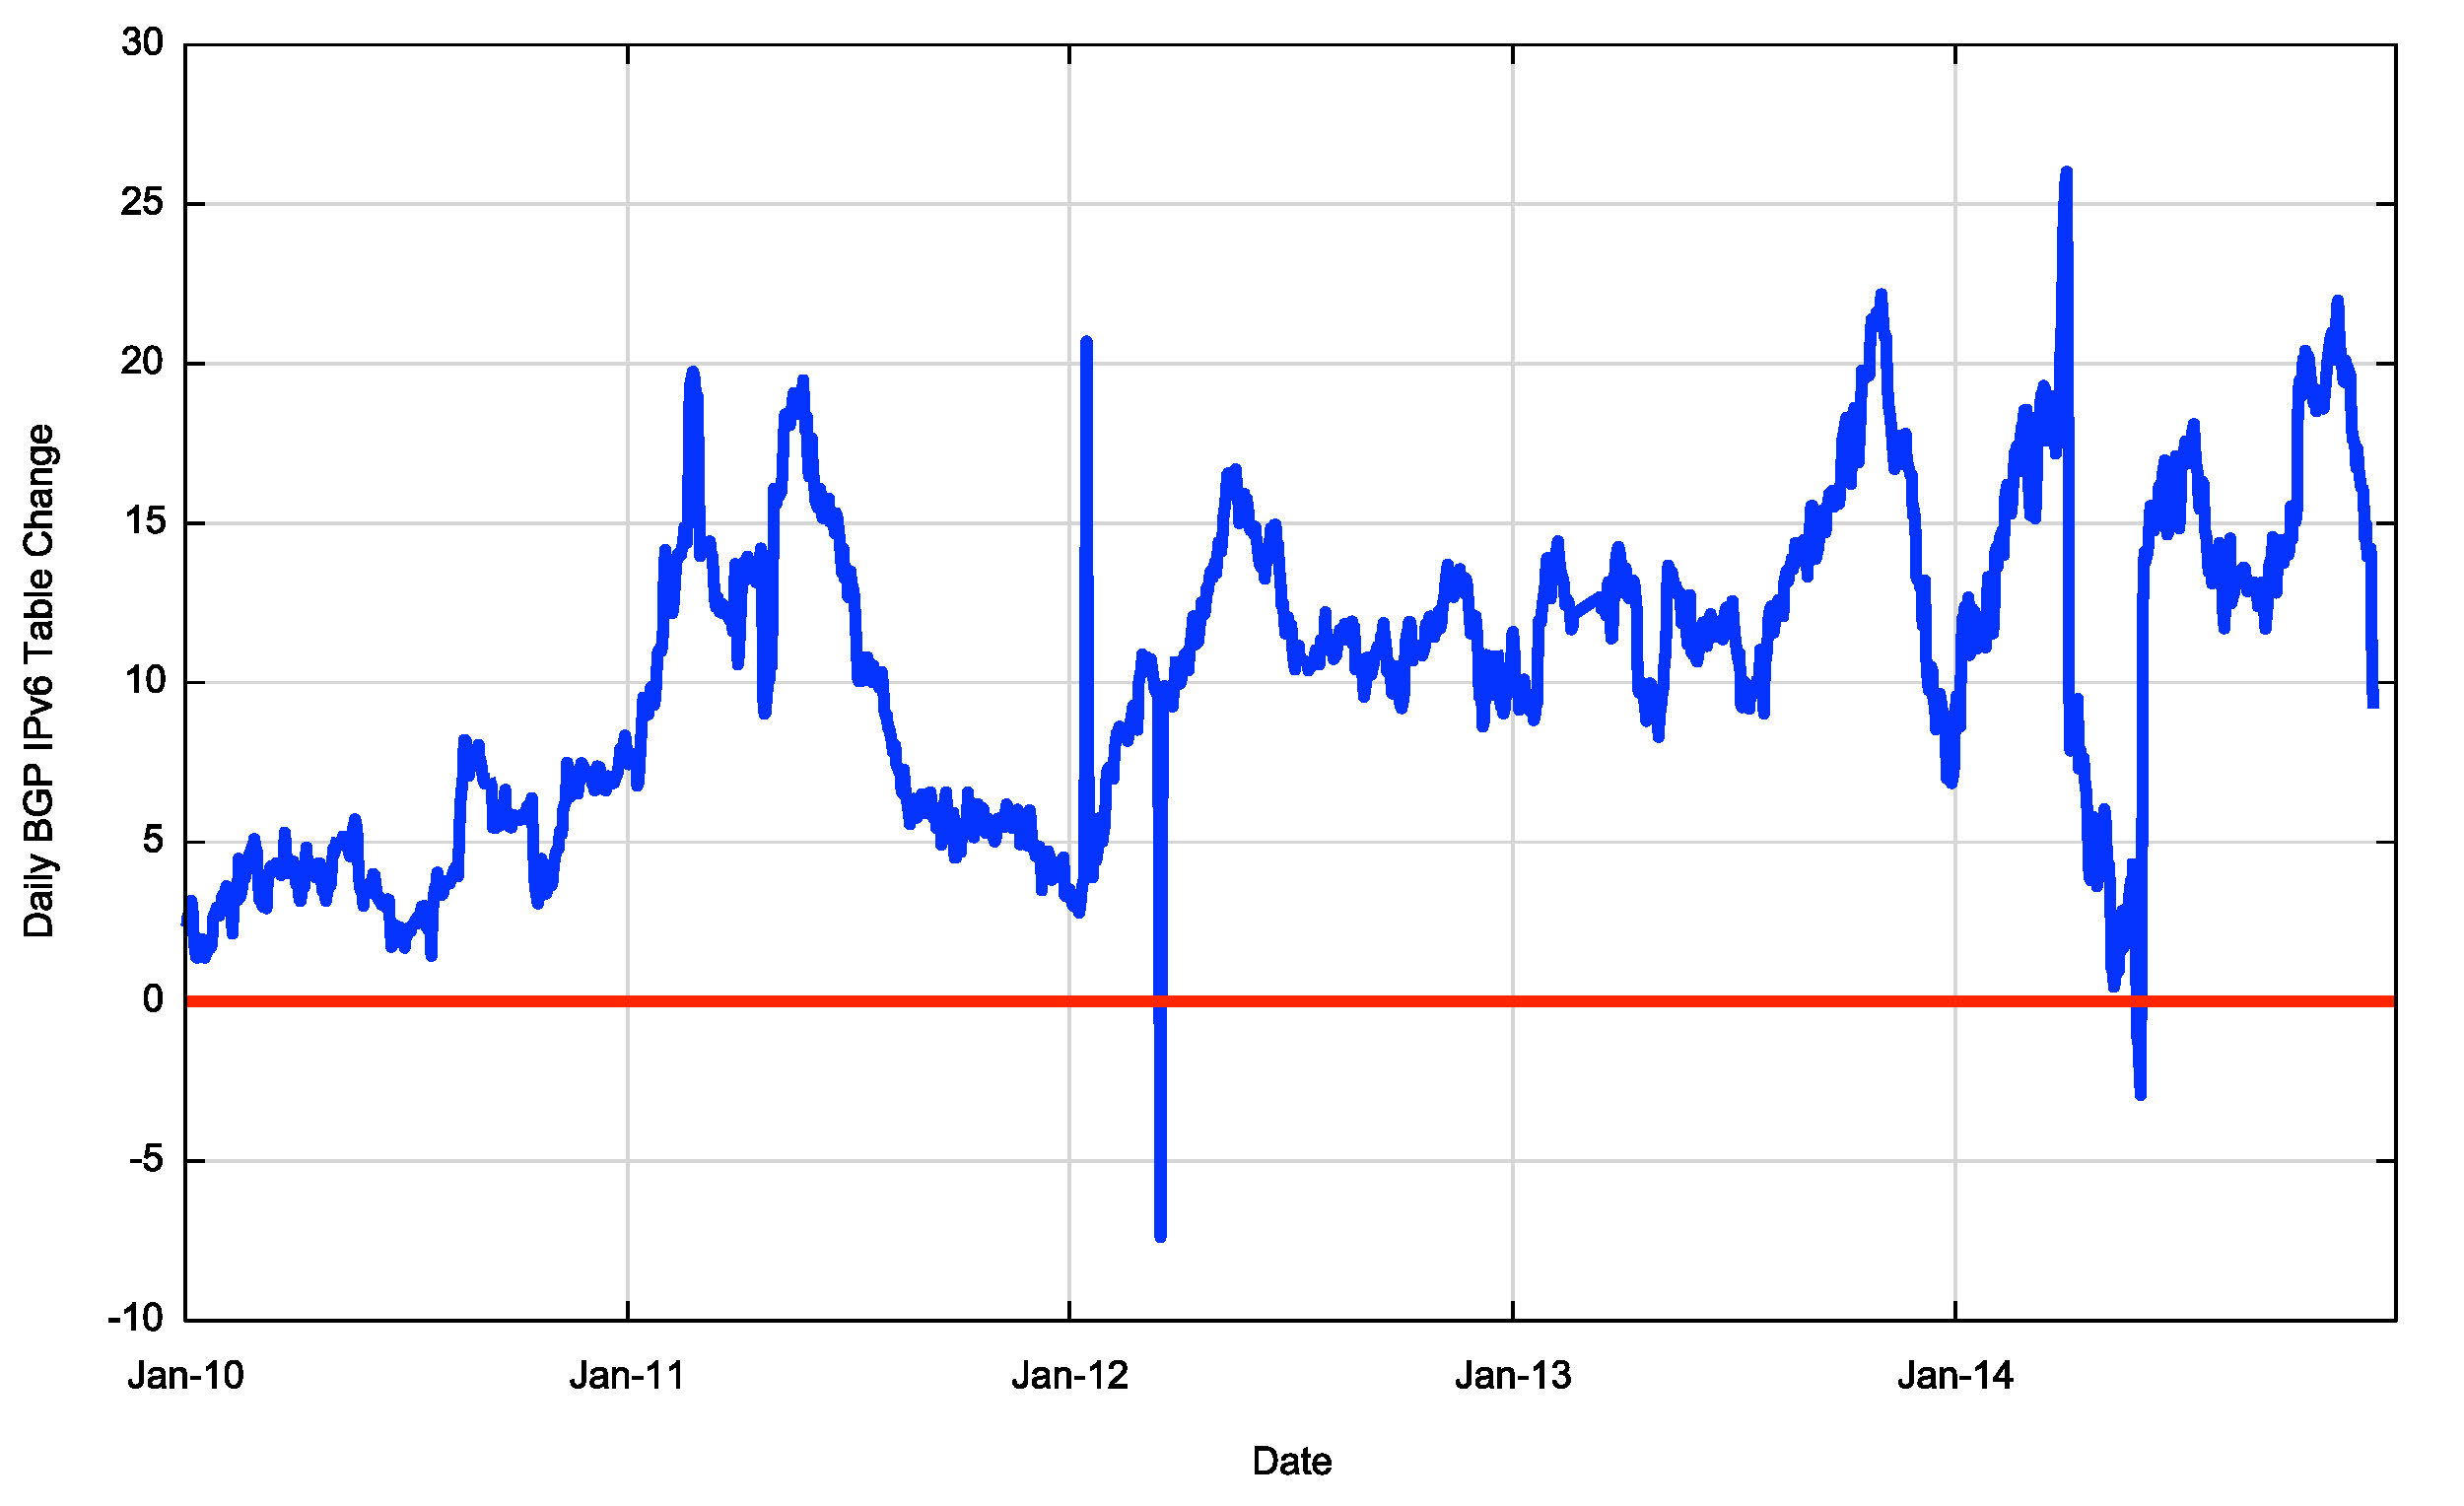
Figure 21 – First Order Differential of Smoothed IPv6 BGP Table Size
The projections for the IPv6 table size are shown in Table 4.
| IPv6 Table | IPv6 Prediction Exponential |
IPv6 Prediction Polynomial |
|
| Jan 2012 | 7,769 | ||
| Jan 2013 | 11,600 | ||
| Jan 2014 | 16,158 | ||
| Jan 2015 | 20,976 | ||
| Jan 2016 | 30,390 | 26,582 | |
| Jan 2017 | 42,273 | 32,782 | |
| Jan 2018 | 58,748 | 39,553 | |
| Jan 2019 | 81,644 | 46,909 | |
| Jan 2020 | 113,464 | 54,850 |
Table 4 – IPv4 BGP Table Size Prediction
The exponential and polynomial projections in Table 4 provide a reasonable estimate of the high and low bounds of the growth of the IPv6 BGP routing table in the coming years. It should be noted that while the high bound of this growth curve tends to a growth profile that is close to the parameters of Moore’s Law, with a doubling interval of some 26 months, the mitigating factor is that these numbers are not exactly massive numbers, and in five years time we would be expecting a IPv4 BGP table size of 760,000 entries, or some 6 times the size of the higher bound of expectations for the IPv6 routing table in the same period. These numbers are still comfortably within current router hardware technologies.
It appears from these projections that for the next five years, the significantly larger size of the IPv4 network will continue to drive the overall costs of BGP routing, and the IPv6 BGP network will operate, in effect, in the margins of oversupply in meeting the demands of IPv4. It will be some time before there is significant change in the relativities of the two protocols from this particular perspective.
Conclusions
These predictions are highly uncertain. The correlation between network deployments and routing advertisements has been disrupted by the hiatus in supply of IPv4 addresses, causing more recent deployments to make extensive use of various forms of address sharing technologies. In addition, there is still a set of confused signals relating to IPv6 adoption. While a small number of providers have made significant progress in public IPv6 deployments for their respective customer base, the overall majority of the Internet is still exclusively using IPv4. This is despite the fact that among that small set of networks that have deployed IPv6 are some of the largest ISPs in the Internet! The predictions as to the future profile of the routing environment for IPv4 and IPv6 that use extrapolation from historical data can only go so far. In providing a coherent picture for the near term future. Despite this uncertainty, nothing in this routing data indicates any serious cause for alarm in the current trends of growth in the routing system. There is no evidence of the imminent collapse of BGP.
None of the metrics indicate that we are seeing such an explosive level of growth in the routing system that it will fundamentally alter the viability of carrying a full BGP routing table in the near future. In terms of the projections of table size in the IPv4 and IPv6 networks, the BGP sky is firmly well above us, and its not about to fall on our heads any time soon!
In second part of this profile of the routing system in 2014 I’ll look at the profile of the dynamic behaviour of BGP across 2014, to see if there has been any major change in the profile of BGP protocol updates in the past 12 months.