I bet that nobody believed in 1992 that thirty years later we’d still be discussing the state of the transition to IPv6! In 1992 we were discussing what to do about the forthcoming address crunch in IPv4 and having come to terms with the inevitable prospect that the silicon industry was going to outpace the capacity of the IPv4 address pool in a couple of years, we needed to do something quickly. We decided to adopt a new protocol, IP version 6, a couple of years later, and in December 1995 the IETF published RFC 1883, the specification of IPv6.
There were many views as to how long the transition from IPv4 to IPv6 would take, from an optimistic six-month rapid cutover to a hopelessly pessimistic view of a protracted ten-year transition. If there was a prevalent view at the time it was that the transition would take a further five years or so. But don’t forget that this was in the lead up to the Internet Bubble of 2000, and anything that was likely to happen five years out was shelved as a “tomorrow” problem while we toiled away on the “today” issues of adding more carriage capacity to the network, fixing the myriad of issues with routing, and making dial-up modem access work!
While this was a pressing issue in 1992, four years later, in 1996 there was no longer any particular sense of urgency about the transition to IPv6. Why not? There are four major reasons for the shift in attitude.
Firstly, we changed the address plan for the Internet and by 1994 we had introduced so-called classless inter-domain routing (CIDR). Instead of three classes of fixed size network prefixes we could tailor each network to use an address prefix size more in line with the current size and short-term expectations of host count for the network, rather than the coarse selection of 256, 65,536 or 16,777,216 hosts in the old Class ABC plan.
Secondly, we were not running out of IPv4 addresses as such. The immediate problem was running out of Class B address prefixes. By adopting classless routing, we were able to make a dramatic change in the annual rate of address consumption and the IPv4 address exhaustion issue lost most of its immediacy. Exhaustion was still going to happen, but not within the next year or two.
Thirdly, we added more resources to support the function of address allocation with the introduction of the Regional Internet Registry (RIR) system, and with greater oversight of these allocations and a greater emphasis on address conservation and higher efficiency, the rate of address consumption slowed down considerably through the latter half of the 1990s.
Finally, the ISP industry turned to use NATs in its services, where individual IP addresses were shared across multiple simultaneous connections by port multiplexing and timeshared by reusing an address across different connections.
The result of these factors can be seen in a plot of the annual IPv4 address allocations since 1985 (Figure 1). The outlook in 1990 was a rapid growth in address allocations that would consume the entire address space within a few years. By 1995, the effects of CIDR, NATs and the RIR system had not only reversed this consumption growth trend but suppressed it completely. The 1999 address consumption rate of just under 50M addresses per year implied that the IPv4 address pool would last for a further 50 years and any sense of urgency about IPv6 transition largely dissipated.
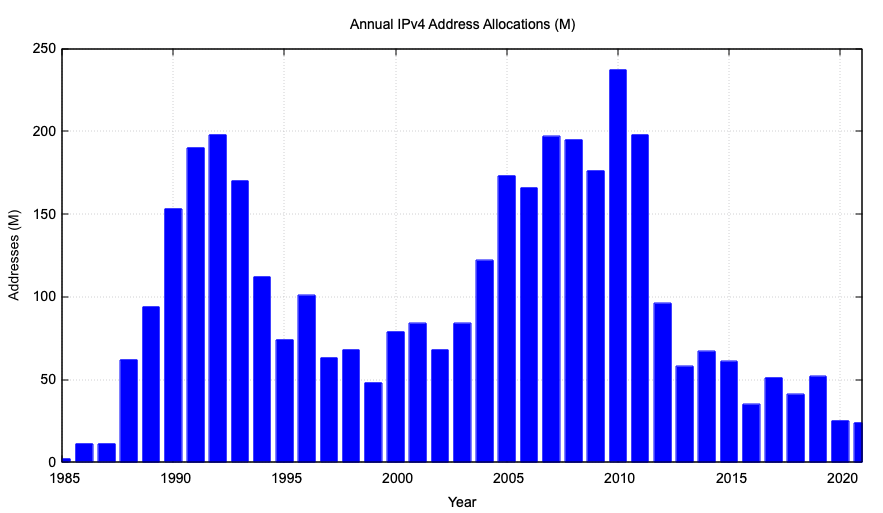
Figure 1 – Annual IPv4 Address Allocations for 1985 – 2021
This was not a stable situation and there were two critical technology developments at that time that once again re-shaped the environment. The first was the adoption of DSL as a last mile access technology. Dial-up Internet was only for the most stalwart and determined of users. The adoption of DSL transformed this into an ‘always on’ technology and this allowed transformation of the Internet into a supposedly seamless consumer product. The second was the introduction of mobile IP services, fuelled by the introduction of the iPhone in 2007. The combination of these technologies created a second wave of expansion of the Internet that once more overwhelmed the existing infrastructure and rewrote all the plans we had at that time. By 2007 the IP address consumption volumes were back to their 1992 peak of 200M addresses per year, and at this time it was clear that, once more, IPv4 had a far more finite lifetime.
In 2007, the expectations of IPv4’s further lifetime had shrunk back from decades to a small number of years. However, this time around the looming IPv4 address crunch did not motivate a new enthusiasm to rapidly complete the transition to IPv6. The change in the consumption pattern occurred so rapidly that by the time it was clear that we no longer had decades to complete this transition, it was also clear that we had just a handful of years, and the Internet had grown large enough at that time that a couple of years was just not enough time to perform a detailed technology transition across the entire Internet, which by 2008 was a far larger Internet than the Internet of 1995.
Predictably, in the face of an impossible alternative, the industry took the other path and performed a run on the remaining pools of IPv4 addresses. The year 2010 represented ‘peak IPv4’ in terms of address allocations, and some 250M IPv4 addresses were allocated throughout the year. In early 2011, the unthinkable inevitably happened. The ‘warehouse’ of IP addresses, the IANA, handed out its last address blocks to the RIRs. This was unthinkable because we were never meant to completely drain the well of addresses. We were meant to behave in a more prudent manner. We were meant to have completed this transition to IPv6 well before we ever got to this point.
But by 2011 our collective response was not a hastened effort to complete the transition to IPv6, because by then this rapid transition was not a realistic option anymore. No matter what we did, we were going to have to operate the Internet while running on depleted stocks of further IPv4 addresses. This situation triggered the adoption of a far more conservative regime of IPv4 address allocation by the RIRs. The measures were intended to support a prolonged zombie life of IPv4 by reducing the allocation volumes such that the intense use of NATs was now necessary. It may have been that the underlying objective was to make IPv6 an attractive alternative to NATs and IPv4. The result was different, and it was ultimately the final nail in the coffin for a general model of peer-to-peer networking for the Internet. The Internet became a monoculture of client/server network, permitting even greater intensity of the use of NATs within the network’s infrastructure.
There are two visible threads in the continued evolution of the Internet today. One is the further consolidation of the client/server model of the Internet with attention being focussed on the server side of the network with the primacy of content distribution networks, and the shrinking of the client side networks, the residual visible part of the Internet, to last mile single hop access networks. The other thread is this transition to IPv6.
The near-term directions in the client/server models are driven by pressures to further consolidate and use a smaller number of very large access networks in each market. Like the mobile network infrastructure landscape, each national market is shrinking down to at most three consumer network infrastructure operators and a collection of retail resellers. This infrastructure consolidation permits the major Content Distribution Networks (CDNs), who themselves are also consolidating, to look at placing their points of delivery inside these access networks and delivering content directly over the internal private address realms of the access networks. From this perspective, IPv6 is the ‘Plan B’ of network evolution. It’s the fallback plan if, or when, the CDNs hit their own scaling issues that would be otherwise intractable.
On the other hand, there is the thread that is the continued IPv6 transition. It’s not been easy. The IETF did go overboard to start, and this was unhelpful! Instead of standardising just one dual stack coexistence mechanism, or even just two, they came up with over thirty. And supporting dual stack coexistence is a real issue for network providers. For as long as there are important services that customers want to access, or enterprise VPNs that rely on IPv4 then it’s impossible for any mainstream access network to run an IPv6-only network that has no IPv4 services whatsoever, nor is it possible for equipment vendors, from mobile devices through to network infrastructure elements to sell product that operates only in an all- IPv6 context. But if you have to support a dual stack environment, then which transition mechanisms do you choose to support. For example, some mobile device platforms supported 464XLAT, while others opted for native dual stack. Some supported IPv6 prefix delegation while others supported DHCP6. With this diversity of device behaviours what must the network do to support dual stack environments? All of them?
Let’s remember that this phase of the transition is not about switching to IPv6, but about adding IPv6 into the network and service environment. The supposed commentary is: “Yes, running two protocols is more complex and more expensive than one, but this is temporary, and once everyone gets to running two protocols, we can all turn off the older protocol and then life will be so much better in so many ways!” The problem is that not everyone feels the same pressures to embark upon this transition at the same time, so waiting for everyone to get a dual stack environment up and running is taking us decades, and there is no end in sight. It’s the laggards who control the overall timetable of this transition, and the costs of the protracted transition appear to be passed across to the early adopters of dual stack services. For as long as this situation persists, then the collective impetus to complete this IPv6 transition process is not overly strong.
So how are we going with this transition to IPv6 in 2021?
Reviewing 2021 through IPv6 Glasses
Before looking at the current statistics for IPv6 deployment I’d like to highlight two events that came to light in 2021 that I think are relevant interesting milestones in the IPv6 transition saga.
The first is the state of the aftermarket for IPv4 addresses in 2021. The Internet has not stopped growing and there is a continual flow of new entrants into the networking space that have a need for IPv4 addresses. The RIR-operated allocation mechanisms for IPv4 allocations have effectively exhausted themselves, so these new entrants are forced to use the aftermarket for IPv4 addresses. In all such markets the key metric is the price of the commodity being traded.
Conventionally, price reflects the effort of balance supply and demand. Excess supply saturates demand, and the price should fall, while insufficient supply causes competition between potential buyers and the price rises to the point where sufficient numbers of buyers are priced out of the market such that those buyers left in the market who are willing to pay the higher price can obtain supply.
However, in many markets there is also substitution. Buyers will tolerate price escalation in a market as long as the market price remains lower than the cost of a substitute good. When the market price exceeds this substitution price then the market will be prone to flipping to a substitute good. Once the market has shifted and buyers have absorbed the transition cost then it is quite feasible that the adoption efficiencies of the substitute good cause the price of the substitute good to fall due to economies of scale. At the same time the fall in demand for the original good would cause a collapse in the price of the original good, but if the market has shifted to rely on the substitute good then the drop in price for the original good may not be enough to cause the market to revert in any case.
So, in this case an escalating price for IPv4 addresses should make IPv6 a more attractive proposition. As the industry places more collective effort to complete this transition, then the demand for IPv4 will collapse once a critical mass of clients and services are dual-stack capable, as this makes an IPv6-only a viable service offering. At such a point, even though the price of IPv4 addresses may have collapsed, there is little remaining appetite to flip back to IPv4 because of the costs of such a move back would far outweigh any short-term opportunity price signal about IPv4 addresses.
In other words, any price escalation has a ceiling, at which point the IPv4 address market will collapse completely, and such a market collapse will impact not only new entrants but existing address holders. It’s not just market entrants and those wanting to acquire more IPv4 addresses who should pay careful attention to the price signals in the IPv4 address transfer market, but all IPv4 address holders and service providers who may be impacted by this rapid escalation in market prices if it leads to a subsequent collapse. At some point it’s possible for the market to enter a bubble phase, where the only players left in the market are speculators making short term bets on how high the price can be driven before the inevitable collapse.
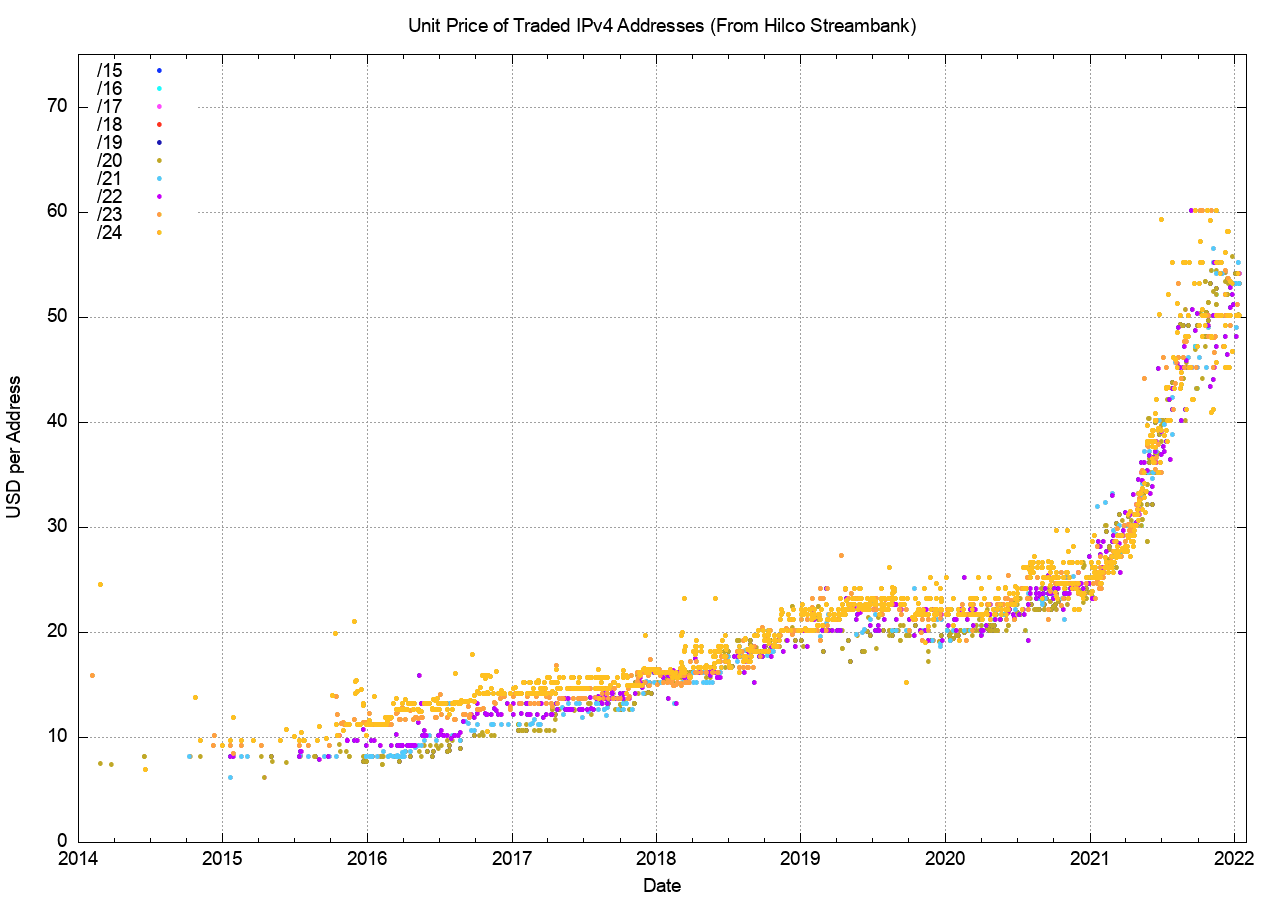
Figure 2 – IPv4 Market Price (data from Hilco Streambank)
Figure 2 shows the timeline of the market price of IPv4 addresses, coloured according to the prefix size of the traded block. The market price doubled across the period 2016 – 2019, from USD 10 per address to USD 20. In 2019 and in the first half of 2020 the price was steady at around USD 22 per address. However, in 2021 it all changed again, and the price rose from USD 22 to up to USD 60 in just 12 months. The market also lost cohesion over the year, and in the latter half of 2021 there were transactions that completed with unit prices between USD 40 per address to USD 60. Perhaps the pandemic caused some interruptions in the flow of market information within the industry, and the result was price uncertainty and a far higher variation in the unit price paid in individual transactions.
What’s behind this price rise? Panic? Or Scarcity? We can compare the data in Figure 2 against the total volume of address transfers that are registered in the RIR system (Figure 3). The total volume of traded addresses, based on the RIRs’ transfer logs, dropped by some 40% in 2021 as compared to 2020 levels. Presumably the combination of declining volume and escalating price points to a scarcity issue with supply of IPv4 addresses for trading.
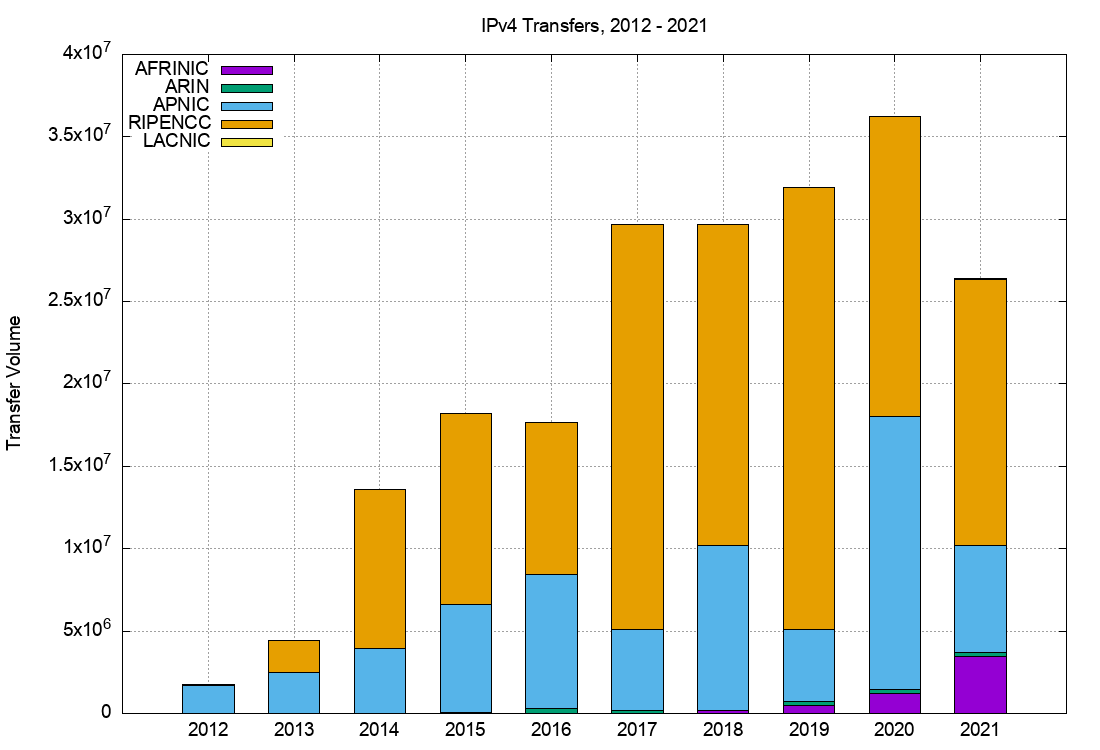
Figure 3 – IPv4 Transfer Volume (From RIR-operated transfer logs)
If a relatively steady IPv4 trading price indicates some common level of confidence that the IPv4 market will continue to meet the aggregate demands from the sector for some years to come, then a sharply escalating price indicates an abrupt drop in that level of confidence. And if there is no confidence in the continued supply of IPv4 addresses then that leaves IPv6 as the only Layer 3 response left.
It is also intriguing to observe that most of the transfers occurred in the Europe and the Middle East region that is served by the RIPE NCC, while the transfer volumes registered in the North American region served by ARIN remains at an extremely low level.
The second event I want to touch upon briefly is the case of Slack’s September 2021 outage. Slack is a cloud-based online collaboration application, directed at the enterprise market. The exact details behind the incident are not that relevant here, but the point I want to highlight is that within the unfortunate combination of conditions that caused this outage, one of the contributary factors is that Slack is only supported on IPv4. Now this is not due to Slack per se. Slack uses Amazon’s AWS platform, and the story about IPv6 support within Amazon’s AWS platform is an ongoing ‘under construction’ story. Why hasn’t one of the major cloud platforms that supports enterprise applications been running IPv6 for the past decade or more? The answer is that they never felt under sufficient pressure from their customers to do so. The distributed enterprise world is still a landscape that appears to be largely shaped by IPv4, with scant use of IPv6.
What we appear to be seeing is a two-speed Internet, where one speed is determined by the large mass-market retail services that are slowly but surely heading down a path of dual stack adoption, driven largely by the escalating price of IPv4 addresses and the inabilities to push the NAT model even harder. This will remain the case while the major CDNs continue to live just outside the large retail access network’s infrastructure. That gap between the access network edge and the CDN point of presence needs to be filled with public addresses, and this is the point of pressure for continued use of IPv4 addresses. The other speed appears to be determined by the enterprise sector. They too have been transitioning, but in that case it’s a transition away from dedicated IT services and fully owned and operated service platforms into cloud-based infrastructure. It’s a long process hampered by capital, available expertise, and risk aversion. It appears that for many the approach to this transition is to limit the extent of the changes at any one time, and here it’s a case of keeping IPv4 as the mainstay of their environment as they move into a cloud-based environment. This manifests itself in many different ways, and a good example is Slack’s use of an IPv4-only Amazon cloud platform, which makes sense for Slack only if you consider the preferences of their enterprise customers.
It appears that the underlying factors in 2021 were an unexpected and steep escalating of the market price for transferred IPv4 addresses, and a continuing reluctance of the enterprise sector to make any visible moves to embrace a dual stack environment in their IT platforms. Let’s now look though some IPv6 adoption data to tell us more about what happened in 2021.
IPv6 Address Allocations
Figure 4 shows the number of IPv6 allocation per year from the RIRs. The allocation numbers are down from the high point in 2019 and these numbers have been constant at 5,400 allocations per year over 2020 and 2021. The level of allocations by the RIPE NCC has increased considerably, while the activity in LACNIC has declined by much the same amount when we look at 2020 and 2021. These numbers probably correlate with the various waves of larger lockdowns caused by the successive waves of the COVID-19 pandemic, which no doubt impacted the timing of infrastructure deployment plans for regional service providers as they occurred.
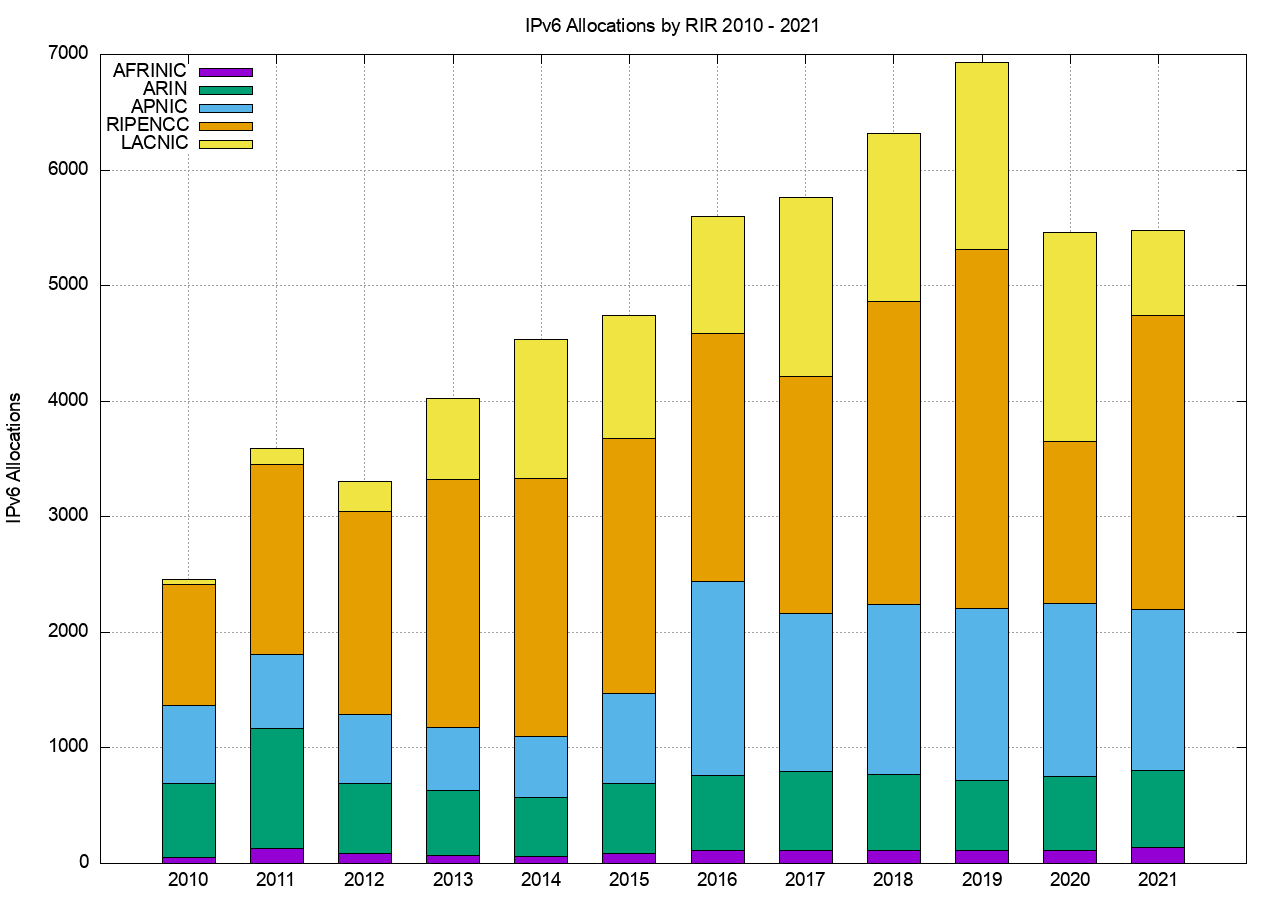
Figure 4 – IPv6 Allocations per year
The volume of IPv6 addresses tells a slightly different story and the amount of IPv6 addresses allocated or assigned by ARIN has declined considerably in 2021 over 2020 levels, while the year-on-year volume has doubled for RIPE NCC IPv6 allocations in 2021. A total of the equivalent of some 29,000 IPv6 /32’s were passed out by the RIRs in 2021, an increase of 30% over 2020.
In the case of the RIPE NCC the majority of IPv6 allocations are /29 prefixes, and in 2019 they performed 2,499 such allocations, in 2020 just 933 and in 2021 the number was back to 2,499 allocations. APNIC’s total allocation volumes are dominated by very large allocations and in each of the three years 2019 – 2021 APNIC allocated at least on /20 block (two in 2021) and either a /21 or a /22 as well. In ARIN’s case /20 blocks were allocated in 2019 and 2020. The total count IPv6 allocated addresses has two components, namely a large volume of ‘commonly allocated’ address blocks (/29’s in the case of the RIPE NCC and /32’s in the case of the other RIRs) and a far smaller volume of very large address blocks (/21’s or larger).
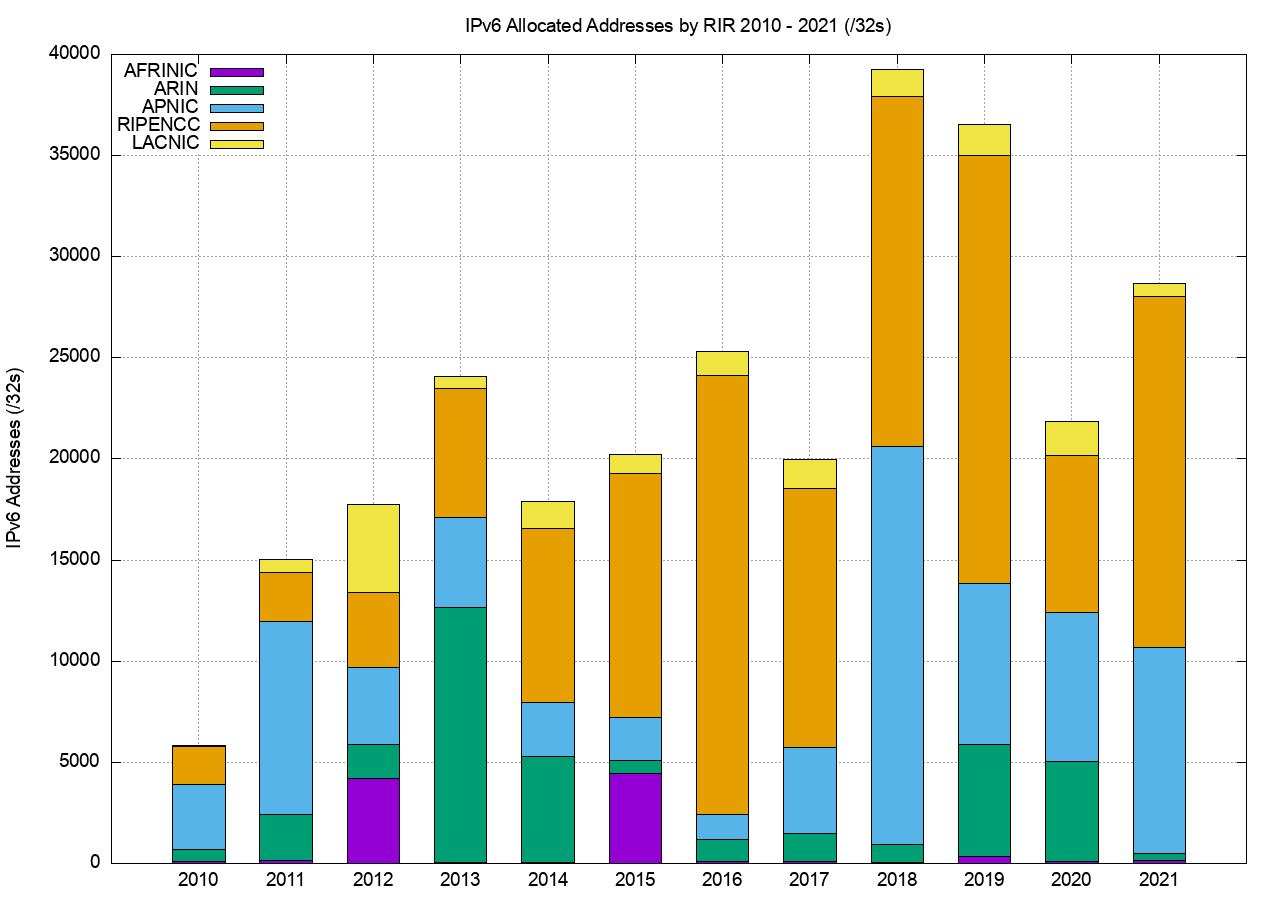
Figure 5 – IPv6 Allocated Addresses per year
Routing IPv6
If we follow these addresses from allocation to routing, then the next view of the past year in IPv6 is the growth in size of the IPv6 routing table.
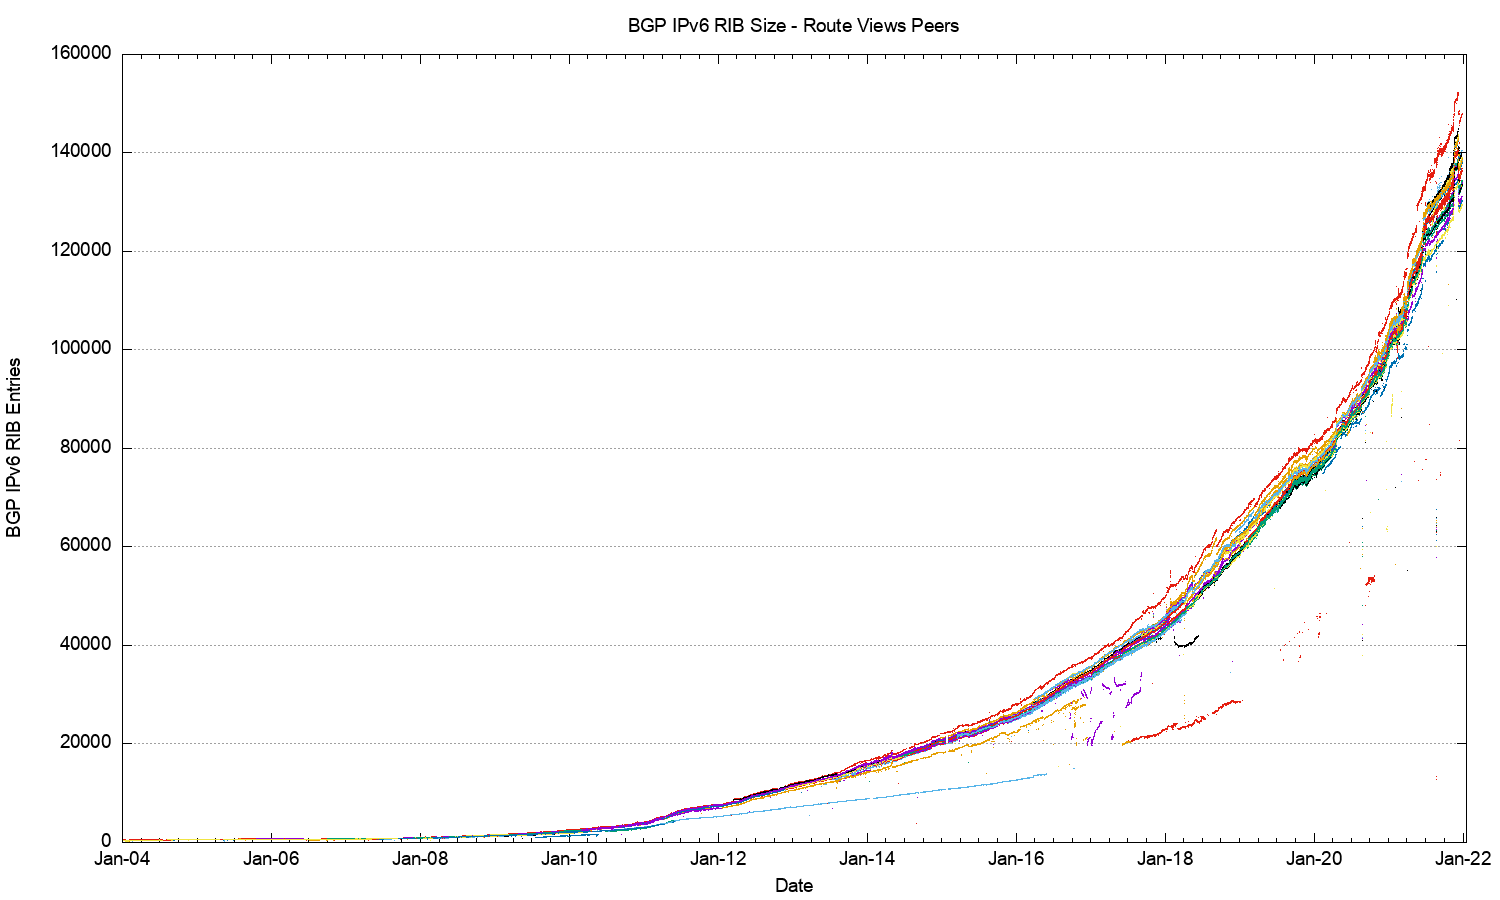
Figure 6 – IPv6 BGP Routing Table Size – 2004 – 2022
The long-term trend in the growth of the IPv6 network (Figure 6) is clearly one that is increasing over time. A reasonable fit to this data is an exponential growth model with a doubling factor of 24 months. A more detailed view of just 2021 is shown in Figure 7.
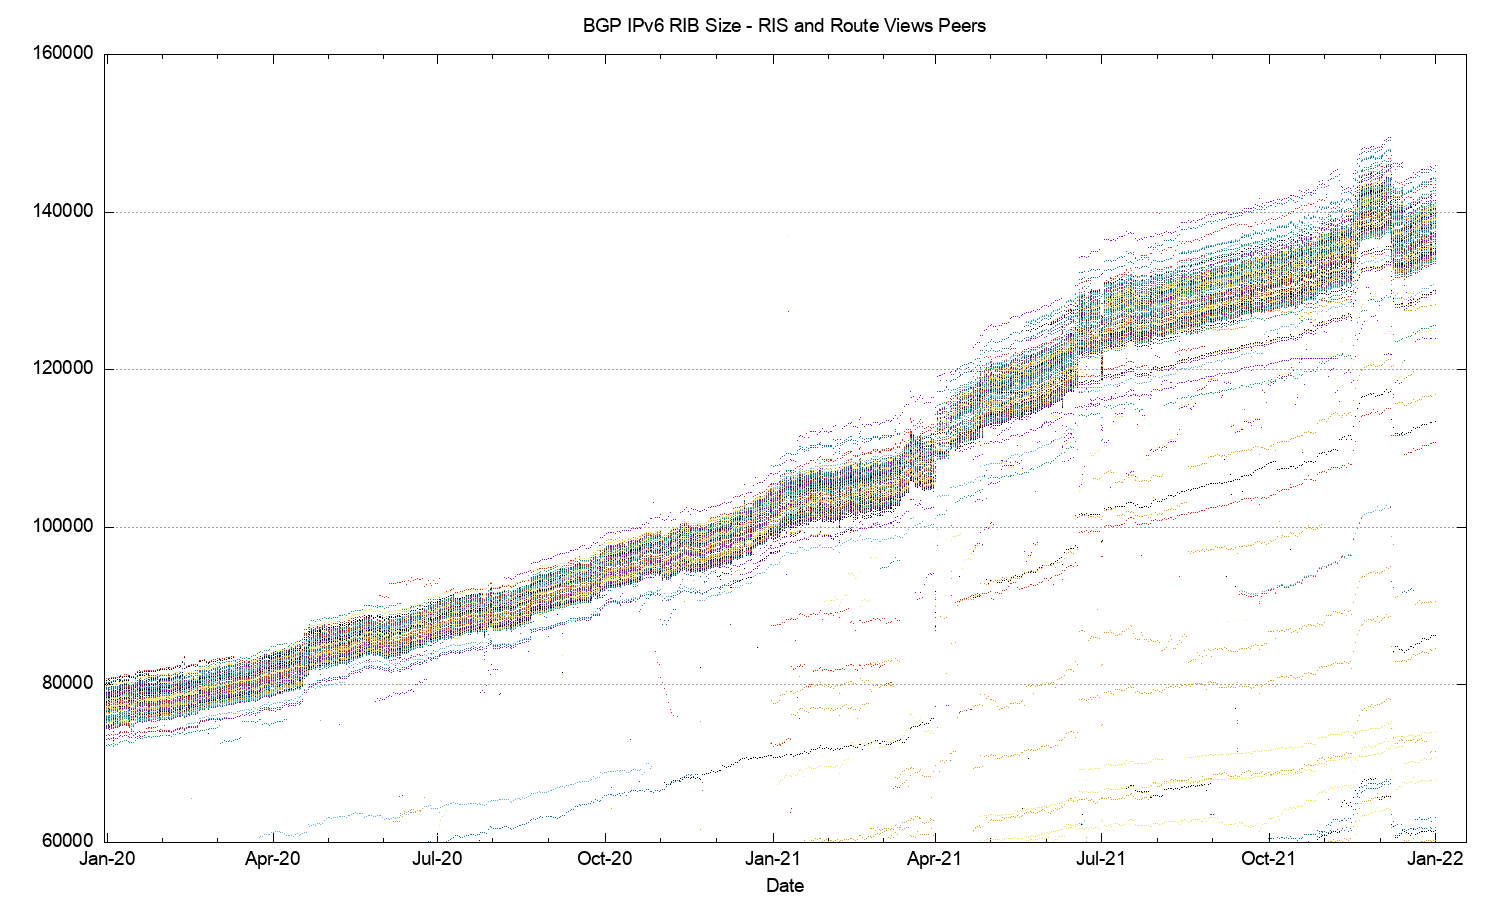
Figure 7 – IPv6 BGP Routing Table Size – 2021
There have been some anomalies in the IPv6 routing table in 2021, with distinct jumps in the number of visible prefixes in April, May, November, and December.
Some 4,000 IPv6 announcements were added at the start of April 2021, and a further 5,000 announcements in mid-May. In both cases these were predominately more-specific announcements, and in both cases /48 and /32 announcements dominated. A similar situation occurred in November and December, where a collection of some 7,000 more specifics were announced in mid-November and then withdrawn in mid-December.
Routing advertisements of /48s are the most prevalent prefix size in the IPv6 routing table at the end of 2021, and some 47% of all prefixes are /48’s. The next most common prefix size is /32, and these account for some 14% of all prefixes. Some 60% of the routing table are now more specific announcements of covering aggregate announcements.
Why is the IPv6 routing table being fragmented so extensively? The conventional response is that this is due to the use of more specific route entries to perform traffic engineering. However, this rationale probably does not apply in all cases. Another possible reason is the use of more specifics to counter efforts of route hijacking. This also has issues, given that it appears that most networks appear to accept a /64 prefix, and the most common disaggregated prefix is typically a /48, so as a countermeasure for more specific route hijacks a /48 may not be all that effective in any case.
This brings up the related topic of the minimum accepted route object size. The common convention in IPv4 is that a /24 prefix advertisement is the smallest address block will propagate across the entire IPv4 default-free zone. If a /24 is the minimum accepted route prefix size in IPv4, what is the comparable size in IPv6? There is no common consensus position here, and the default is to use no minimum size filter. In theory that would imply that a /128 would be accepted across the entire IPv6 default-free zone, but a more pragmatic observation is that a /32 would be assuredly accepted by all networks, and it appears that most network operators believe that a /48 is also generally accepted. However, we also see prefixes smaller in size than a /48 in the routing table with /49, /52, /56 and /64 prefixes also present in the IPv6 eBGP routing table. Slightly more than 1% of all advertised prefixes are more specific than a /48, although it is unclear as to the extent of propagation of these smaller prefixes across the IPv6 BGP network.
Notably, some 4,000 ASes were added to the IPv6 network on the 20th of May. This appears to be a research platform being constructed by China’s Education and Research Network, which has organised its route advertisements to advertise a single /32 IPv6 prefix per AS, using the block of AS numbers AS142650 – AS146745 for this purpose. Presumably this is to support some form of network slicing research experiment, although it is unclear to me why these /32 advertisements are separately advertised into the global IPv6 routing table.
In better news, the stability and performance of the IPv6 routing system appears to be improving. This may be an unintended side effect of the pandemic, or more likely this may be a sign that we are paying more attention to IPv6 routing than previously. The daily average of the time for the IPv6 routing system to converge to a stable state after a prefix update is shown in Figure 8. It has been steadily improving over 2021 from 120 seconds to 20 seconds.
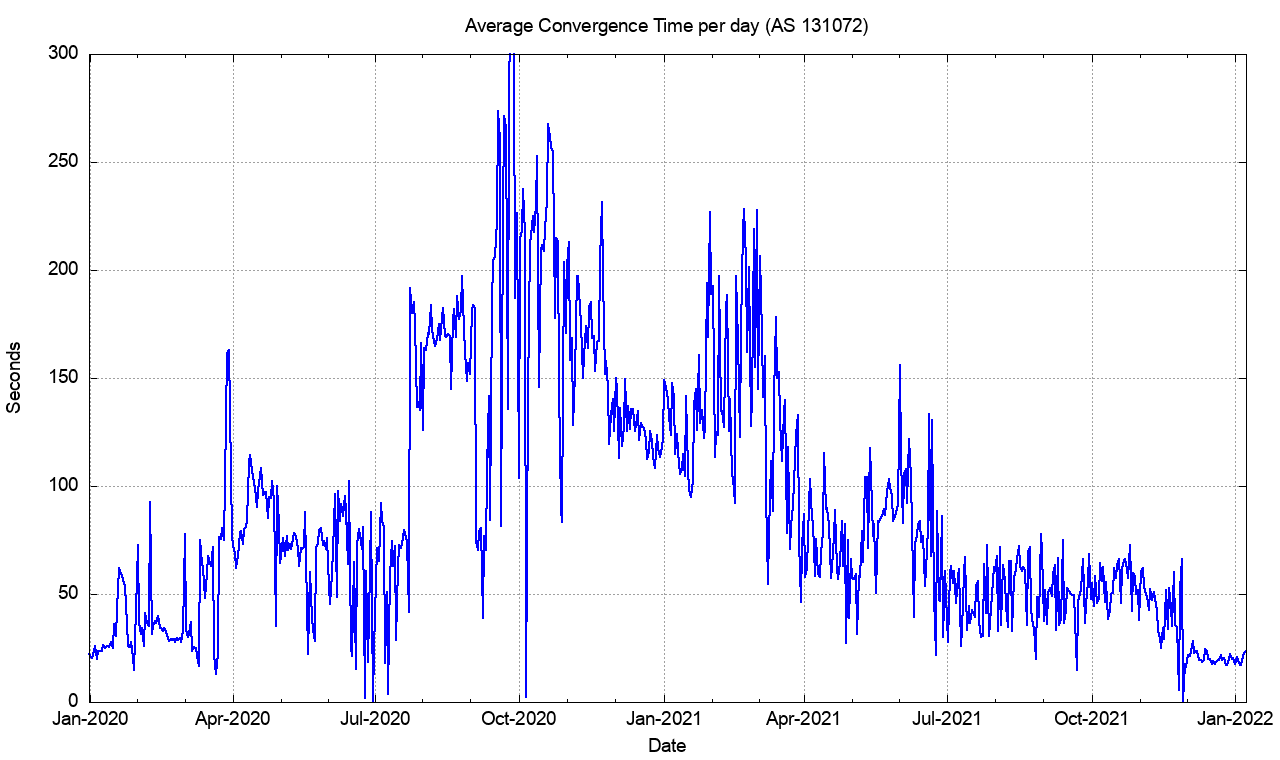
Figure 8 – Daily average IPv6 route convergence time 2020-2021
It is unlikely that this is a general improvement. The general characteristics of route updates are bimodal, where a small number of highly unstable prefixes are extremely unstable, while more prefixes are updated rarely and converge quickly. It is likely that what we are seeing across 2021 is the effort to remove the sources of pathological update behaviour in the small number of highly unstable prefixes, exposing the baseline behaviour of the more stable set of IPv6 routes.
This highly stable state observed at the end of 2021 is unlikely to continue, unfortunately. Concentrated points of instability in the IPv6 network continue to be a feature of the IPv6 network, where 1 or 2 networks are associated with half of the total updates observed in the IPv6 network.
Using IPv6
Next, we’ll look at the ratio of users who demonstrate a capability to retrieve a web object over IPv6 as an indicator of the level of IPv6 adoption in the consumer Internet.
Figure 9 shows the time series of this measurement from the start of 2012 until early 2022. At present some 31% of the Internet’s user base is IPv6-capable, a rise of 4% over the previous 12 months.
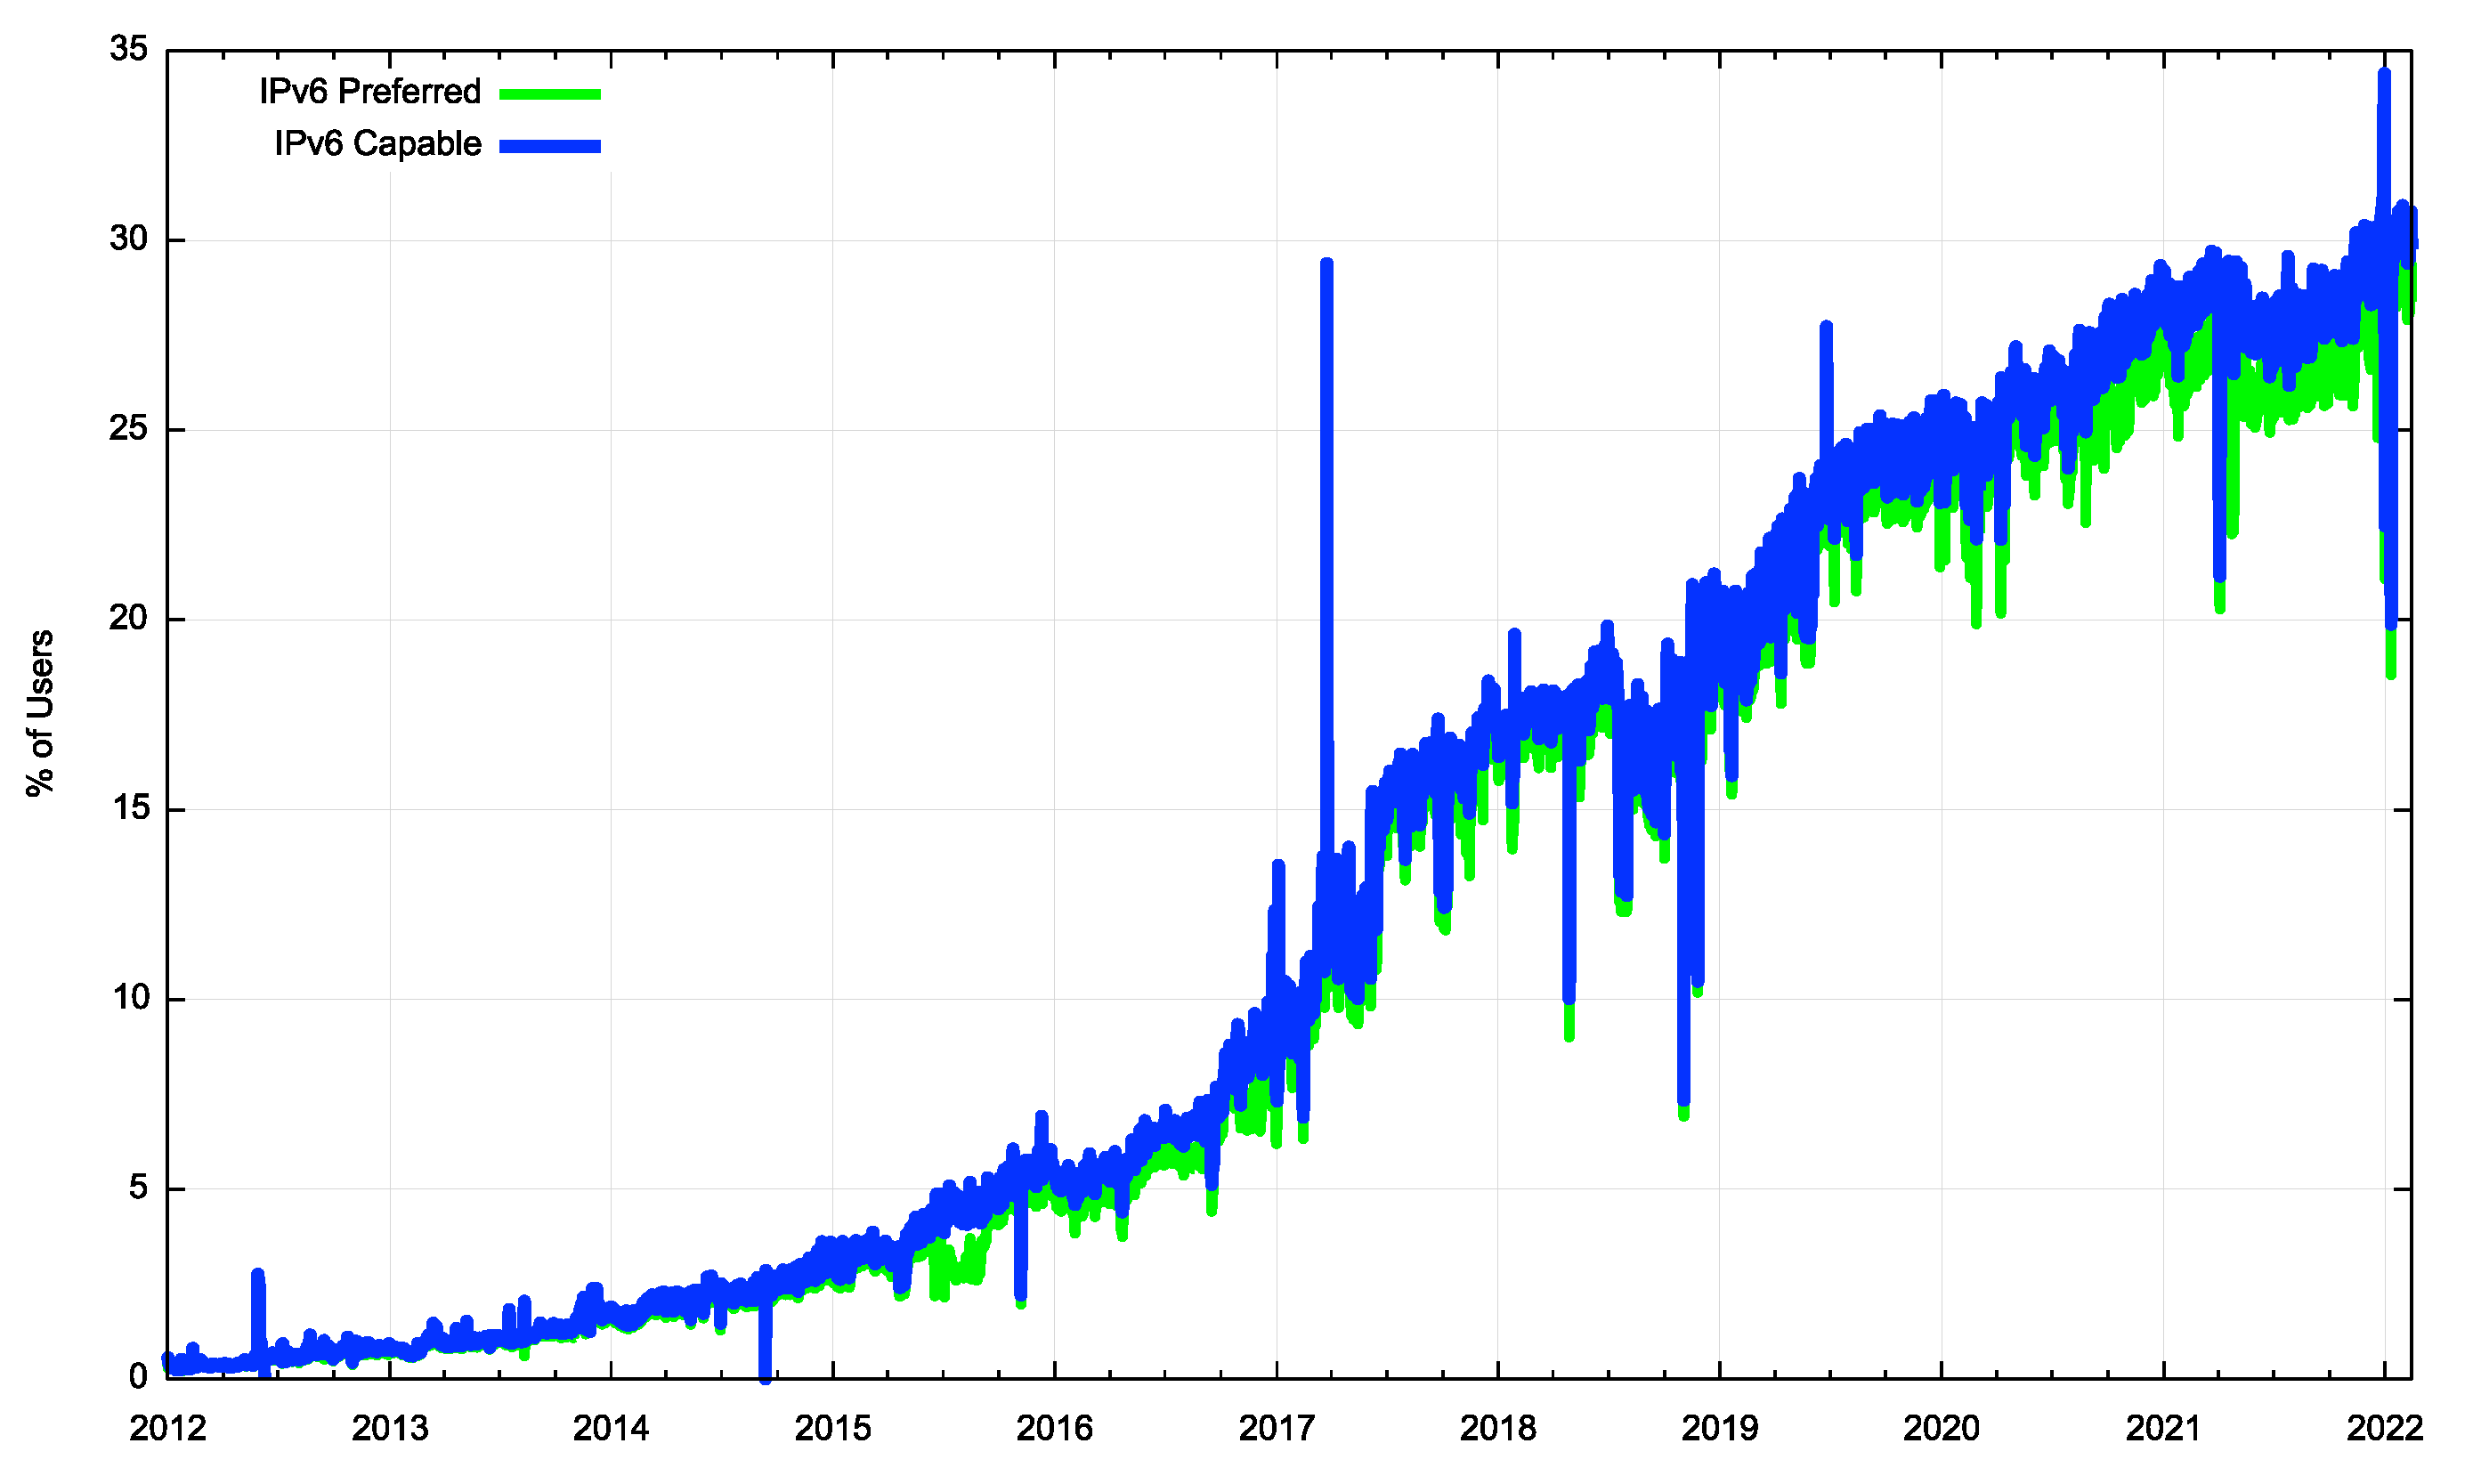
Figure 9 – Use of IPv6 – 2012 – 2022
Obviously this 30% count is not uniformly distributed across the Internet, and a map of where these IPv6 users are located is shown in Figure 10.
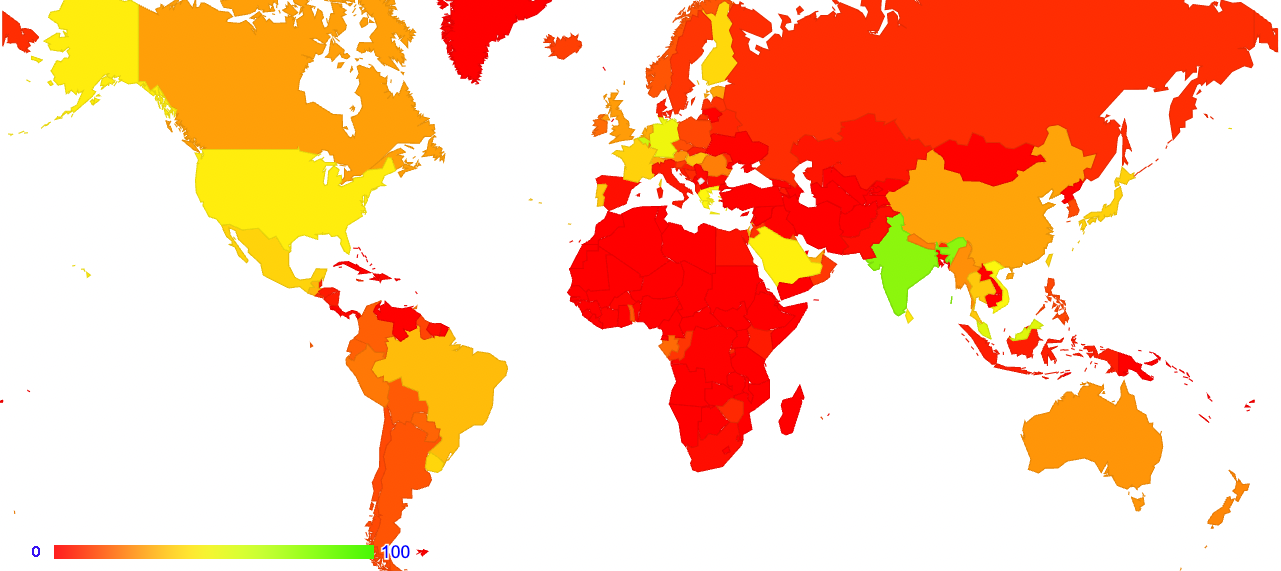
Figure 10 – Distribution of IPv6 deployment, January 2022
Clearly the adoption of IPv6 is highly varied, and while there is a high adoption rate in India (76% of users) there are only five other economies where the IPv6 adoption rate is over 50% of users (Belgium, Malaysia, Germany, Viet Nam and Greece).
Where was IPv6 deployed in 2021? If we look at IPv6 deployment as a percentage of each national population and compare the measurement at the start of 2021 to that of the end of the year we can provide a list of economies that have the highest change in that ratio of IPv6 users. This is shown in Table 1.
| Rank | V6 Ratio | Users (Est.) | Name | ||
| 2021 | 2022 | Change | |||
| 1 | 10% | 37% | 28% | 9,004,547 | Guatemala |
| 2 | 17% | 38% | 21% | 7,341,817 | Israel |
| 3 | 30% | 49% | 19% | 32,204,986 | Saudi Arabia |
| 4 | 1% | 15% | 14% | 16,308,208 | Chile |
| 5 | 20% | 33% | 13% | 820,328,035 | China |
| 6 | 13% | 26% | 13% | 7,081,783 | Nepal |
| 7 | 18% | 29% | 11% | 8,278,192 | Austria |
| 8 | 19% | 29% | 10% | 20,900,003 | Myanmar |
| 9 | 0% | 10% | 10% | 2,263,165 | El Salvador |
| 10 | 0% | 9% | 9% | 1,617,110 | Jamaica |
Table 1 – Top 10 Economies with the highest relative growth of IPv6 Users over 2021
The other way to generate this ranking is to use the estimated population of those users who are using IPv6 and the change in this count across 2021. This is shown in Table 2. While China ranked at position 5 in the relative ranking with a 13% annual change, with an estimated 820M users in China this 13% change represents a change of 109M users. Similarly, India’s change in 2021 was some 3% of its user base, which places it at 37th position in this ranking in relative terms, but this represents an additional 19M users, which is the second highest count for 2021.
| Rank | V6 Users | Users (Est.) | Name | ||
| 2021 | 2022 | Change | |||
| 1 | 164,459,081 | 274,019,342 | 109,560,261 | 820,328,035 | China |
| 2 | 420,258,878 | 439,312,401 | 19,053,523 | 574,511,661 | India |
| 3 | 9,616,919 | 15,677,224 | 6,060,305 | 32,204,986 | Saudi Arabia |
| 4 | 783,660 | 6,587,084 | 5,803,424 | 113,054,932 | Indonesia |
| 5 | 34,839,061 | 38,584,943 | 3,745,882 | 89,811,643 | Mexico |
| 6 | 58,410,683 | 61,762,731 | 3,352,048 | 161,217,993 | Brazil |
| 7 | 23,995,676 | 26,879,572 | 2,883,896 | 53,010,341 | Vietnam |
| 8 | 4,140,135 | 6,647,417 | 2,507,282 | 34,549,112 | Colombia |
| 9 | 872,279 | 3,359,080 | 2,486,801 | 9,004,547 | Guatemala |
Table 2 – Top 10 Economies with the highest absolute growth of IPv6 Users over 2021
While the total data in Figure 9 shows a relatively modest growth for 2021 of around 4%, this corresponds to a further 171M users who are using IPv6, which is a considerable achievement.
There are two further areas of IPv6 deployment that should be mentioned, but they are far harder to measure.
The first area is the enterprise sector. This sector has been relatively conservative in its approach to new technologies and has relied extensively on private network platforms. This has meant that it has largely been isolated from the brunt of the issues with IPv4 address exhaustion and has been able to continue with an IPv4 agenda for the past decade. This sector has been moving to cloud services, but for many years these enterprise cloud services were able to operate on IPv4. It has only been in the past couple of years that we’ve seen announcements from Microsoft’s Azure or Amazon’s AWS that their platforms are introducing support for IPv6, and this appears to some growing awareness in the enterprise sector that they need to embark on their own dual stack transition at this time.
The second area is the very reason why we opted to use a very large address field in IPv6, namely the Internet of Things (IoT). Estimates vary as to how many devices are out there in this network, probably because it’s a space that defies most conventional forms of simple counting, but we use numbers between 20 billion and 50 billion when we talk to each other about the count of such devices. This was thought to be the so-called killer app for IPv6, yet it does not appear to have happened as yet. Many of these devices hide behind intermittent connectivity, and so far IPv4 and NATs appear to be capable to service such requirements with some ease. However, perhaps this is like the enterprise market, and is more of a case of slow start. There are many issues with the IoT, not the least of which is the dubious resilience of these devices and their evident inability to resist being co-opted into zombie attack armies of truly massive proportions. While we are constantly reminded that NATs are not a robust security defence, NATs are often used as such. The prospect of having all these unmanaged, ignored and potentially highly vulnerable IoT platforms being placed online in an always-on IPv6 scenario is truly scary! We really should figure out a much more robust approach to the IoT world before we flick on the IPv6 switch and expose all these built-to-the lowest-possible-budget devices to the toxic underworld of direct Internet connectivity! In the meantime, perhaps it’s a good thing that most of these devices hide behind NATs!
2021 in Review
At first glance, it may have looked that 2021 was another year of locking down in the face of the continued COVID-19 pandemic, but there was still much that was going on in IPv6 deployment and the dual stack transitional Internet.
There is further scarcity pressure on IPv4 addresses, reflected in price escalation in the transfer markets. The IPv6 routing system is getting more operator attention, and the IPv6 network is proving in stability and performance. The consumer sector is continuing its expansion of IPv6 both in the major markets of China and India, as well as in numerically smaller markets such as El Salvador and Nepal. And we are seeing signs of movement in the enterprise sector.
Does all this mean that there is some end in sight for the protracted IPv6 transition? Are we finally getting somewhere with IPv6? Will the remaining two-thirds of the Internet be easier and faster to push through this transitional phase given our experience with the first third of the Internet? Maybe, at the start of 2022, there are some grounds to be a little more optimistic than we were a year ago in attempting to answer this question.
Personally, however, I’m not convinced that this is the case, and I’m not optimistic about a hastened end to this transition process.
Much of the Internet’s evolution over the past decade has been in making the entire issue of static IP addresses irrelevant to the overall architecture of the Internet. We don’t necessarily want to head back to a 1980s network architecture where the overloaded identity and location semantics of IP addresses presented some real limitations to the flexibility of the network. We are heading down a path that strips most of the semantic loading from IP addresses and places those functions into the Internet’s name system.
It may well be the case that if we ever get close to the end of this transition, we might look around at that time and realise that it just doesn’t matter anymore! By that time, we might be ready to consign the entire framework of a coherent address infrastructure into a completed but abandoned chapter in the history of the evolution of networking technology.
But perhaps I am being overly premature in anticipating the end of this transition Right now we seem to have grown used to a world that is in perpetual transition and it seems to be far harder now, at the start of 2022, to predict when this transition process will be resolved one way or the other than when we chose to head down this path in 1995!