In 2010 the Asia Pacific Regional Address Policy community adopted a policy that permitted address holders in the region to transfer address registration records, enabling an aftermarket in IPv4 addresses to operate with the support of the APNIC registry function. While APNIC was still able to allocate addresses to meet demands there was very little in the way of activity in this market, but once APNIC was down to its last /8 of addresses in April 2011 the level of transfer activity has picked up. In this article I’d like to take a more detailed look at APNIC’s transfer log and see what it can tell us about the level of activity in the address market in the Asia Pacific region.
Transfers of IPv4 addresses between entities are logged by APNIC in a transfer registry. This registry is updated daily, and can be found at ftp://ftp.apnic.net/public/transfers/apnic/, together with an archive of the state of the registry since its inception in 2010. At the end of July 2015 this registry contained 1,086 entries. Some 914 of these entries were related to the movement of address blocks between entities located in the Asia Pacific region, and 172 entries referred to IP address movement from another region into the Asia Pacific area. All of these 172 inter-RIR transfers refer to transfers of IPv4 addresses from the ARIN registry to the APNIC registry. These transfers list a total of 14,210,816 addresses, of which 9,674,496 transferred addresses were within the Asia Pacific region and 4,536,320 addresses have been transferred from ARIN to APNIC.
The average number of transfers per month has been steadily rising over the period since the commencement of transfers in late 2010. As shown in Figure 1, the number of transfers has risen from 2 – 3 transfers per month to the 2015 average rate of 44 transfers per month. The volume of addresses being transferred has also risen from some 2,500 addresses per month to some an average of 700,000 addresses per month. In 2015 The average size of entries in the transfer log for 2015 is a /18, or 16,336 addresses, while the overall average for the entire period is slightly lower at 13,085 addresses per transfer.
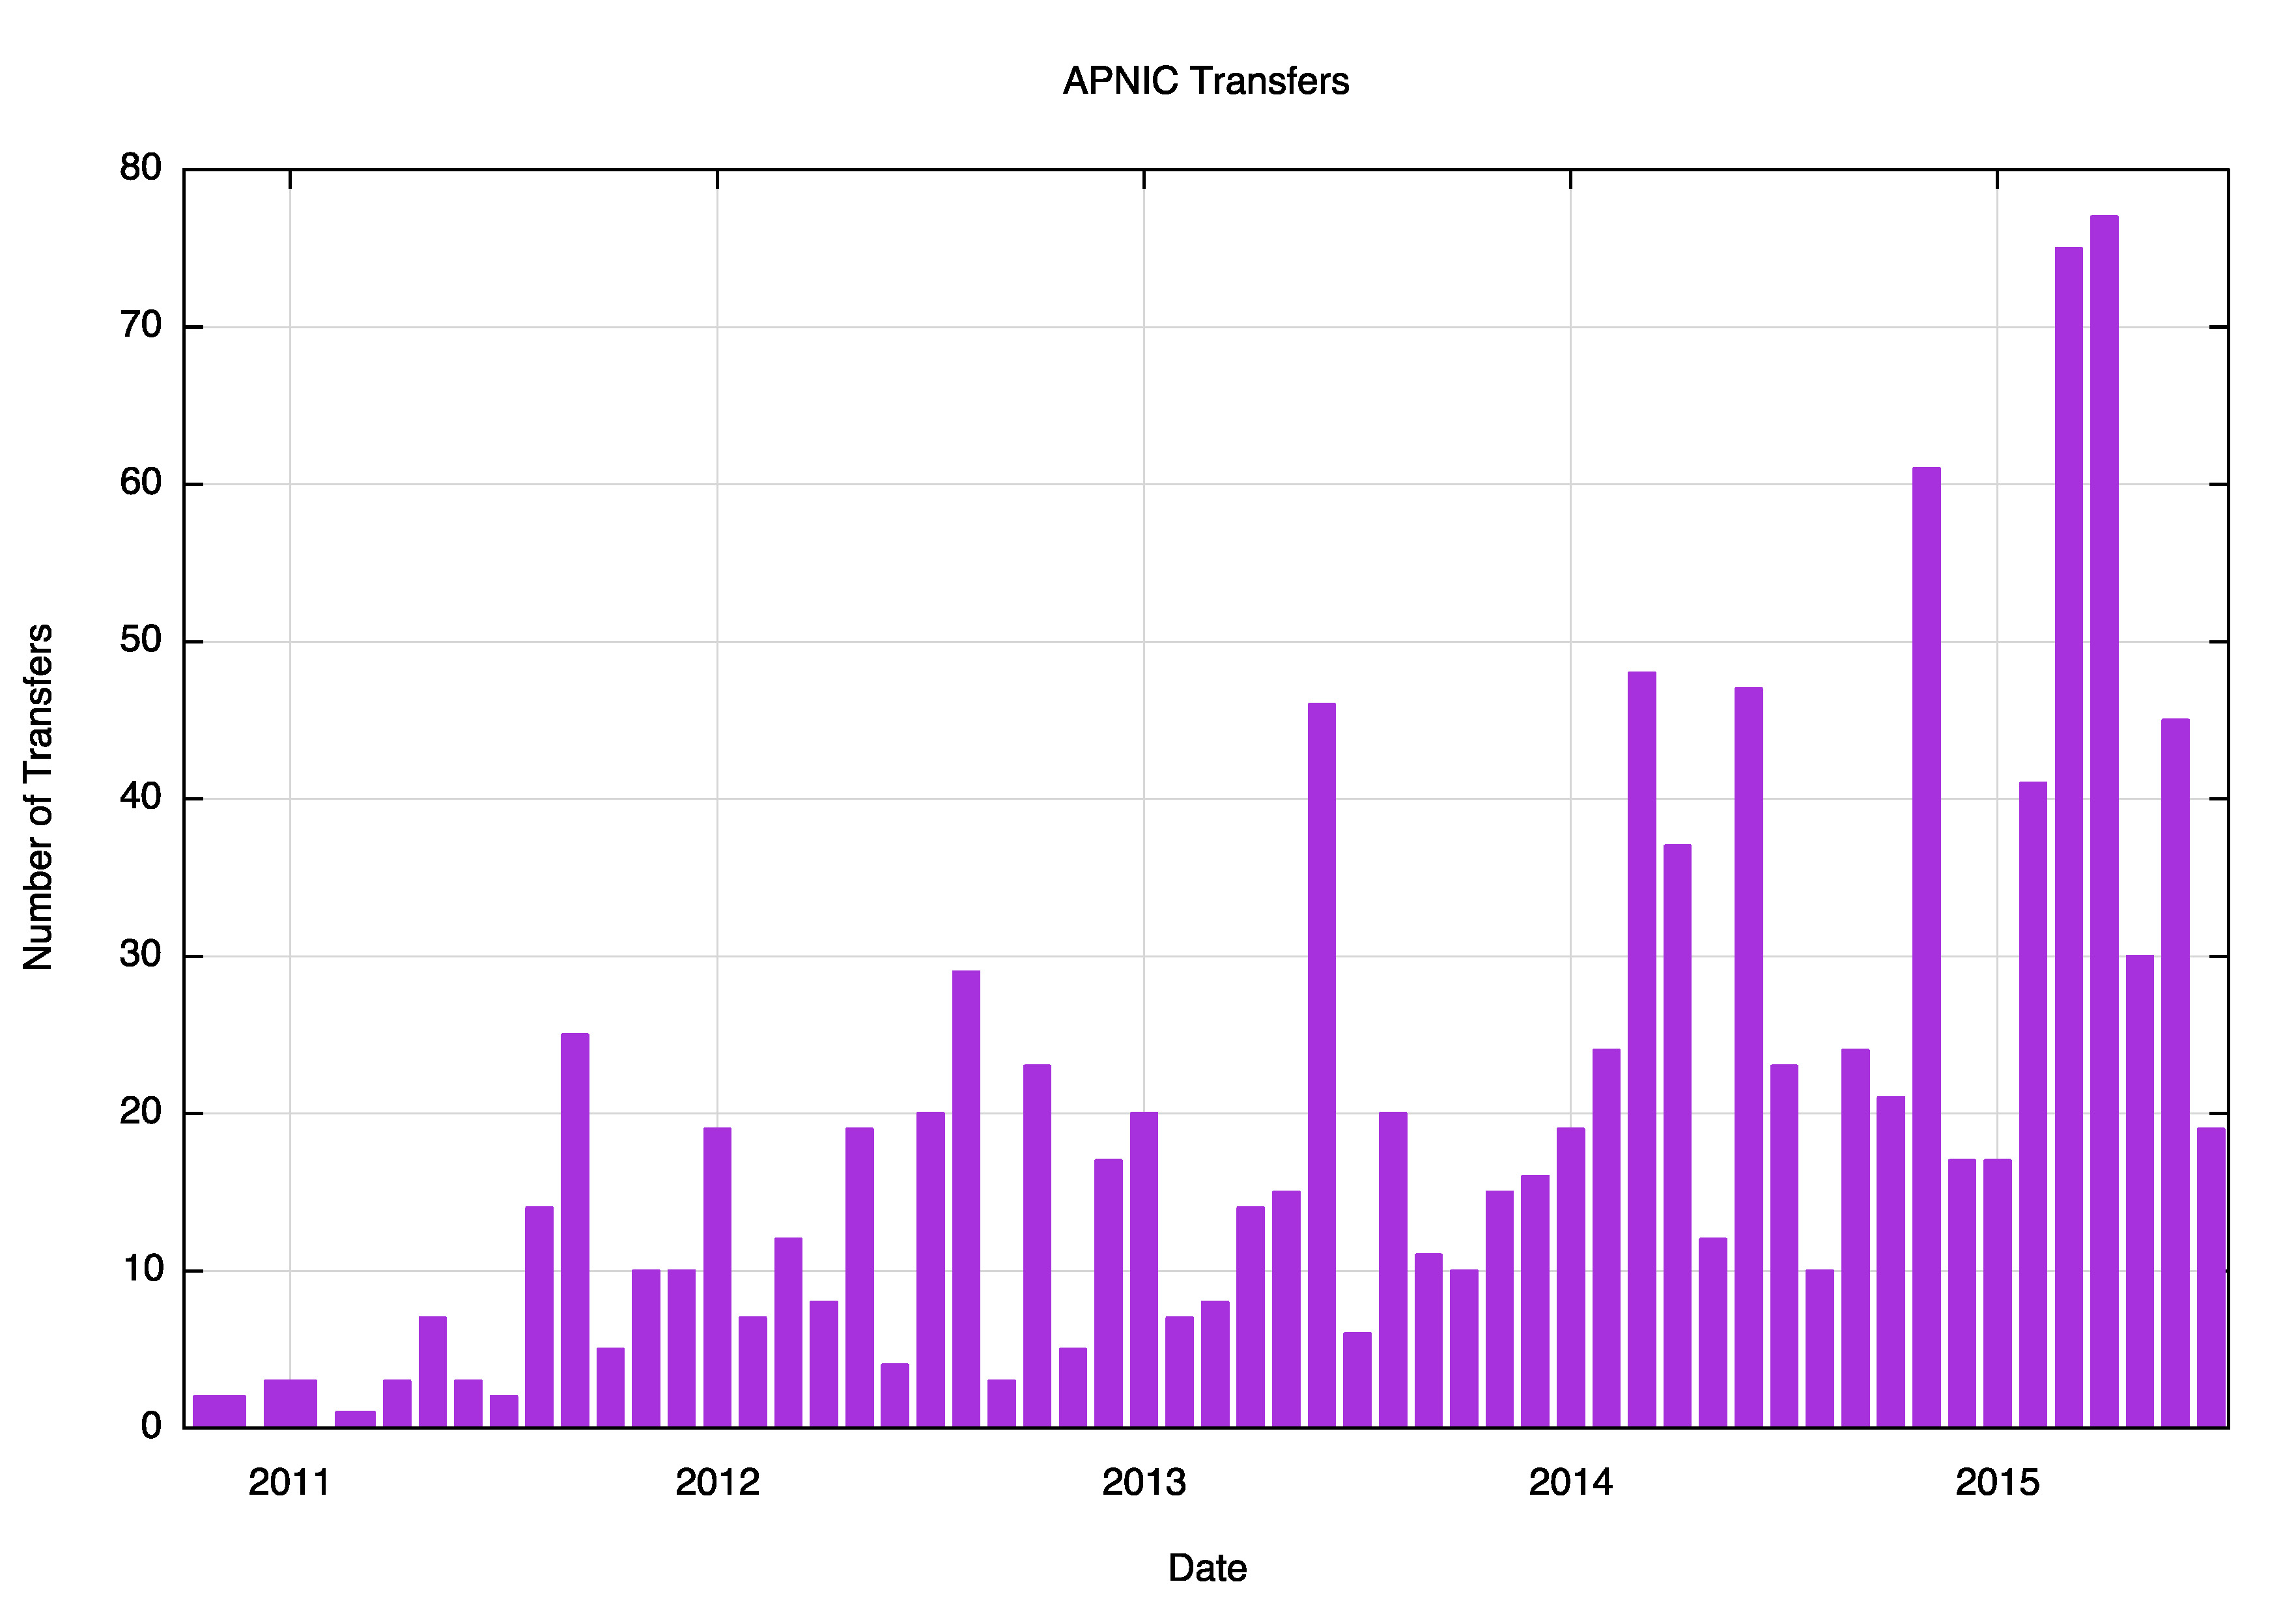
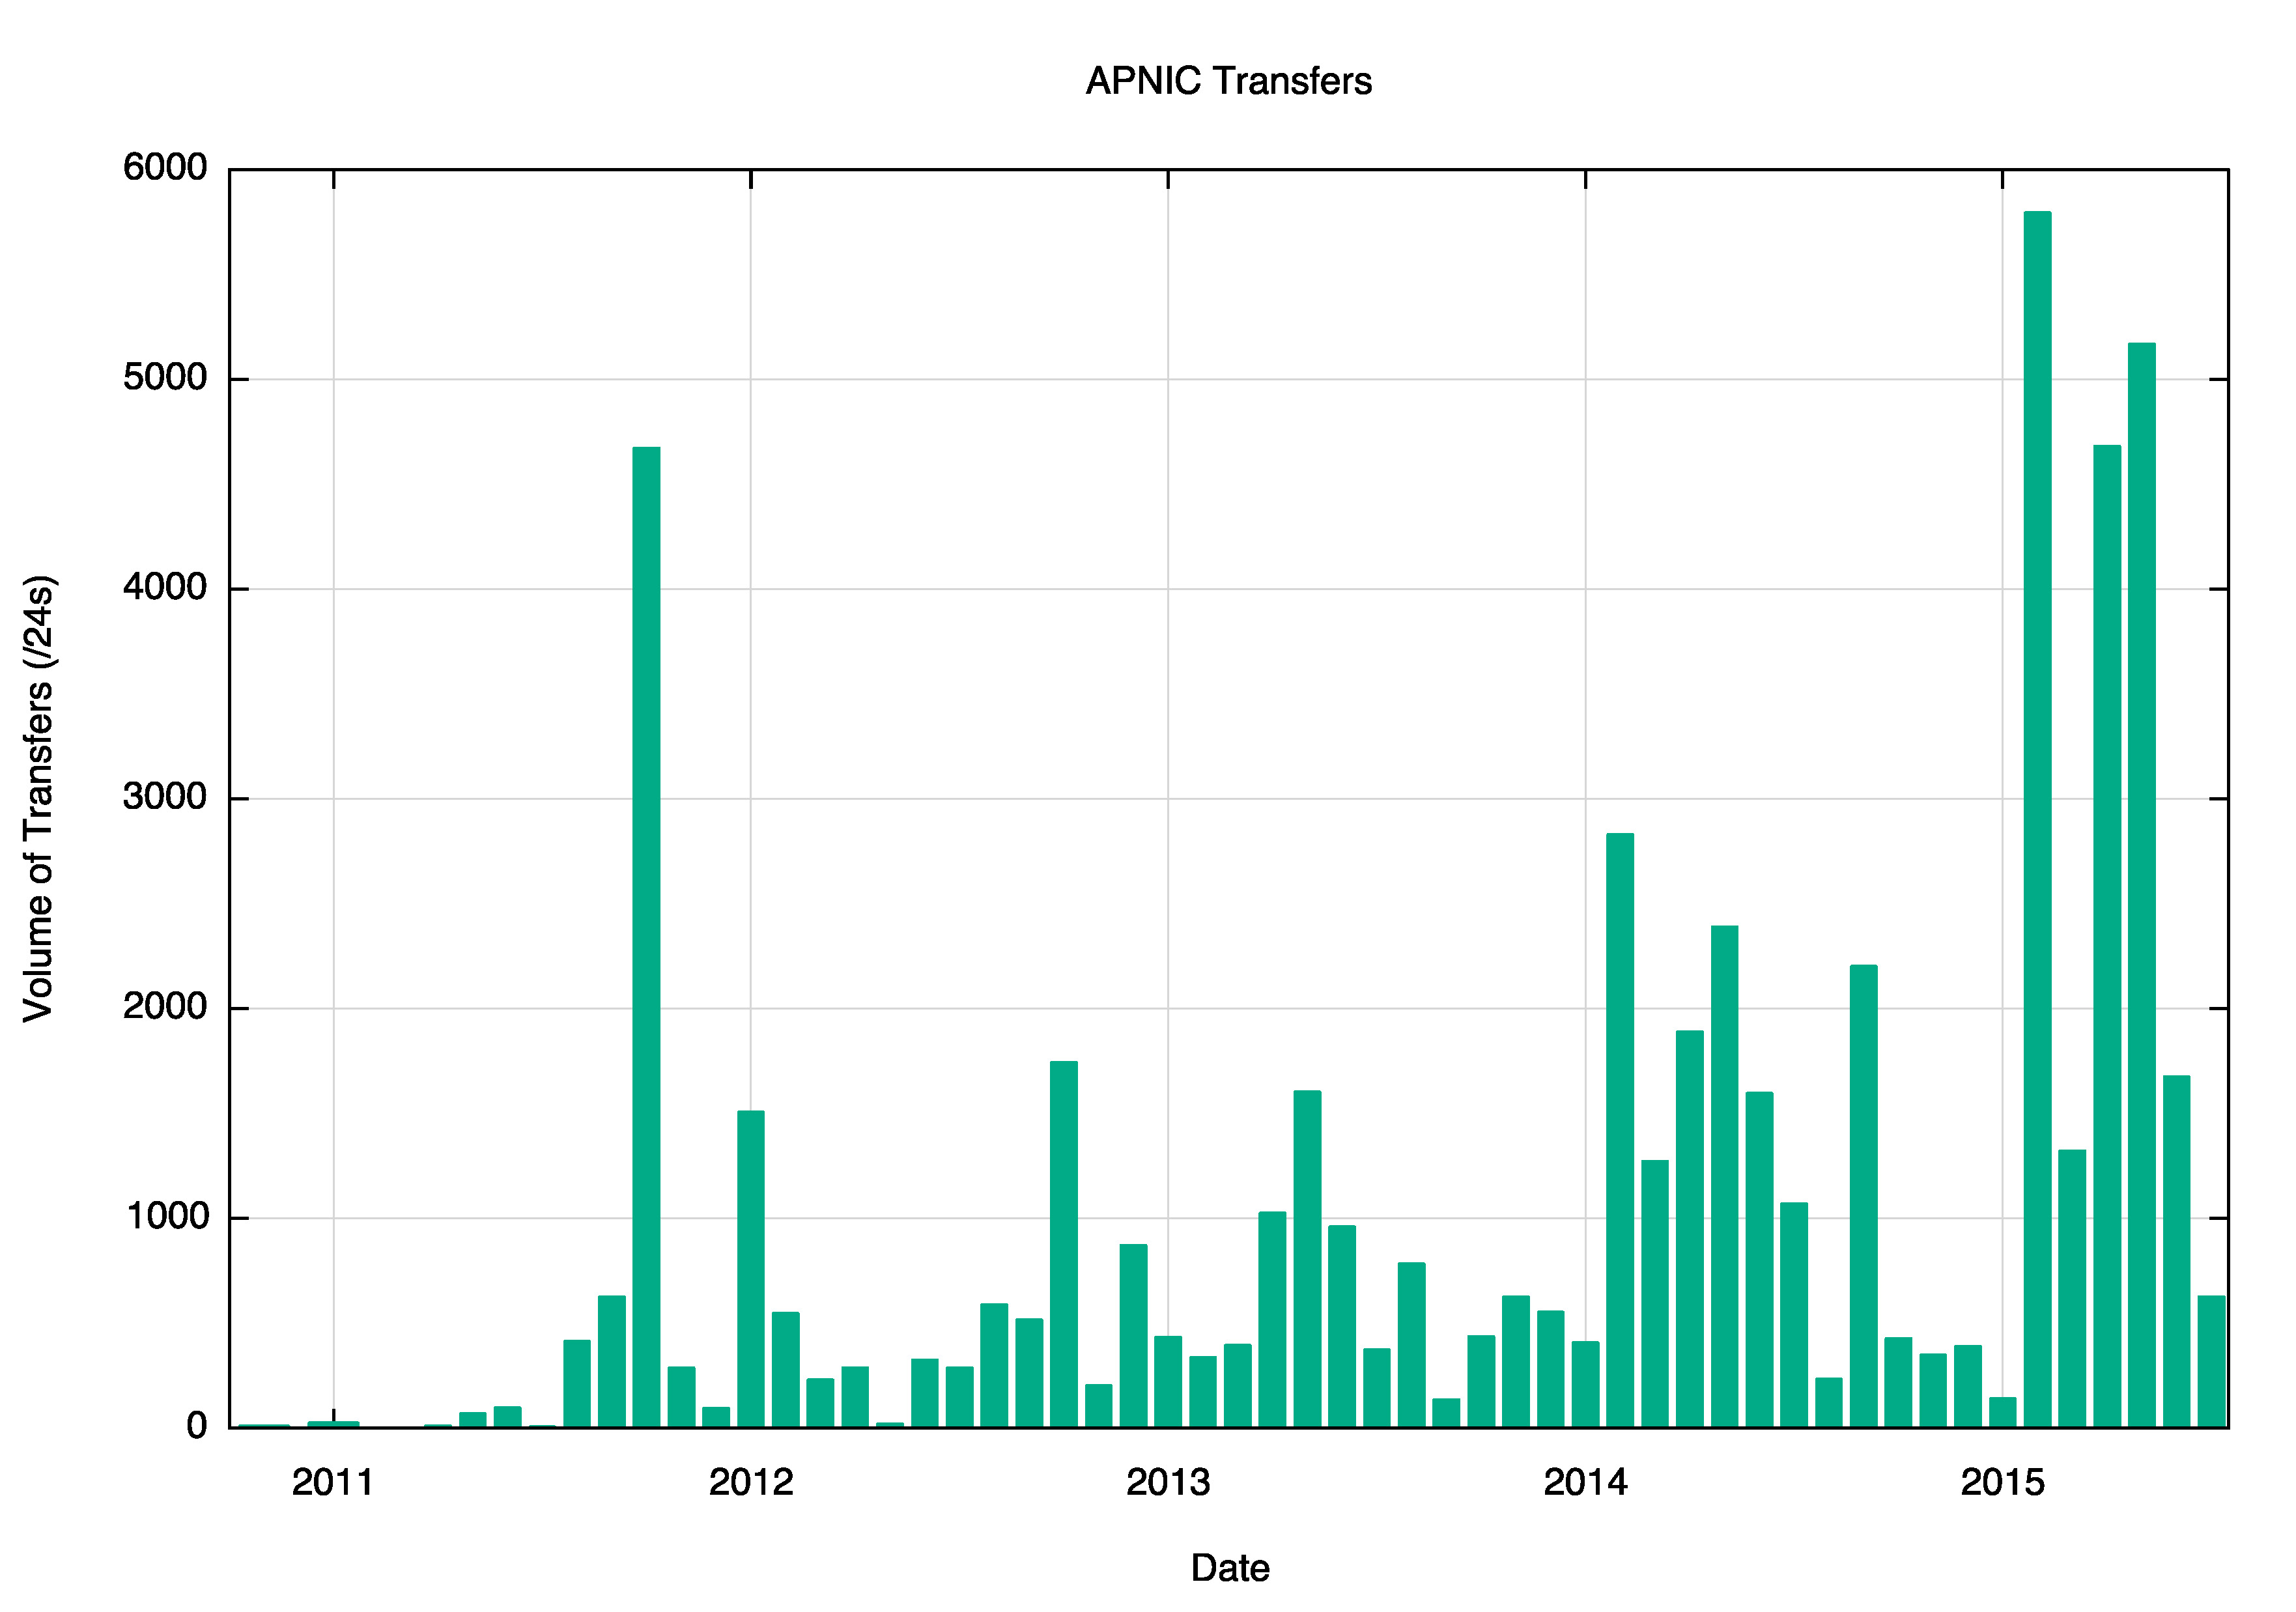
Figure 1 – Per Month view of APNIC transfers, showing the number of transfers per month (left) and the volume of transferred addresses (right)
It is also interesting to examine the “age†of transferred addresses. Figure 2 shows the same set of transfers in the APNIC transfer registry, but this time using the original APNIC Assignment or allocation date as the basis of the distribution. The number of transfers for each original registration month, and the total size of transferred addresses from that registration month are shown here.
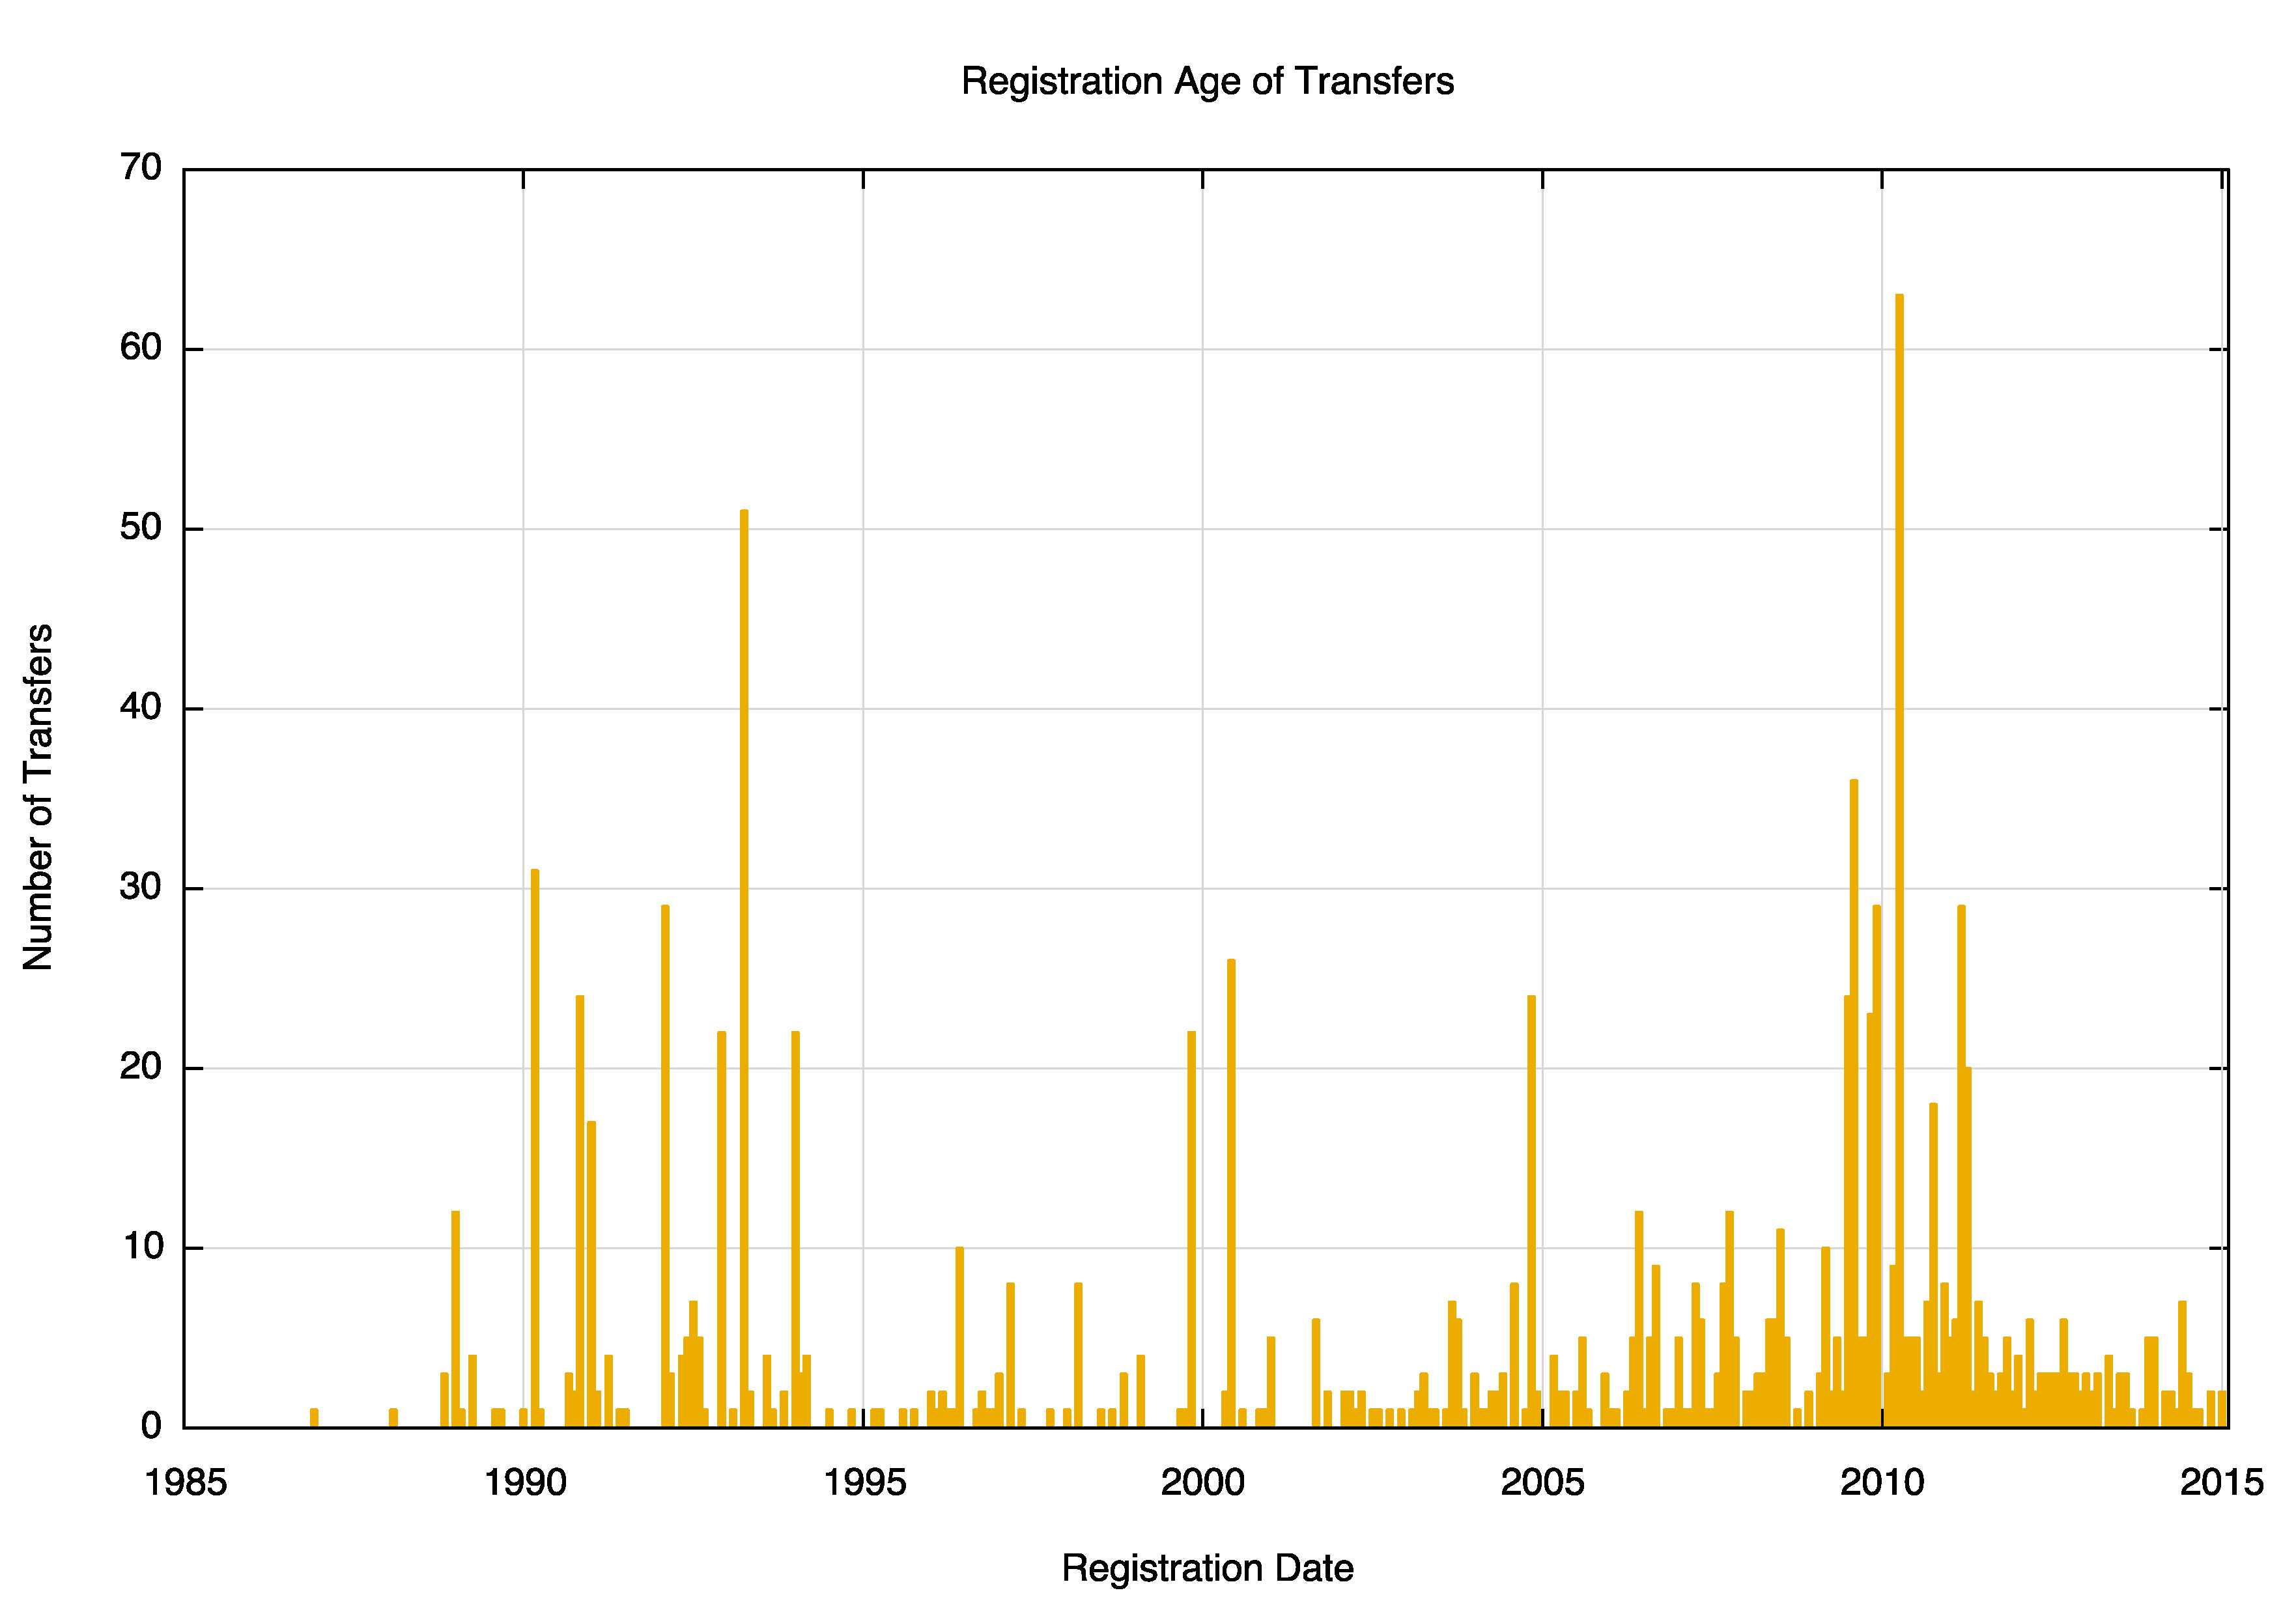
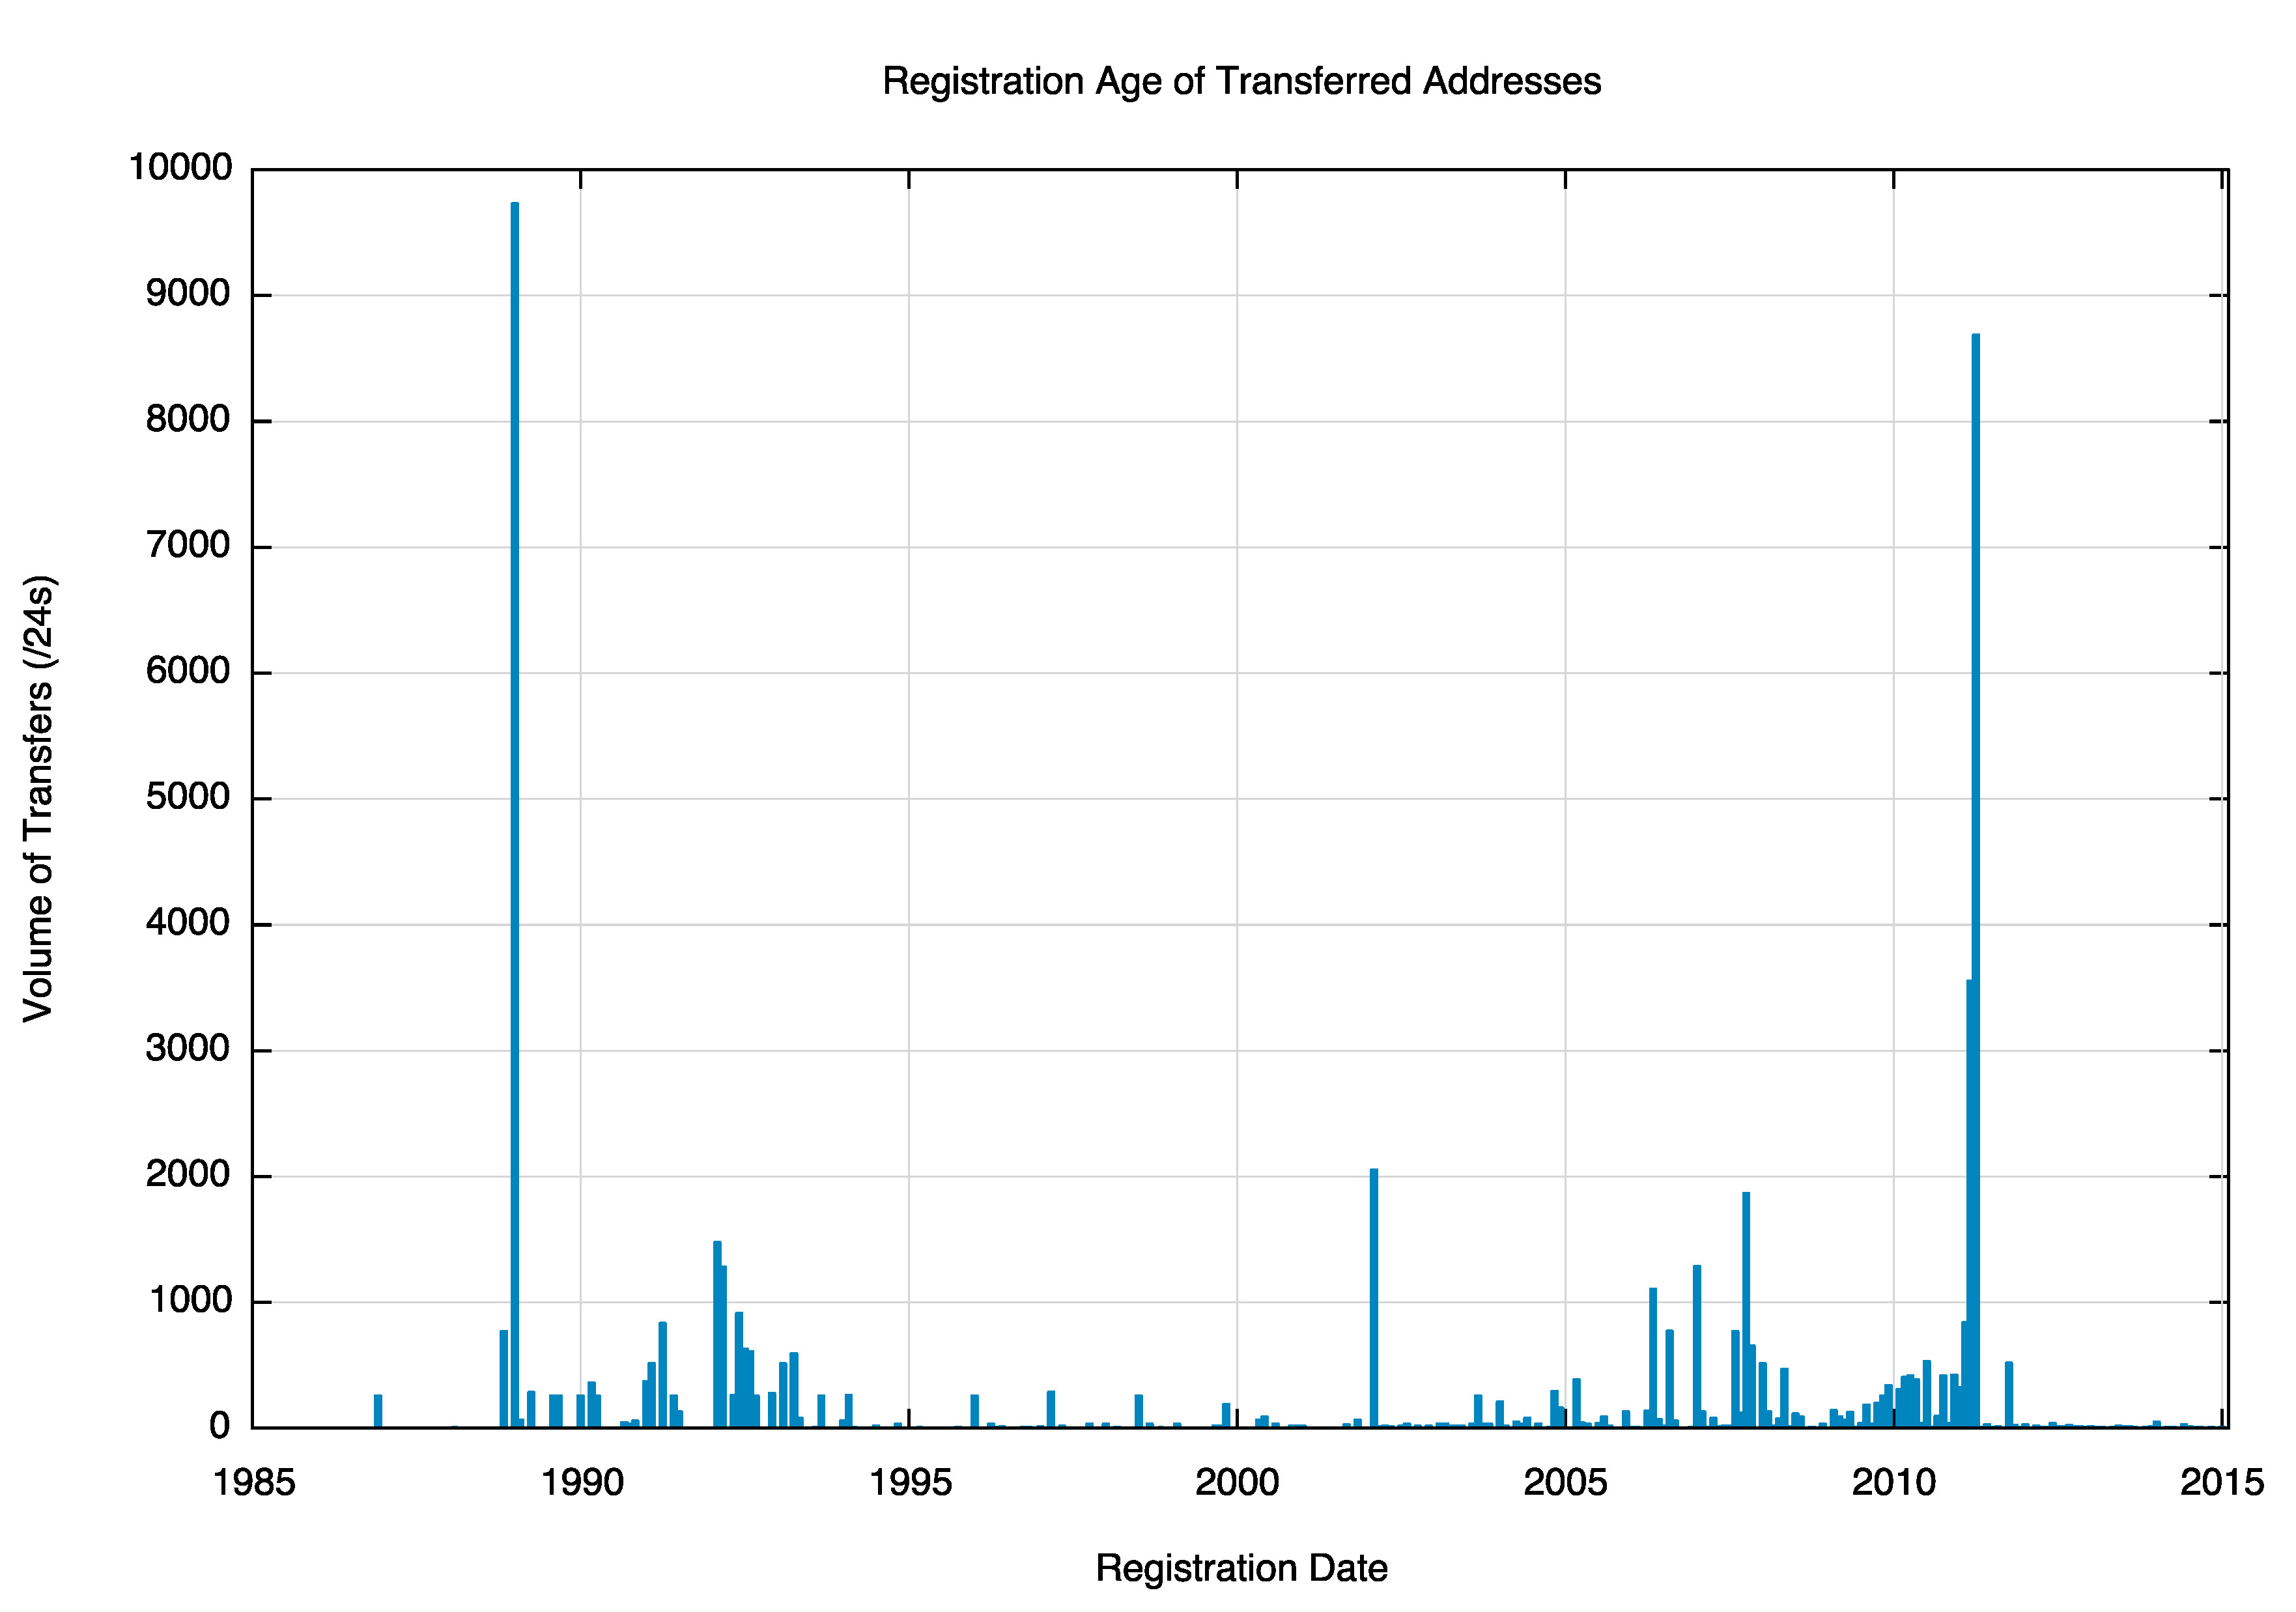
Figure 2 – Per Month view of APNIC transfers, showing the registration age of transfers per month (left) and the volume of transferred addresses by registration age (right)
There appears to be two relative peaks of registration age of transferred addresses. One is pre-1995, and shows the movement of the so-called “legacy addresses†that were originally allocated prior to the commencement of APNIC’s operation. The second is a movement of addresses that were allocated in the period from 2009 through to 2011.
How “old†are transferred addresses at the time of the transfer? Figure 3 shows the age of the transferred addresses at the time of the transfer. There has been a considerable level of transfer activity in addresses that have been originally allocated in the 5 years previous to the transfer, as well as transfers of the legacy address space. The most “stable†address space has been held for 6 to 18 years.
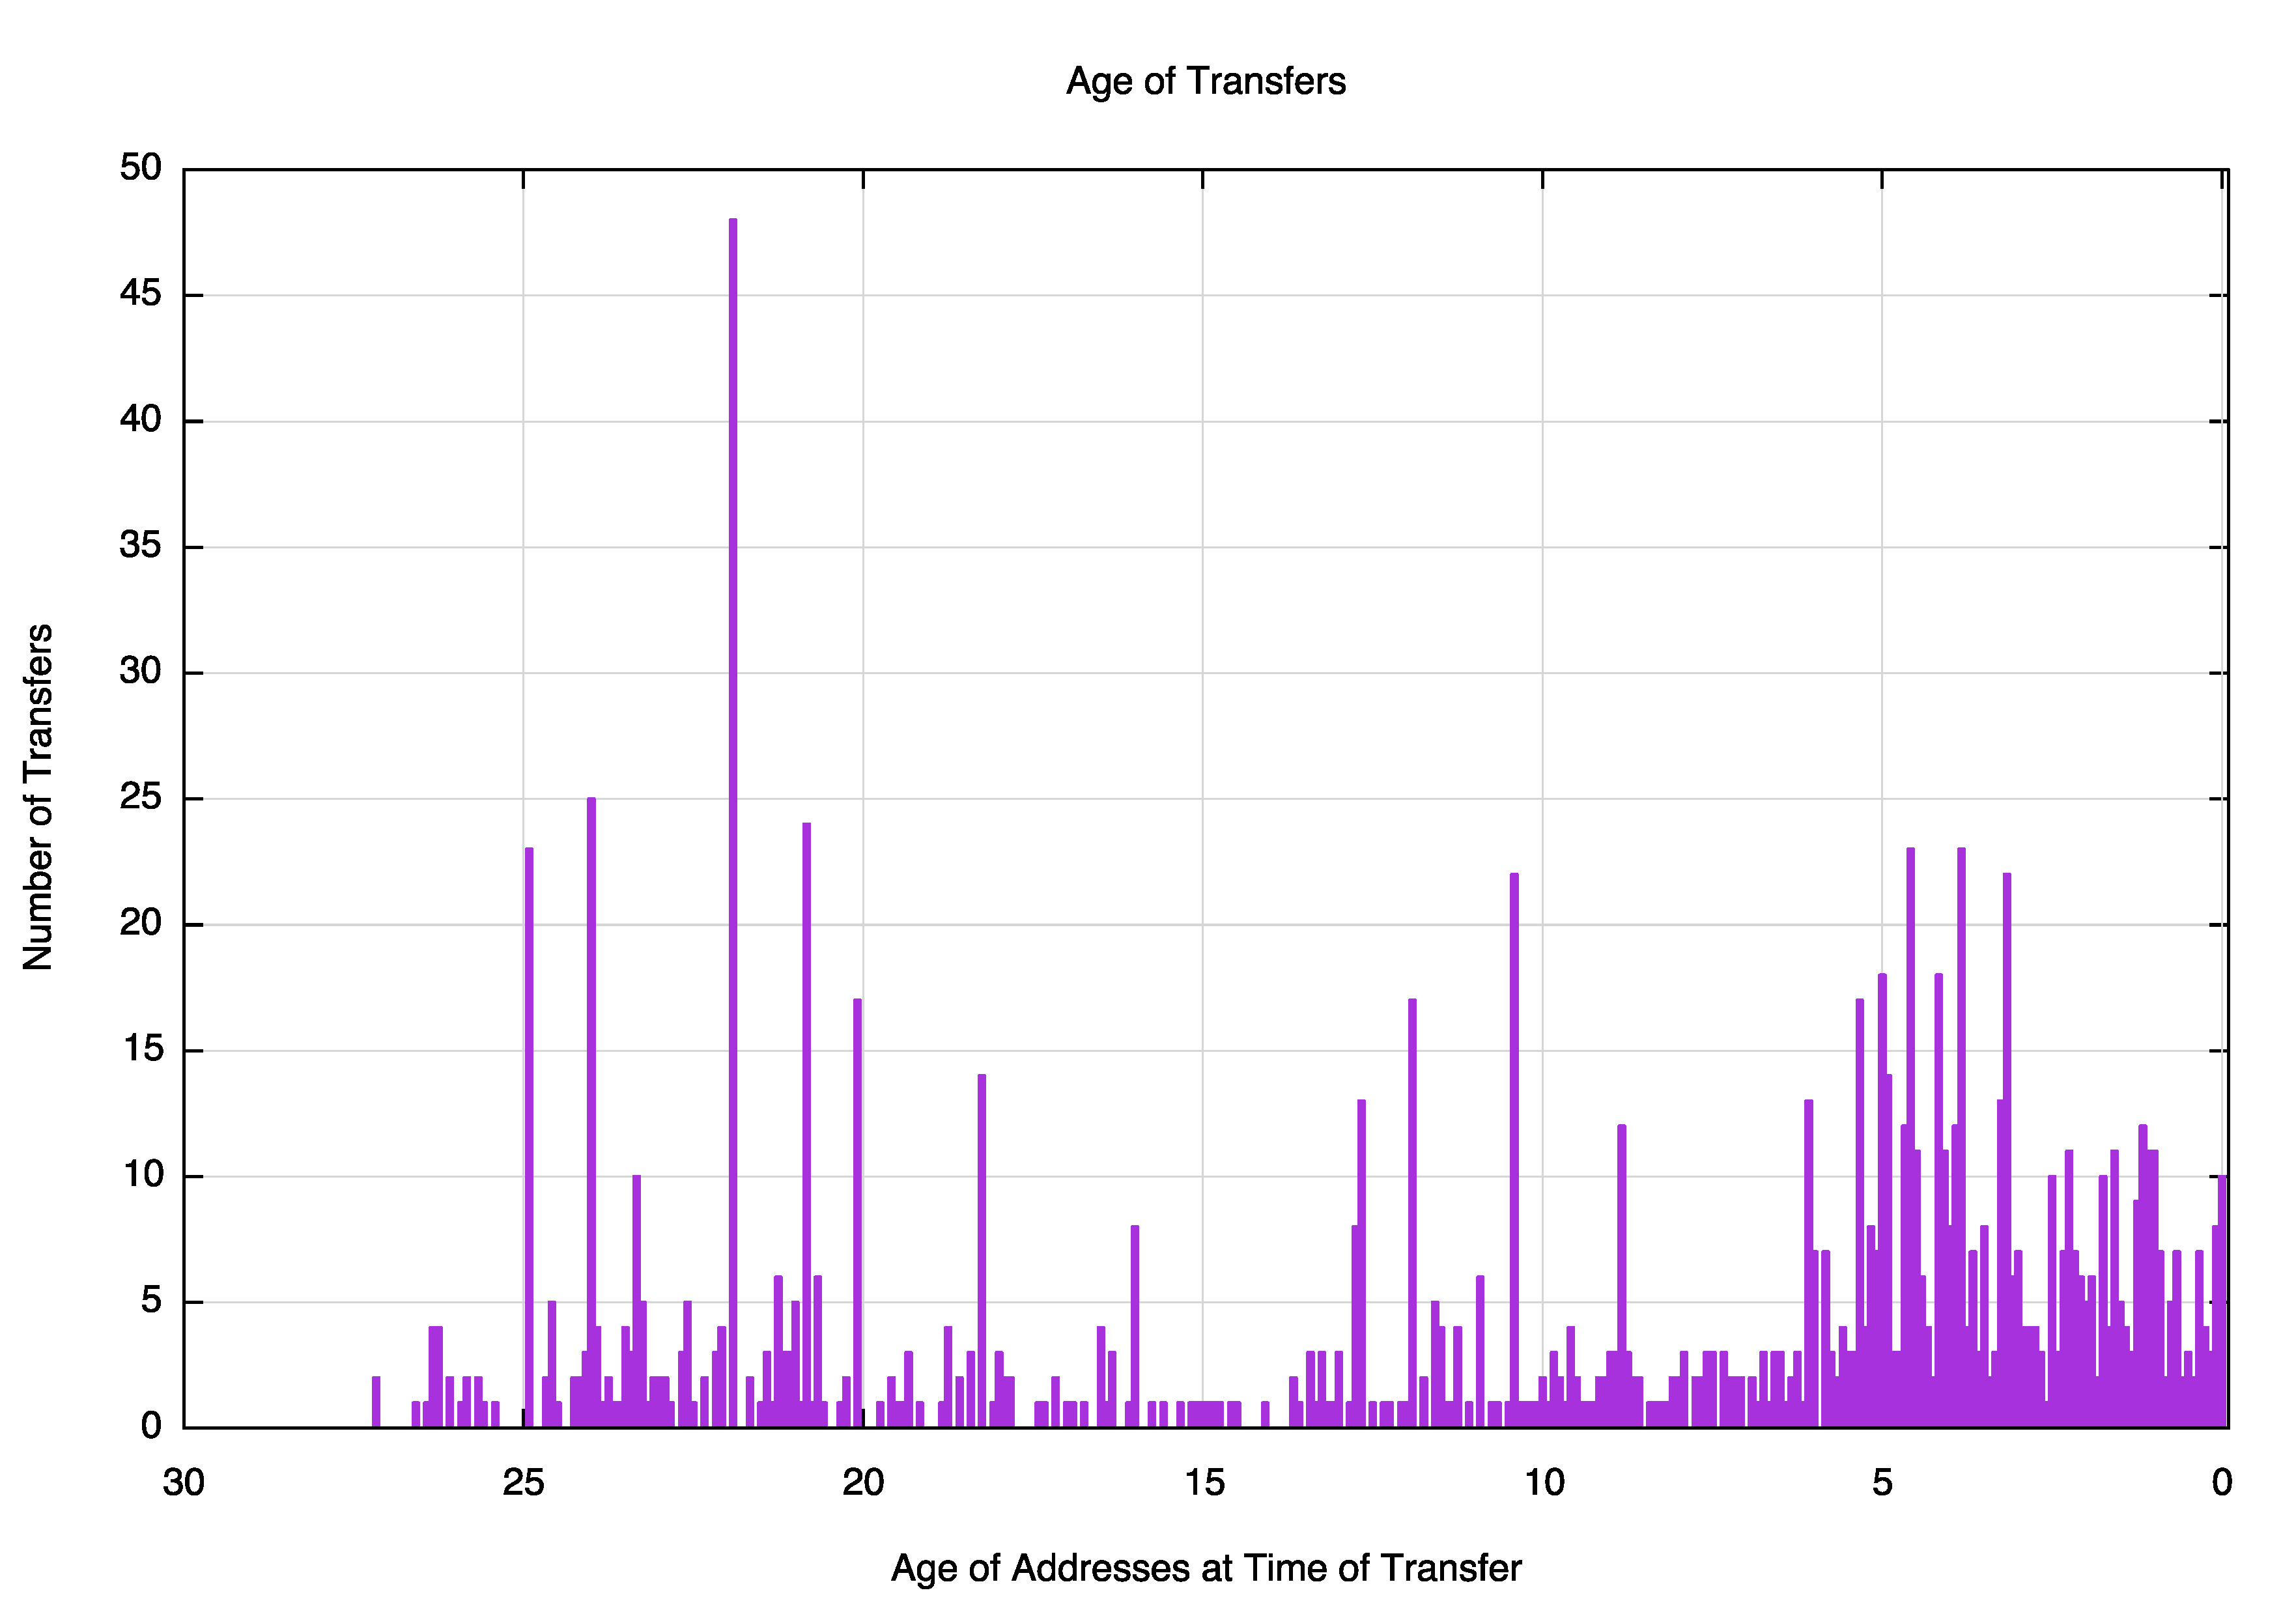
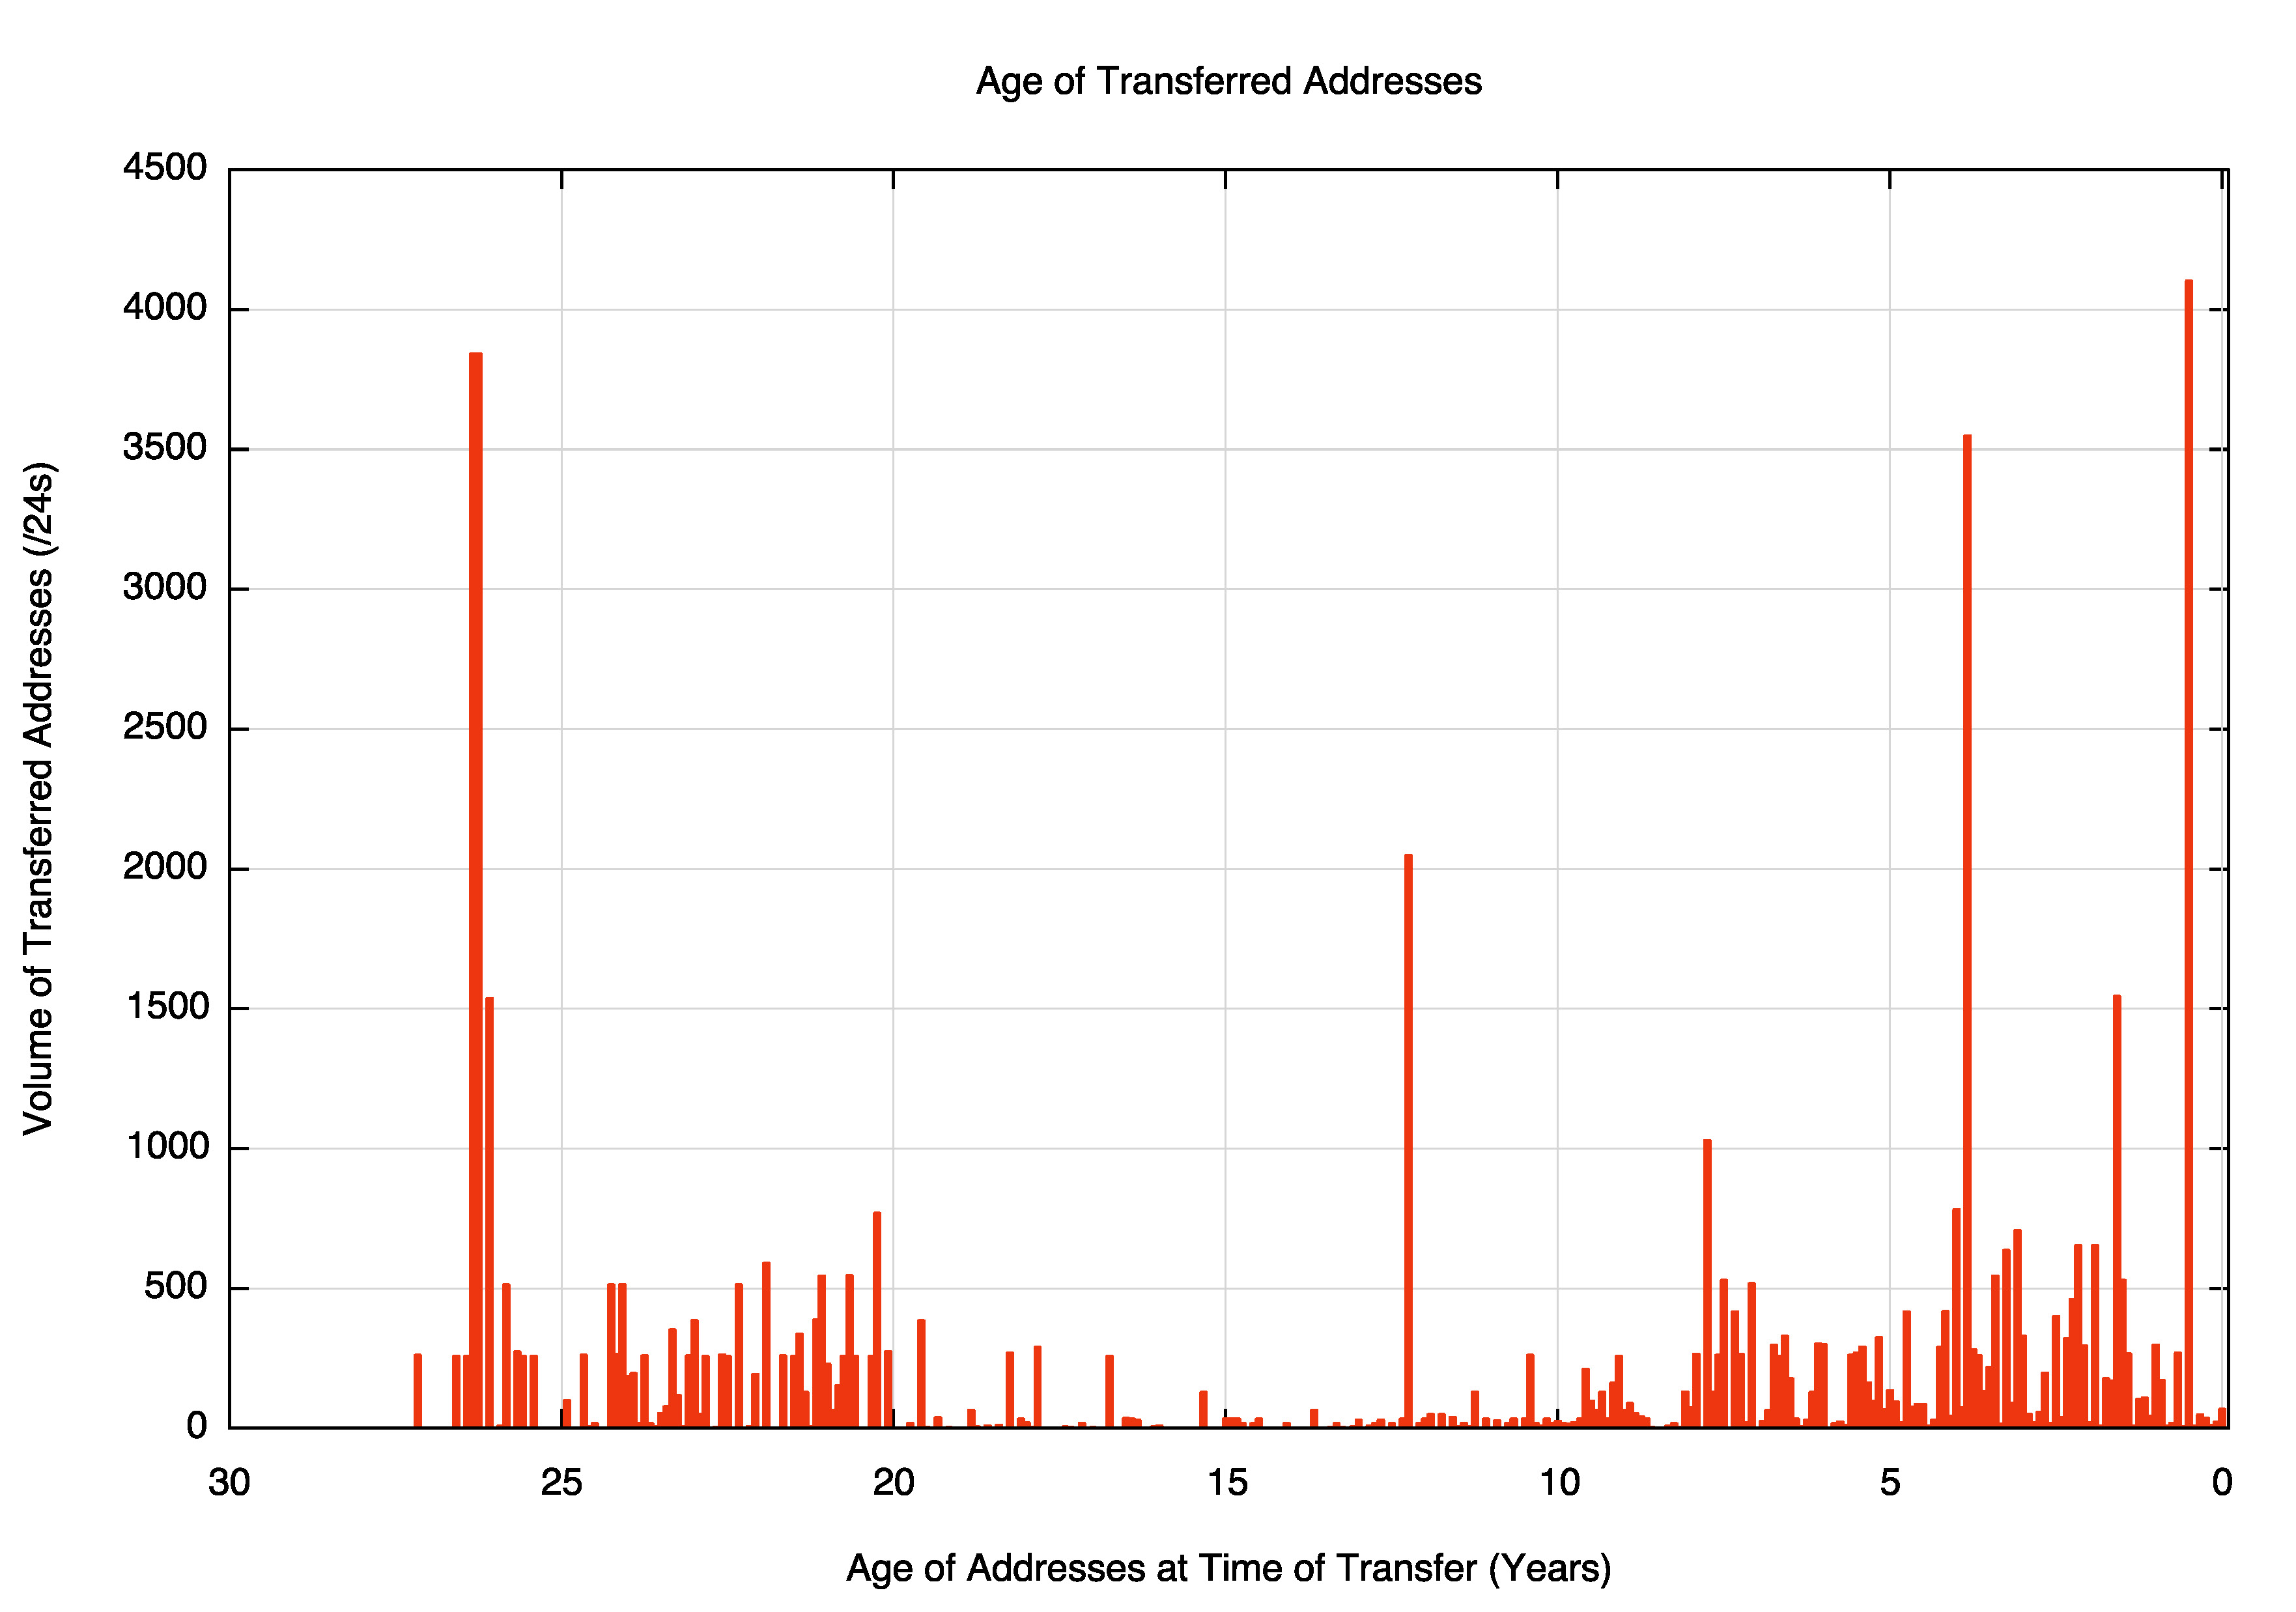
Figure 3 – Per Month view of APNIC transfers, showing the age of transfers per month (left) and the volume of transferred addresses by age (right)
A different perspective on transfers is to look at address transfers at a national level, where address transfers can be categorised as either a purely “domestic†transaction where the source and destination of an address transfer reside in the same country, or as a coupled pair of transactions as an “export†from the source country and a corresponding “import†to the destination country. If we categorize all logged transfers using this model of imports, exports and domestic transactions, then the set of all transfers recorded by APNIC is as shown in Table 1.
| CC | IMPORTS | EXPORTS | DOMESTIC | TOTAL | Country | ||||
| Number | Addresses | Number | Addresses | Number | Addresses | Number | Addresses | ||
| CN | 22 | 3,574,272 | 10 | 1,445,888 | 35 | 1,570,304 | 67 | 6,590,464 | China |
| ARIN | 0 | 0 | 172 | 4,536,320 | 0 | 0 | 172 | 4,536,320 | ARIN |
| HK | 34 | 1,942,272 | 24 | 1,626,368 | 69 | 261,632 | 127 | 3,830,272 | Hong Kong |
| JP | 15 | 659,712 | 1 | 65,536 | 366 | 2,350,336 | 382 | 3,075,584 | Japan |
| AU | 19 | 540,160 | 13 | 294,400 | 143 | 539,648 | 175 | 1,374,208 | Australia |
| SG | 25 | 636,160 | 10 | 363,520 | 5 | 36,864 | 40 | 1,036,544 | Singapore |
| IN | 92 | 464,128 | 0 | 0 | 102 | 314,368 | 194 | 778,496 | India |
| TH | 5 | 221,184 | 0 | 0 | 18 | 325,632 | 23 | 546,816 | Thailand |
| AP | 10 | 147,456 | 2 | 6,144 | 4 | 72,704 | 16 | 226,304 | Asia Pacific |
| MY | 10 | 173,824 | 3 | 1,536 | 7 | 7,936 | 20 | 183,296 | Malaysia |
| NZ | 5 | 17,664 | 5 | 90,368 | 11 | 50,432 | 21 | 158,464 | New Zealand |
| PH | 7 | 77,568 | 0 | 0 | 9 | 61,440 | 16 | 139,008 | Philippines |
| ID | 1 | 8,192 | 5 | 40,960 | 26 | 33,792 | 32 | 82,944 | Indonesia |
| BD | 1 | 1,024 | 2 | 9,216 | 17 | 45,056 | 20 | 55,296 | Bangladesh |
| NP | 0 | 0 | 1 | 2,048 | 1 | 16,384 | 2 | 18,432 | Nepal |
| MN | 1 | 256 | 1 | 256 | 3 | 17,408 | 5 | 17,920 | Mongolia |
| PF | 1 | 16,384 | 0 | 0 | 0 | 0 | 1 | 16,384 | French Polynesia |
| KH | 0 | 0 | 0 | 0 | 6 | 13,312 | 6 | 13,312 | Cambodia |
| PK | 0 | 0 | 0 | 0 | 9 | 6,144 | 9 | 6,144 | Pakistan |
| TW | 1 | 1,024 | 2 | 1,536 | 0 | 0 | 3 | 2,560 | Taiwan |
| KR | 2 | 2,048 | 0 | 0 | 0 | 0 | 2 | 2,048 | Republic of Korea |
| PG | 0 | 0 | 0 | 0 | 2 | 2,048 | 2 | 2,048 | Papua New Guinea |
| WS | 0 | 0 | 1 | 1,024 | 0 | 0 | 1 | 1,024 | Samoa |
| MM | 1 | 1,024 | 0 | 0 | 0 | 0 | 1 | 1,024 | Myanmar |
| AF | 1 | 1,024 | 0 | 0 | 0 | 0 | 1 | 1,024 | Afghanistan |
| FJ | 0 | 0 | 1 | 256 | 0 | 0 | 1 | 256 | Fiji |
Table 1 – Address Imports and Exports by country
The region is a net importer of addresses, purchasing a total of 4.5M addresses from North America. Within the region the highest level of activity is found in China, with 1.5M address changing hands within China, 1.4M addresses being traded to other regional countries and 3.6M addresses being imported into China. Somewhat surprising is the second largest country here, Hong Kong, importing 1.9M addresses and exporting 1.6M addresses.
A heatmap representation of this matrix is shown in Figure 14. (ARIN is represented in this figure using the two letter code ‘AX’). China is a major importer of addresses, but there are export movements out of China to Hong Kong and Thailand. Hong Kong is the largest exporter of addresses, but it has also pulled addresses in from China, ARIN and to a far lesser extent, Australia.
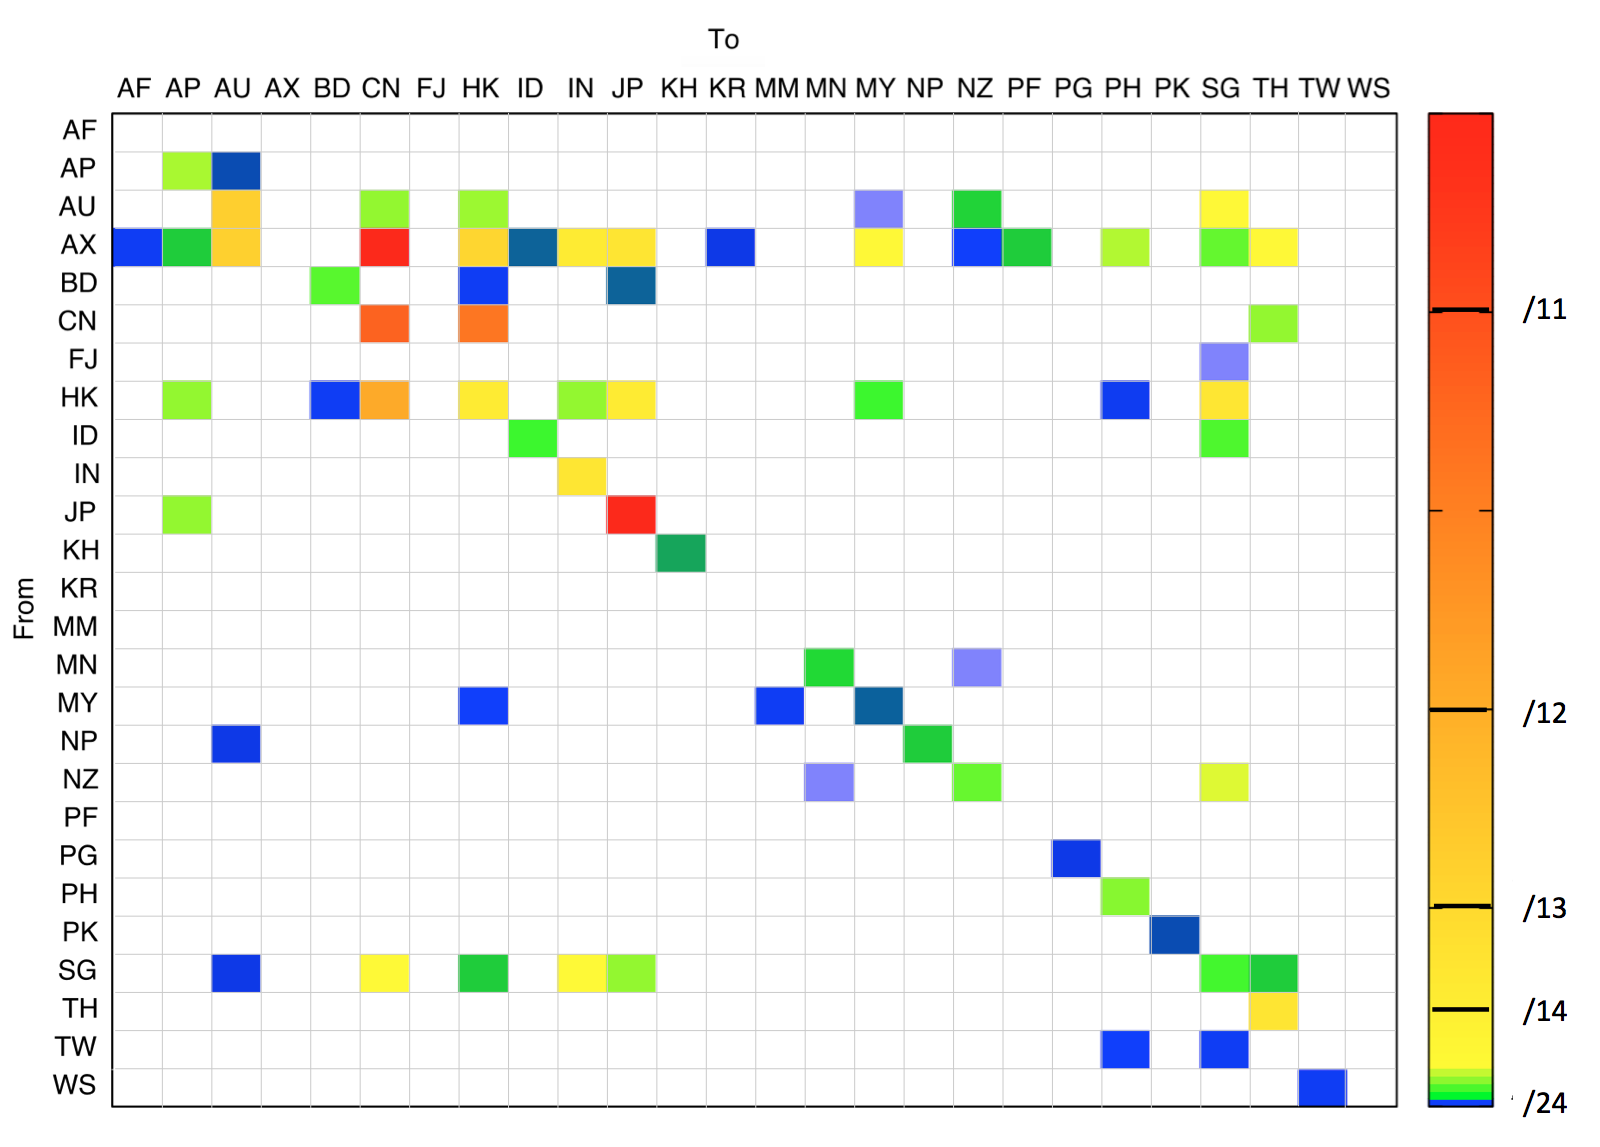
Figure 4 – Address Imports and Exports Matrix heatmap
The complete matrix of address movement in the transfer registry is shown in Table 2.
| Dest | AF | AP | ARIN | AU | BD | CN | FJ | HK | ID | IN | JP | KH | KR | MM | MN | MY | NP | NZ | PF | PG | PH | PK | SG | TH | TW | WS
| Source |
AF |
0 |
0 |
0 |
0 |
0 |
0 |
0 |
0 |
0 |
0 |
0 |
0 |
0 |
0 |
0 |
0 |
0 |
0 |
0 |
0 |
0 |
0 |
0 |
0 |
0 |
| AP |
0 |
72704 |
0 |
6144 |
0 |
0 |
0 |
0 |
0 |
0 |
0 |
0 |
0 |
0 |
0 |
0 |
0 |
0 |
0 |
0 |
0 |
0 |
0 |
0 |
0 |
0 |
ARIN |
1024 |
16384 |
0 |
529920 |
0 |
2490368 |
0 |
475648 |
8192 |
267520 |
323840 |
0 |
2048 |
0 |
0 |
140288 |
0 |
512 |
16384 |
0 |
75776 |
0 |
49152 |
139264 |
0 |
0 |
AU |
0 |
0 |
0 |
539648 |
0 |
65536 |
0 |
68352 |
0 |
0 |
0 |
0 |
0 |
0 |
0 |
256 |
0 |
16896 |
0 |
0 |
0 |
0 |
143360 |
0 |
0 |
0 |
BD |
0 |
0 |
0 |
0 |
45056 |
0 |
0 |
1024 |
0 |
0 |
8192 |
0 |
0 |
0 |
0 |
0 |
0 |
0 |
0 |
0 |
0 |
0 |
0 |
0 |
0 |
0 |
CN |
0 |
0 |
0 |
0 |
0 |
1570304 |
0 |
1380352 |
0 |
0 |
0 |
0 |
0 |
0 |
0 |
0 |
0 |
0 |
0 |
0 |
0 |
0 |
0 |
65536 |
0 |
0 |
FJ |
0 |
0 |
0 |
0 |
0 |
0 |
0 |
0 |
0 |
0 |
0 |
0 |
0 |
0 |
0 |
0 |
0 |
0 |
0 |
0 |
0 |
0 |
256 |
0 |
0 |
0 |
HK |
0 |
65536 |
0 |
0 |
1024 |
886272 |
0 |
261632 |
0 |
65536 |
262144 |
0 |
0 |
0 |
0 |
33280 |
0 |
0 |
0 |
0 |
1280 |
0 |
311296 |
0 |
0 |
0 |
ID |
0 |
0 |
0 |
0 |
0 |
0 |
0 |
0 |
33792 |
0 |
0 |
0 |
0 |
0 |
0 |
0 |
0 |
0 |
0 |
0 |
0 |
0 |
40960 |
0 |
0 |
0 |
IN |
0 |
0 |
0 |
0 |
0 |
0 |
0 |
0 |
0 |
314368 |
0 |
0 |
0 |
0 |
0 |
0 |
0 |
0 |
0 |
0 |
0 |
0 |
0 |
0 |
0 |
0 |
JP |
0 |
65536 |
0 |
0 |
0 |
0 |
0 |
0 |
0 |
0 |
2350336 |
0 |
0 |
0 |
0 |
0 |
0 |
0 |
0 |
0 |
0 |
0 |
0 |
0 |
0 |
0 |
KH |
0 |
0 |
0 |
0 |
0 |
0 |
0 |
0 |
0 |
0 |
0 |
13312 |
0 |
0 |
0 |
0 |
0 |
0 |
0 |
0 |
0 |
0 |
0 |
0 |
0 |
0 |
KR |
0 |
0 |
0 |
0 |
0 |
0 |
0 |
0 |
0 |
0 |
0 |
0 |
0 |
0 |
0 |
0 |
0 |
0 |
0 |
0 |
0 |
0 |
0 |
0 |
0 |
0 |
MM |
0 |
0 |
0 |
0 |
0 |
0 |
0 |
0 |
0 |
0 |
0 |
0 |
0 |
0 |
0 |
0 |
0 |
0 |
0 |
0 |
0 |
0 |
0 |
0 |
0 |
0 |
MN |
0 |
0 |
0 |
0 |
0 |
0 |
0 |
0 |
0 |
0 |
0 |
0 |
0 |
0 |
17408 |
0 |
0 |
256 |
0 |
0 |
0 |
0 |
0 |
0 |
0 |
0 |
MY |
0 |
0 |
0 |
0 |
0 |
0 |
0 |
512 |
0 |
0 |
0 |
0 |
0 |
1024 |
0 |
7936 |
0 |
0 |
0 |
0 |
0 |
0 |
0 |
0 |
0 |
0 |
NP |
0 |
0 |
0 |
2048 |
0 |
0 |
0 |
0 |
0 |
0 |
0 |
0 |
0 |
0 |
0 |
0 |
16384 |
0 |
0 |
0 |
0 |
0 |
0 |
0 |
0 |
0 |
NZ |
0 |
0 |
0 |
0 |
0 |
0 |
0 |
0 |
0 |
0 |
0 |
0 |
0 |
0 |
256 |
0 |
0 |
50432 |
0 |
0 |
0 |
0 |
90112 |
0 |
0 |
0 |
PF |
0 |
0 |
0 |
0 |
0 |
0 |
0 |
0 |
0 |
0 |
0 |
0 |
0 |
0 |
0 |
0 |
0 |
0 |
0 |
0 |
0 |
0 |
0 |
0 |
0 |
0 |
PG |
0 |
0 |
0 |
0 |
0 |
0 |
0 |
0 |
0 |
0 |
0 |
0 |
0 |
0 |
0 |
0 |
0 |
0 |
0 |
2048 |
0 |
0 |
0 |
0 |
0 |
0 |
PH |
0 |
0 |
0 |
0 |
0 |
0 |
0 |
0 |
0 |
0 |
0 |
0 |
0 |
0 |
0 |
0 |
0 |
0 |
0 |
0 |
61440 |
0 |
0 |
0 |
0 |
0 |
PK |
0 |
0 |
0 |
0 |
0 |
0 |
0 |
0 |
0 |
0 |
0 |
0 |
0 |
0 |
0 |
0 |
0 |
0 |
0 |
0 |
0 |
6144 |
0 |
0 |
0 |
0 |
SG |
0 |
0 |
0 |
2048 |
0 |
132096 |
0 |
16384 |
0 |
131072 |
65536 |
0 |
0 |
0 |
0 |
0 |
0 |
0 |
0 |
0 |
0 |
0 |
36864 |
16384 |
0 |
0 |
TH |
0 |
0 |
0 |
0 |
0 |
0 |
0 |
0 |
0 |
0 |
0 |
0 |
0 |
0 |
0 |
0 |
0 |
0 |
0 |
0 |
0 |
0 |
0 |
325632 |
0 |
0 |
TW |
0 |
0 |
0 |
0 |
0 |
0 |
0 |
0 |
0 |
0 |
0 |
0 |
0 |
0 |
0 |
0 |
0 |
0 |
0 |
0 |
512 |
0 |
1024 |
0 |
0 |
0 |
WS |
0 |
0 |
0 |
0 |
0 |
0 |
0 |
0 |
0 |
0 |
0 |
0 |
0 |
0 |
0 |
0 |
0 |
0 |
0 |
0 |
0 |
0 |
0 |
0 |
1024 |
0 |
|
Table 2 – Address Imports and Exports Matrix
The largest sellers of address space into the Asia Pacific Region are listed in Table 3.
| Seller | Address Count |
| Nortel, US (ARIN) | 2,359,296 |
| CNISP-Union Technology (Beijing) Co., Ltd, CN | 1,409,024 |
| Cloud-Sense Technology Corporation Ltd, HK | 1,179,648 |
| GuangXi Seehu Technology Co., Ltd, CN | 827,832 |
| DOMIRU, JP | 587,776 |
| AOL, US (ARIN) | 524,288 |
| JPNIC (no details) | 421,888 |
| Beyond Excellent Technology Ltd, HK | 262,144 |
| Northern Telecom Canada, CA (ARIN) | 262,144 |
| Outstanding Telecommunication Pte Ltd, SG | 262,144 |
| Renjiao International Technology Ltd, HK | 245,760 |
| Bank of America, US (ARIN) | 197,632 |
| Oak Point Partners, US (ARIN) | 196,608 |
| ShenZhen TC telecom Network Corp, CN | 183,296 |
| SPACENET, US (ARIN) | 147,456 |
Table 3 – Largest Sellers of Address Space into the Asia Pacific Region
The largest buyers of address space in the Asia Pacific Region are listed in Table 4.
| Buyer | Address Count |
| ALISOFT, Aliyun Computing Co, CN | 3,801,088 |
| Cloud-Sense Technology Corporation Ltd, HK | 1,179,648 |
| SAKURA Internet, JP | 541,696 |
| Foxtel Management Pty Ltd, AU | 524,288 |
| True Internet Co., Ltd, TH | 327,680 |
| Beyond Excellent Technology Ltd, HK | 262,144 |
| Abitcool BroadBand Inc, CN | 262,144 |
| Vodafone Spacetel Limited, IN | 229,376 |
| NTT DoCoMo, JP | 212,992 |
| DIX Co, JP | 199,936 |
| Bank of America, N.A. HK | 197,632 |
| Telewings Communications Services Ltd, IN | 196,608 |
| IIJ, JP | 196,608 |
| FreeBit Co, JP | 192,512 |
| SingTel Optus Pty Ltd, AU | 180,224 |
Table 4 – Largest Buyers of Address Space into the Asia Pacific Region
These lists provide some indicators of the motivations for these transfers.
The listing for the Bank of America appears to be a shift of registry for a collection of IP addresses used by a Hong Kong subsidiary operation of the bank. Normally such shifts of address due to corporate restructuring, including mergers and acquisitions, are handled by the registry system without listing them in the transfer registry. However, in this case the address holder has chosen to log this address movement as a transfer and it is therefore listed in the same registry as all other address trades.
The listing for Beyond Excellent Technology as both a buyer and seller (see the extract from the Transfer Log in Figure 5) may be interpreted as some form of indirect evidence of the use of brokers in this market. Active brokers who buy and sell the traded goods are common in many other commodity markets, and their direct participation in the market is able to facilitate certain market transactions by splitting or aggregating resources to match the individual requirements of buyers and sellers and also allowing a transaction to be spread over time. However while the original transfer framework had no particular constraints on the actions of such broker intermediaries in address transfers, the adoption of a “justified need†to register a transfer in late 2011 (https://www.apnic.net/policy/proposals/prop-096) means that such brokering actions, if they occur at all, occur outside of the direct view of the registry, and only the final outcomes are registered. The prevailing policy framework used by APNIC for registering address transfers requires that the buyer demonstrate to APNIC that they have some form of “demonstrated need†to use these addresses, which would theoretically preclude the registration of transactions undertaken by such active participation by intermediaries from this particular market in addresses.
         ipv4|118.200.0.0/16|Beyond Excellent Technology|HK|APNIC|20071019|SingNet|SG|APNIC|20121222
         ipv4|118.201.0.0/16|Beyond Excellent Technology|HK|APNIC|20071019|SingNet|SG|APNIC|20130326
         ipv4|131.129.0.0/16|ARIN: NORTEL|AP|ARIN|19890411|Beyond Excellent Technology|HK|APNIC|20140926
         ipv4|131.147.0.0/16|ARIN: NORTEL|AP|ARIN|19881123|Beyond Excellent Technology|HK|APNIC|20140926
         ipv4|131.213.0.0/16|ARIN: NORTEL|AP|ARIN|19890118|Beyond Excellent Technology|HK|APNIC|20140926
         ipv4|137.74.0.0/16|ARIN: NORTEL|AP|ARIN|19881123|Beyond Excellent Technology Ltd|HK|APNIC|20140926
         ipv4|131.147.0.0/16|Beyond Excellent Technology|HK|APNIC|19881123|JPNIC/so-net|JP|APNIC|20150612
         ipv4|131.213.0.0/16|Beyond Excellent Technology|HK|APNIC|19890118|JPNIC/so-net|JP|APNIC|20150612
Figure 5 – Extracts from the APNIC Transfer Log (1)
There are 101 entries in the APNIC transfer log where address blocks appear more than once in the log, indicating that the transferred addresses were subsequently disposed of to a third party. Figure 5 shows one such instance, where the address blocks 131.147.0.0/16 and 131.213.0.0/16 where transferred from Nortel to Beyond Excellent Technology in Hong Kong in September 2014 and subsequently transferred to So-net Corp in Japan in June 2015. There are four instances of an address changing hands three times, as show in the extracts from the Transfer log in Figure 6. In the first case the address 103.10.199.0/24 appears to have been transferred onward 16 days after the first transfer, and then transferred to the current holder 13 days later. The third case in Figure 6 shows that the address 49.249.32.0/24 appears to have been transferred, then rescinded and transferred again some three months later. The final case in Figure 6 for 210.79.48.0/24 looks to be some form of registry error.
         ipv4|103.10.199.0/24|Agarto Sdn Bhd|MY|APNIC|20110729|Hostemo Technology Sdn Bhd|MY|APNIC|20120313
         ipv4|103.10.199.0/24|Hostemo Technology Sdn Bhd|MY|APNIC|20120312|Pacswitch Globe Telecom|HK|APNIC|20120329
         ipv4|103.10.199.0/24|Pacswitch Globe Telecom Limited|HK|APNIC|20120328|MiHK|HK|APNIC|20120411

         ipv4|182.236.12.0/24|JPNIC/DOMIRU|JP|APNIC|20100423|JPNIC/DIX|JP|APNIC|20121011
         ipv4|182.236.12.0/24|JPNIC/DIX|JP|APNIC|20100423|JPNIC/DOMIRU|JP|APNIC|20140311
         ipv4|182.236.12.0/24|JPNIC/DOMIRU|JP|APNIC|20100423|JPNIC/NIFTY-NET|JP|APNIC|20150319

         ipv4|49.249.32.0/24|Tata Maharashtra|IN|APNIC|20101008|Tata GSM|IN|APNIC|20110906
         ipv4|49.249.32.0/24|Tata GSM|IN|APNIC|20110906|Tata Maharashtra|IN|APNIC|20110926
         ipv4|49.249.32.0/24|Tata Maharashtra|IN|APNIC|20110926|Tata GSM|IN|APNIC|20120105

         ipv4|210.79.48.0/21|Image Centre Ltd|NZ|APNIC|20070919|Web Drive Limited|NZ|APNIC|20111128
         ipv4|210.79.48.0/21|Image Centre Ltd|NZ|APNIC|20111127|Web Drive Limited|NZ|APNIC|20111129
         ipv4|210.79.48.0/21|Image Centre Ltd|NZ|APNIC|20070919|Web Drive Limited|NZ|APNIC|20111129
Figure 6 – Extracts from the APNIC Transfer Log (2)
In some cases the original address block has been subsequently subdivided and apparently onsold. For example, the address block 39.96.0.0/12 (1,048,576 addresses) was allocated to the Chinese entity CNISP-Union Technology in April 2011, as part of final run to exhaustion of the general use IPv4 address blocks held by APNIC. This entity appears to have sold these addresses to Cloud-sense Technology of Hong Kong in October 2011. This entity subdivided the block into a number of smaller blocks between September 2014 and February 2015, and transferred smaller address blocks to So-net in Japan, Hayun Data holdings in Hong Kong, and Starhub in Singapore, and disposed of the remaining 851,968 addresses to Aliyun Computing Co in China in February 2015 (Figure 7)
APNIC Stats File Entry – June 1, 2011:
apnic|CN|ipv4|39.96.0.0|1048576|20110405|allocated|A915370F
APNIC Transfer Log – August 1, 2015:
         ipv4|39.96.0.0/12|CNISP-Union Technology|CN|APNIC|20110405|Cloud-Sense Technology|HK|APNIC|20111028

         ipv4|39.110.0.0/15|Cloud-Sense Technology|HK|APNIC|20110405|JPNIC/So-net|JP|APNIC|20140901

         ipv4|39.109.0.0/17|Cloud-Sense Technology|HK|APNIC|20110405|Huayun Data Holdings|HK|APNIC|20141120

         ipv4|39.109.128.0/17|Cloud-Sense Technology|HK|APNIC|20110405|Starhub Internet|SG|APNIC|20141223

         ipv4|39.104.0.0/14|Cloud-Sense Technology|HK|APNIC|20110405|CNIC/ALISOFT|CN|APNIC|20150210
         ipv4|39.108.0.0/17|Cloud-Sense Technology|HK|APNIC|20110405|CNIC/ALISOFT|CN|APNIC|20150210
         ipv4|39.108.128.0/17|Cloud-Sense Technology|HK|APNIC|20110405|CNIC/ALISOFT|CN|APNIC|20150210
         ipv4|39.96.0.0/13|Cloud-Sense Technology|HK|APNIC|20110405|CNIC/ALISOFT|CN|APNIC|20150210
Figure 7 – Extracts from the APNIC Stats Report and the APNIC Transfer Log (3)
The distribution of the size of transferred address blocks is shown in Figure 8. More than one half of all recorded transfers are 1,024 addresses (/22) or smaller.
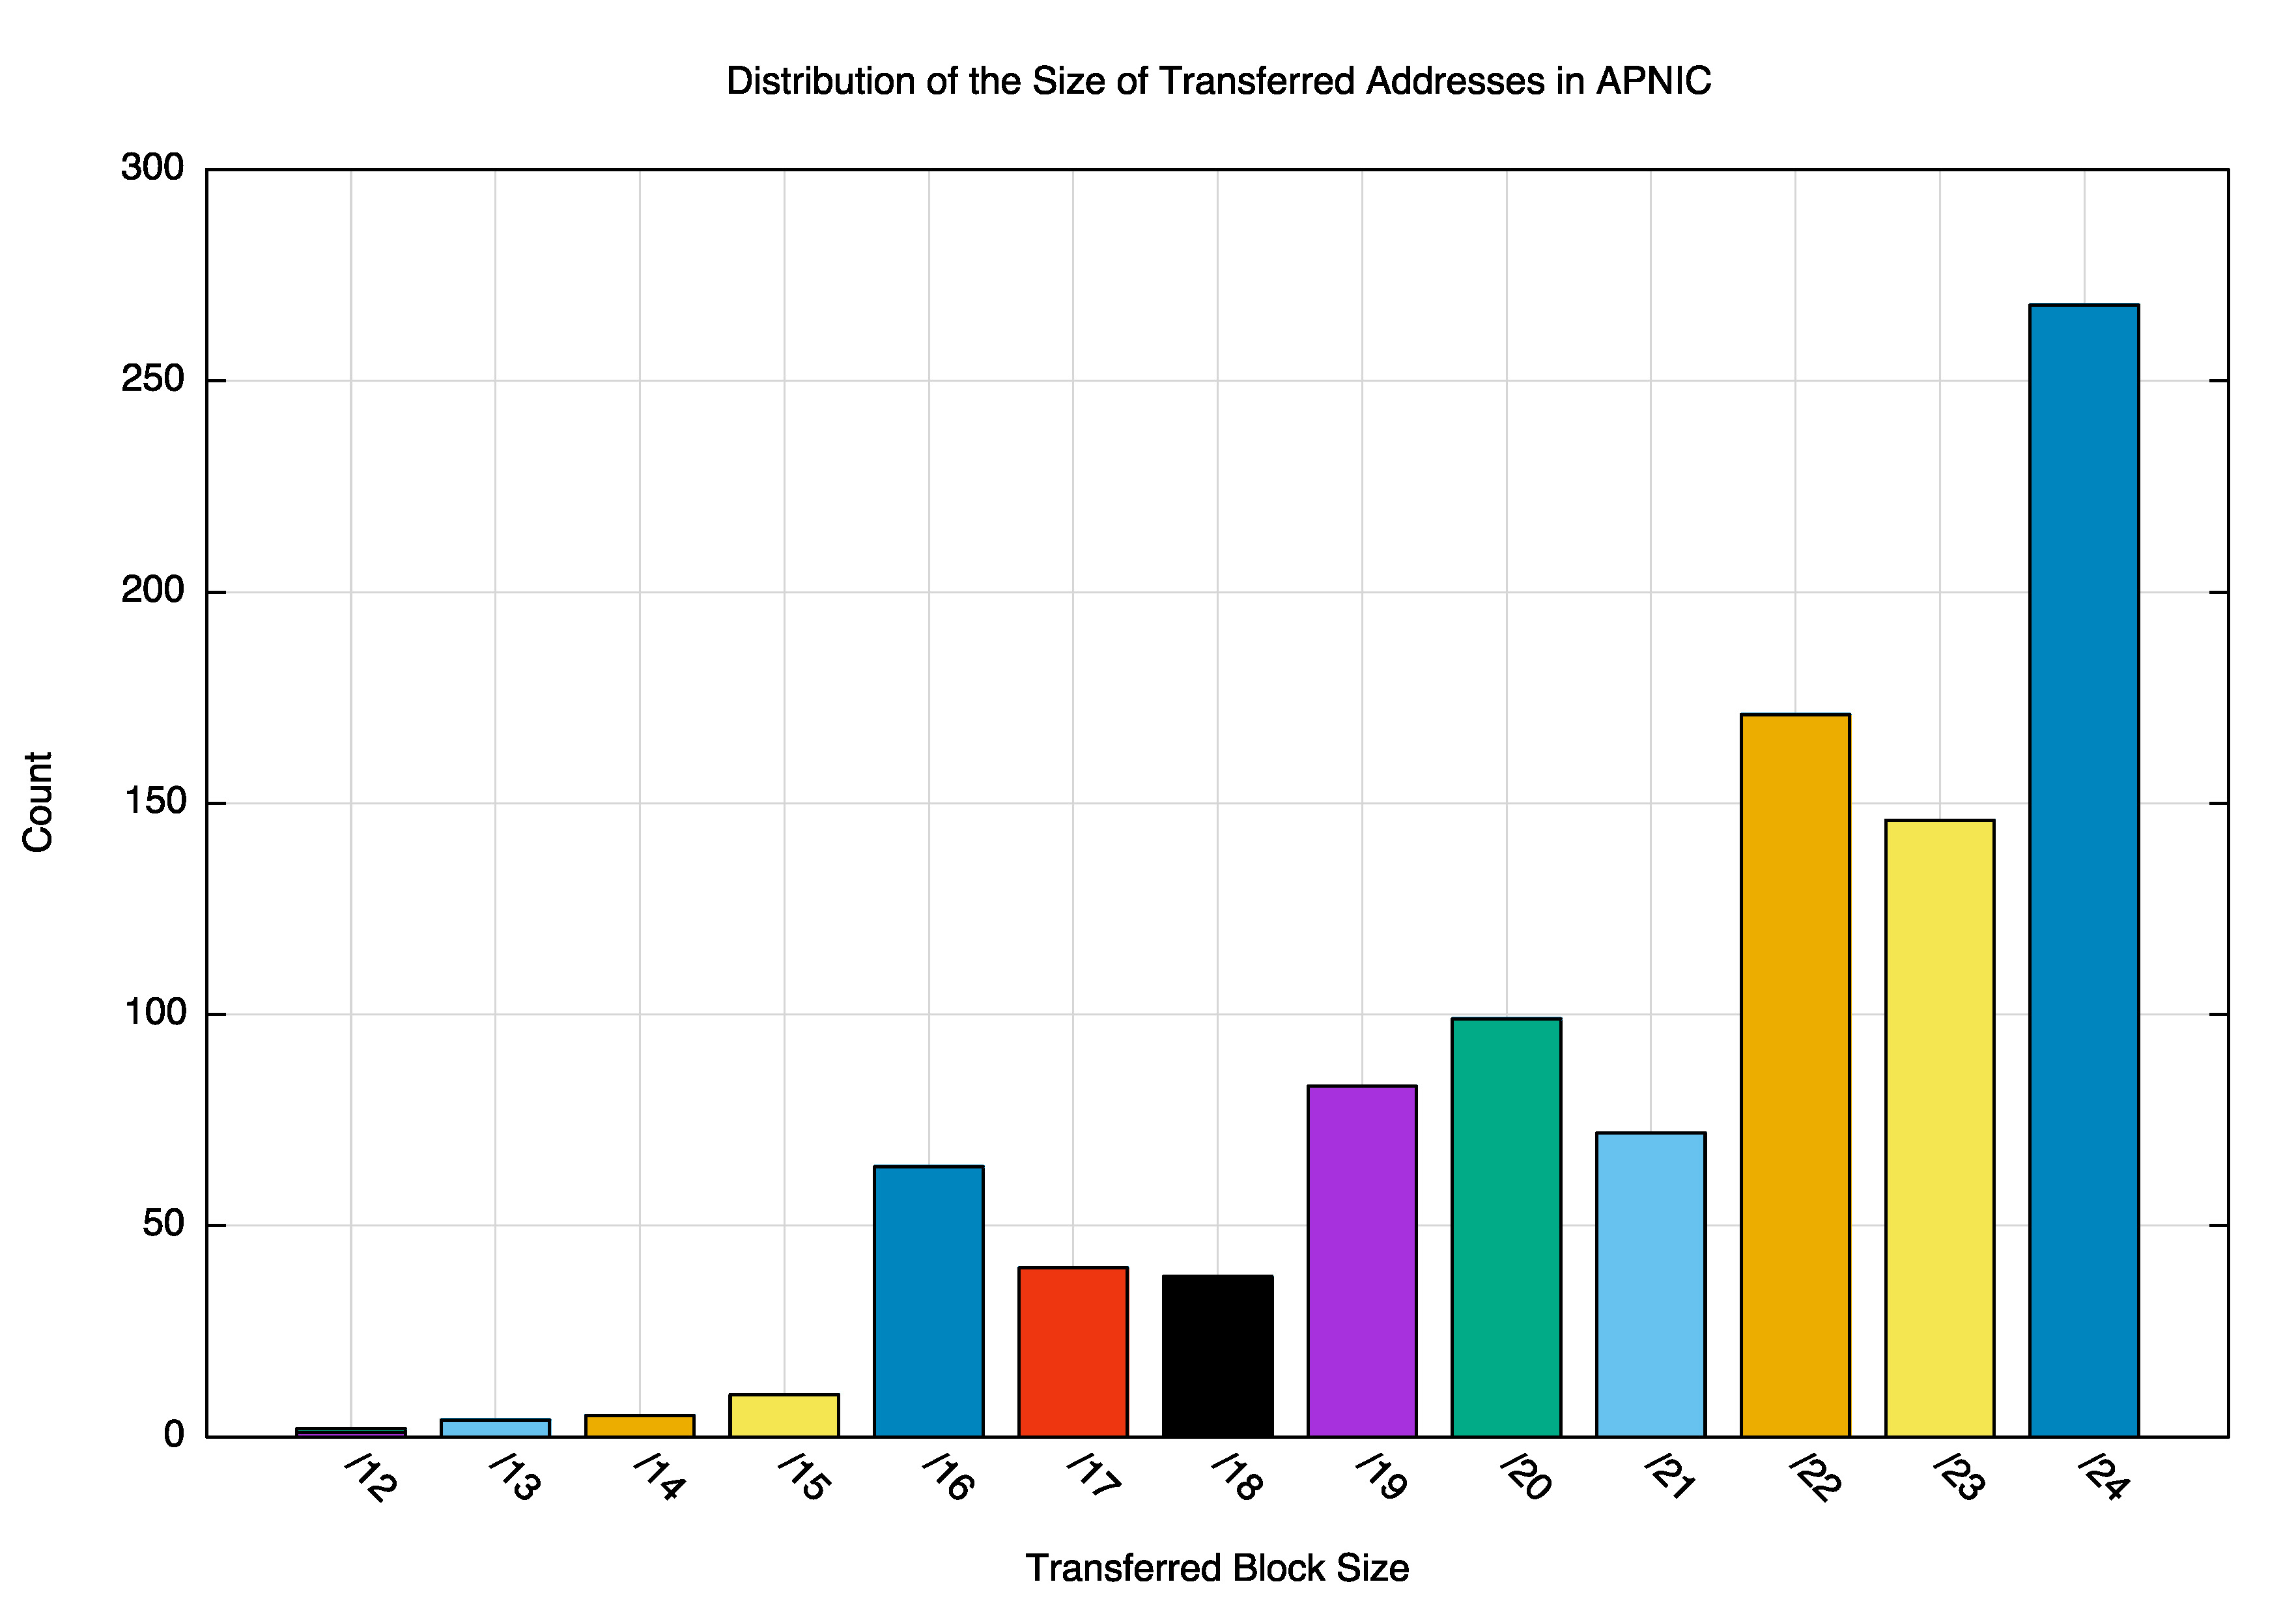
Figure 8 – Distribution of the size of Transferred Address Blocks
A slightly different distribution of transfer sizes is obtained if we group together transfers with a common source, destination and date. In this case there were 480 distinct transactions, and the comparable distribution of transfer sizes in each transaction is shown in Figure 9.
It appears that the most common transaction is a movement of the equivalent of a /22 (1,024 addresses), as well as the /19 – /20 range (4,096 – 8,192 addresses and the /16 size (65,536 addresses), It would be a reasonable assumption to believe that the address market is being used to meet an immediate requirement for IPv4 addresses, and that transferred addresses are being advertised in the public Internet as part of fulfilling this immediate need. There are 1,001 unique prefixes listed in the transfer registry, and just 187 of these prefixes are not visible in the public Internet’s routing table. From the perspective of prefixes, this appears to show that transferred addresses are being used predominately to meet immediate operational requirements. Translating this into addresses the story is somewhat different, as the transfer log lists some 12,371,712 IPv4 addresses and only 6,912,512, or slightly more than one half of transferred addresses are advertised in the routing system. However this implies that 5,459,200 addresses, or slightly less than one half of all transferred addresses are not immediately advertised in the Internet’s public routing system. This would support an interpretation that some the larger addresses transfers are being assembled into some form of strategic reserve rather than fulfilling an immediate need. The address pool that is being traded in this after market of registered transfers represent a relatively small proportion of the overall address pool administered by APNIC. These 12,317,712 addresses that are listed in the APNIC Transfer Log represent just 1.4% of the total address pool held in the APNIC registry (which holds some 875,936,768 IPv4 addresses, or approximately one fifth of the total IPv4 address space). The 596 entities who have bought or sold IPv4 address space represents some 5% of the total number of 11,319 entities who are registered as address space account holders in the Asia Pacific region. Will this grow in the coming years? Is the future of the address management function, for IPv4 at any rate, now inextricably tied to the operation of these aftermarkets in IPv4 addresses? As we look forward in the area of address markets and transfer registries, there are a number of factors at play here that will shape the future of this activity. The first factor is of course the momentum of deployment of IPv6. The recent large scale moves in the United States and Germany to deploy IPv6 have resulted in an influential pool of IPv6-capable content consumers, and the consequent momentum this is generating raises the question once more of how long this transition to IPv6 will take. It’s no longer completely insane to contemplate IPv6-only services on an Internet just two years from now. This means that in market terms we can contemplate a future time when the inherent value of an IPv4 address, as determined by the overhang of demand to supply, will join that of those all but defunct Appletalk, Wangnet and DECNET Phase IV addresses back at the zero point. In other words it is now reasonable to factor in the consideration that this IPv4 address market has a “use by†date – it will not be around forever. Another factor is the extent to which such markets are accepted by the community as a legitimate means of obtaining or disposing of IPv4 addresses. The reputation of the market for domain names has suffered in the past from various sharp practices by name speculators, and much of the regulatory effort the in the administration of the upper levels of the name space has been to try and forestall such speculative excesses. The emerging address market has some acceptance issues, and there is some concerns that an unregulated market would not only suffer from major distortions at a level comparable to that experienced by the silver market in 1980, but that the consequence would impair the operation of the Internet itself. The address market has to demonstrate that it is capable of operating in a manner that engenders confidence in its legitimacy and integrity. The more open the trading floor, the more open the price signals, the more open the buyers and sellers are when they are preparing trades, the more open the course of trades are in their reporting, then the better the prospects are for community acceptance of this activity. A related factor is the issue of to what extent the underlying activity of address markets are adequately captured by these Transfer Logs. For example, we continue to hear about “leasing†of addresses, where the original address registration details are kept constant, but the effective operational holder of the addresses is the lessee. There is no open registry of leases, so the rumination of the extent to which leasing takes place today remains squarely in the realm of speculation. The trading of some 12 million addresses at a notional current market value of around USD$10 per address points to a market place in the Asia Pacific region that has traded some USD$120 million in addresses. When placed into comparison with the musing of various economic pundits on the overall value of the Internet (such as the 2011 McKinsey report of the Internet’s “value†in 2009 being expressed as 3.4% of GDP in 13 nations, which was mapped to the worldwide equivalent of USD$1,672 billion value within the global economy ) then this address market represents a very small proportion of the Internet’s portfolio of economic value. It is a challenge to make the case that the conduct of this address market will exert a dominant influence on the future of the Internet, and certainly it pales into insignificance against the current set of issues related to security, personal privacy and eavesdropping, integrity and trust. But perhaps that view of address markets and addresses is being overly dismissive. While it is a relatively small scale activity, the importance of addresses in a digital communications network cannot be understated, and it remains a critical task to ensure that addresses maintain their essential attribute of uniqueness of tenure. What makes this network one coherent single communications realm and what prevents it from shattering into thousands of isolated communities that cannot communicate with each other, is the basic binding glue of coherent and consistent name and address spaces. That implies that we should ensure that the actions taken within the context of these emerging markets in addresses do not imperil the integrity and utility of addresses, and the best way we understand of how to achieve that is to ensure that we can operate accurate address registries that properly reflect exactly who has which IP address at all times.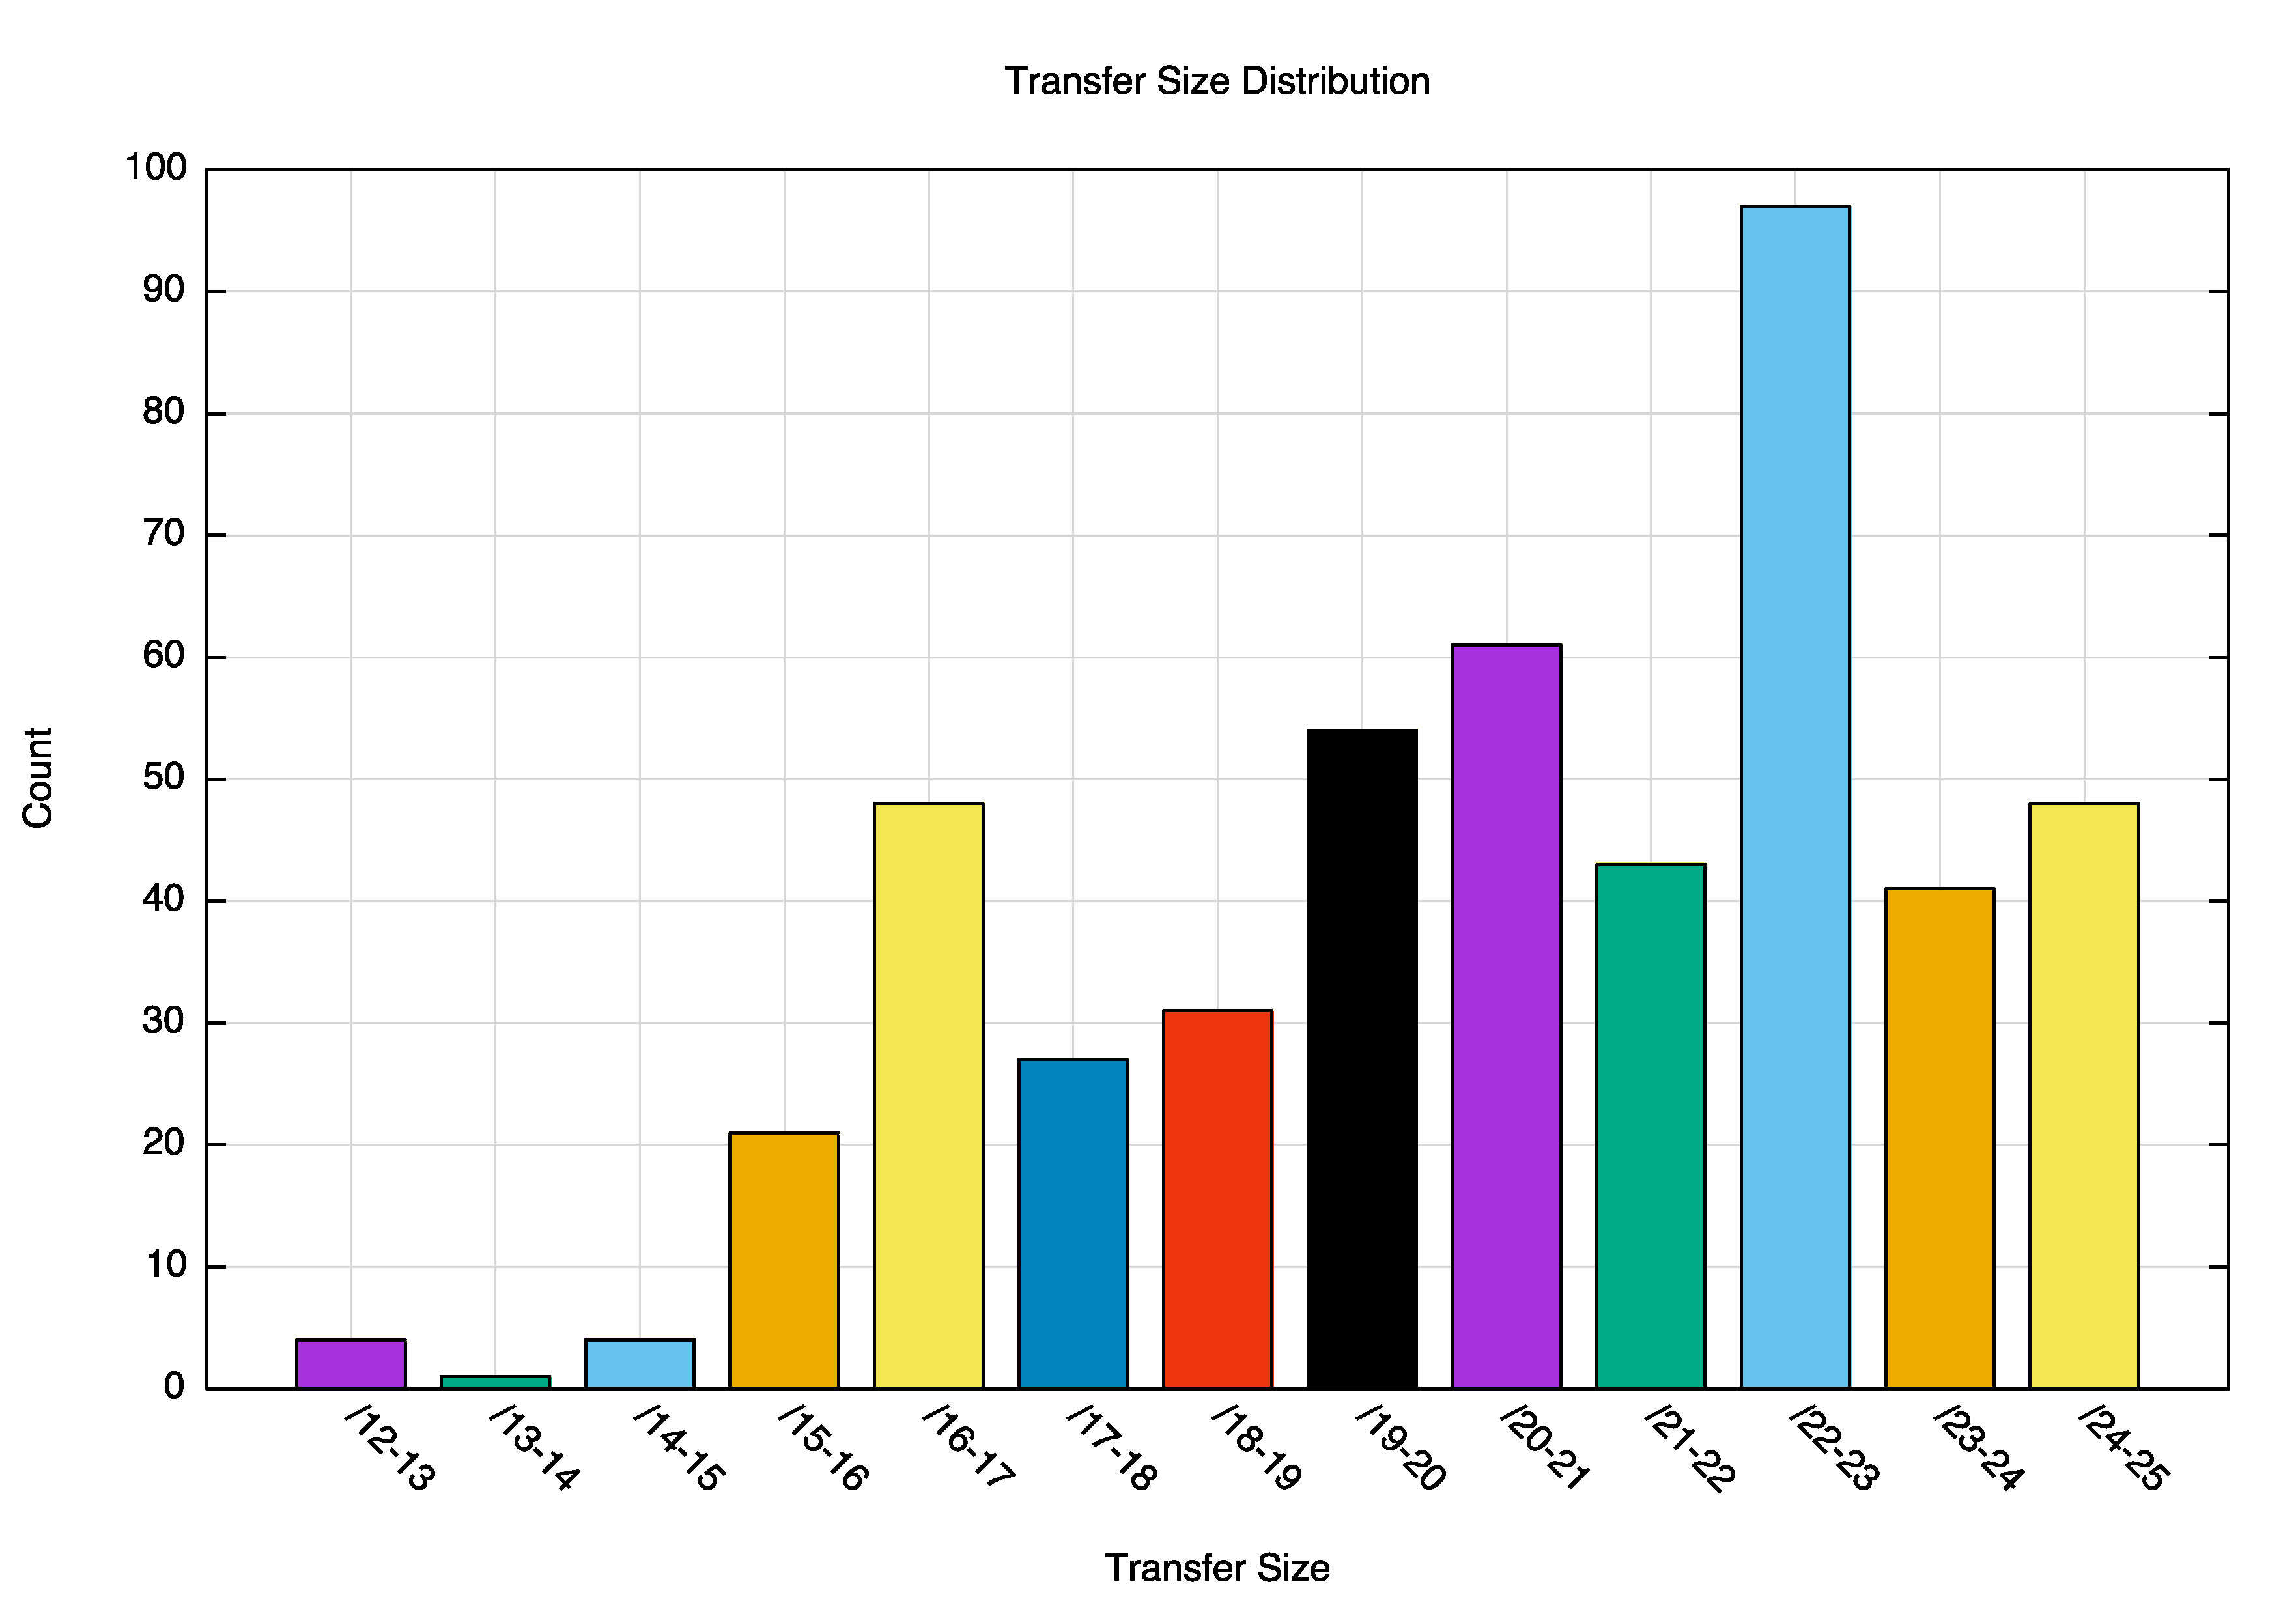
The Larger Picture of Address Transfer and Markets