This is the long version of the blog post. A shorter version is available here.
There is a graph I’ve been pondering for some time that illustrates the topic I’d like to look at in this article.
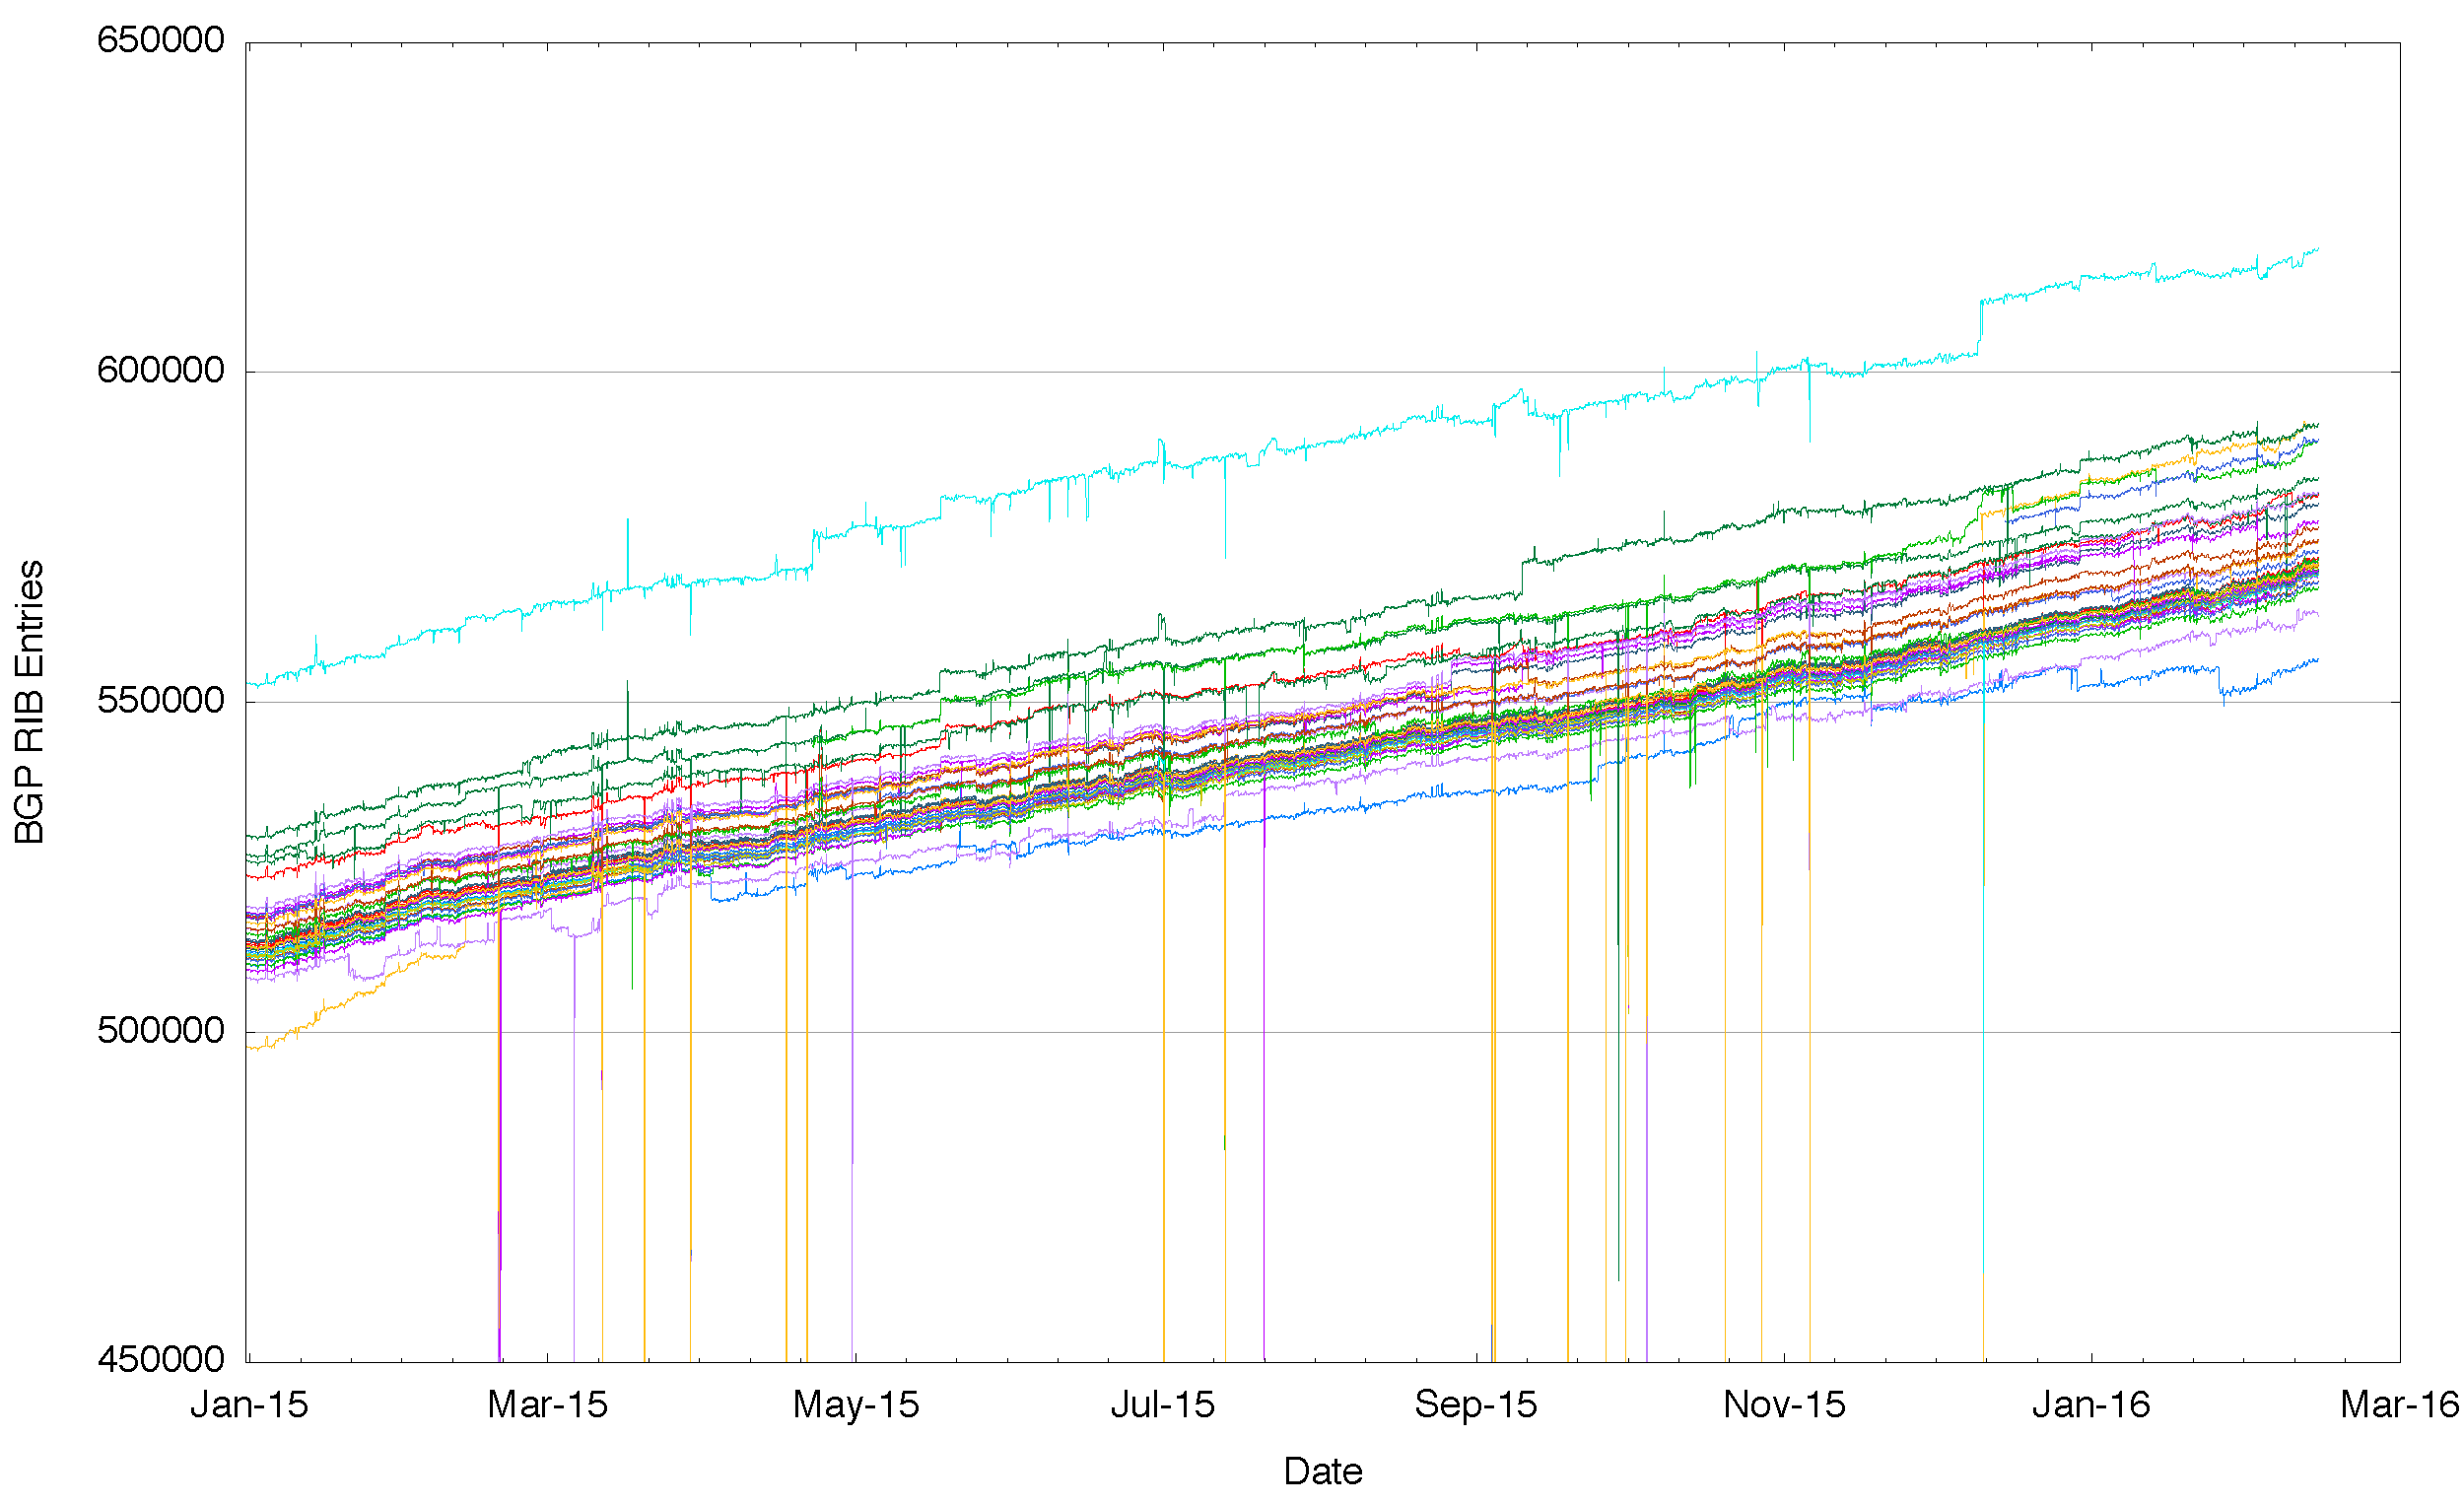
Figure 1 – Number of Routes announced by each BGP peer of Route Views for 2015
There are a number of “route collectors†that gather up the inter-domain routing perspective from a number of distinct vantage points across the Internet. Figure 1 shows a plot of the number of routing entries seen in a daily snapshot from each peer of one of the Route Views servers. Each separate line in this plot is the number of route objects being passed to the Route Views server from one of its routing peers.
There are a number of servers that take in a number of BGP vantage points and publish the union of all these individual streams of routing information. In this article I’m using data pulled from the Route Views Project, as the collections are a useful size and readily traversed by scripts. The RIPE NCC also runs a set of route collectors in their Routing Information Service (RIS), which contains a large set of route snapshots and BGP updates.
What this plot is showing is that the perspectives of the Internet’s routing system are slightly different for each routing peer of Route Views. Surely if the Internet were to be a single coherent domain of connectivity, and if everyone could uniformly reach everyone else somehow, then wouldn’t we expect that the routing system, the system that ultimately ensures that everyone is connected to everyone else, to be much the same everywhere? And if that were the case, and routing would provide much the same view of the Internet irrespective of the particular vantage point of the BGP speakere. The consequence would be that instead of seeing in Figure 1 some 40 different tracks for the year, one from each distinct routing vantage point, we should see the same single line, drawn over 40 times.
But what this figure shows us is that each of these routing vantage points sees a slightly different Internet from their perspective. And these differences are not just temporary. Across all of 2015 these various routing vantage points see a consistently different number of route objects in their local routing system. So its not something that occured at a particular point in time and corrected via the normal operation of the routing protocol. These differences are consistent across the entire year. Some route advertisements are simply not visible from some routing vantage points. Part of the reason why we operate these routen collectors is to gather these various perspectives and understand these differences, so I’d like to look into these differences in a little more detail and see if we can conclude anything about Internet connectivity.
It might be possible to say that these differences have occured as some property of size and age, and that the venerable IPv4 Internet has these divergent routing views solely due to its age and size. So a “younger†and smaller routing system may well show a single view by that reasoning. The second figure to condsider that of the IPv6 network over 2015. Rather than some 600,000 entries there are just 20,000. And still we see that some BGP speakers see more routes and others see less, and this is persistent and stable across the entire year.
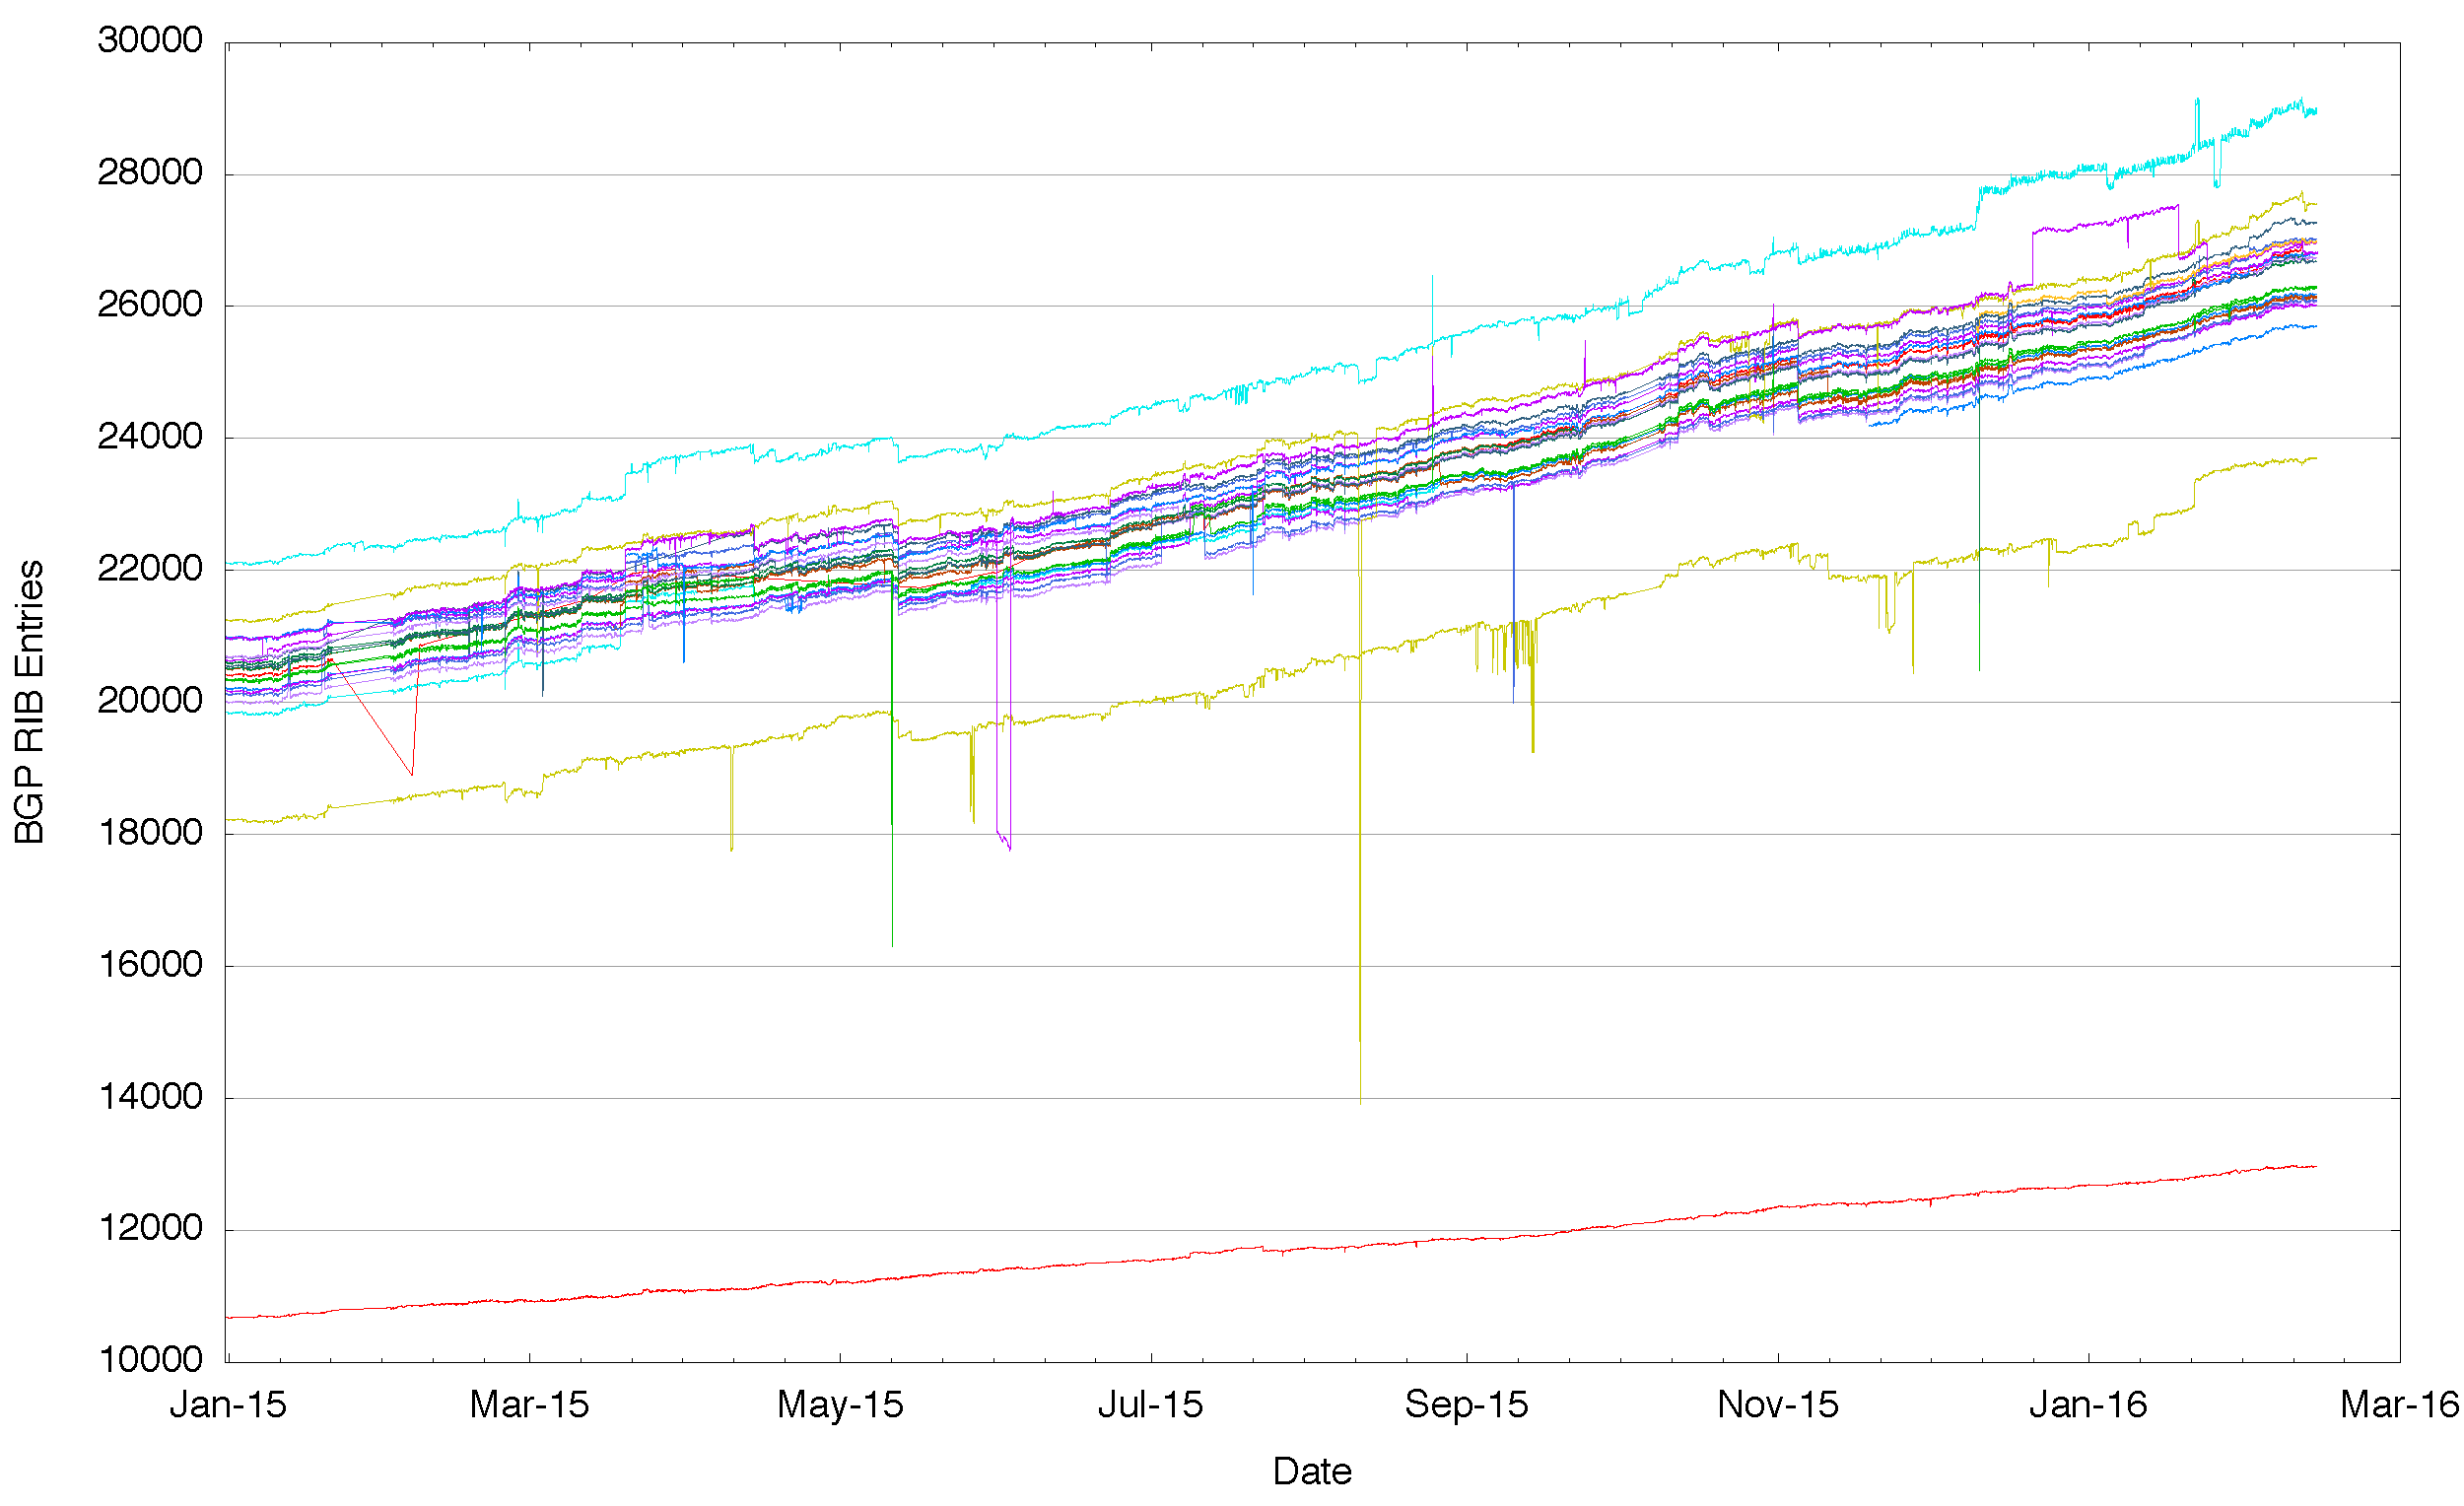
Figure 2 – Number of IPv6 Routes announced by each BGP peer of Route Views for 2015
What do these differences mean? Are we seeing evidence of a fragmented Internet where some places on the Internet cannot reach other places? Are these differences in the perspectives of various routing vantage points signs of underlying fractures of the fabric of connectivity in the Internet?
Before leaping to conclusions here, it’s useful to pull together some further data. One possible explanation of the difference in the number of advertised routes is that the routing system contains two components of information: basic reachability and information relating to the policy of how to reach a destination. With a broad brush one could call this latter set of routes “traffic engineering†advertisements. They do not change the overall set of addresses that are announced as reachable in the routing system, but qualify some of this information with refinements on how to reach a particular address. One half of the 600,000 entries in the IPv4 routing system announce “reachability†as aggregate announcements, or “root†routing prefixes. The other half qualify some of these basic reachability entries by refining this reachability by proposing subtly different paths (or not!) to take to reach the destination. So it may be that the differences seen from each of these vantage points are not in fact differences in basic connectivity – but the represent differences in these more specific announcements, and they represent that in different parts of the network there may be different preferred ways to reach certain destinations.
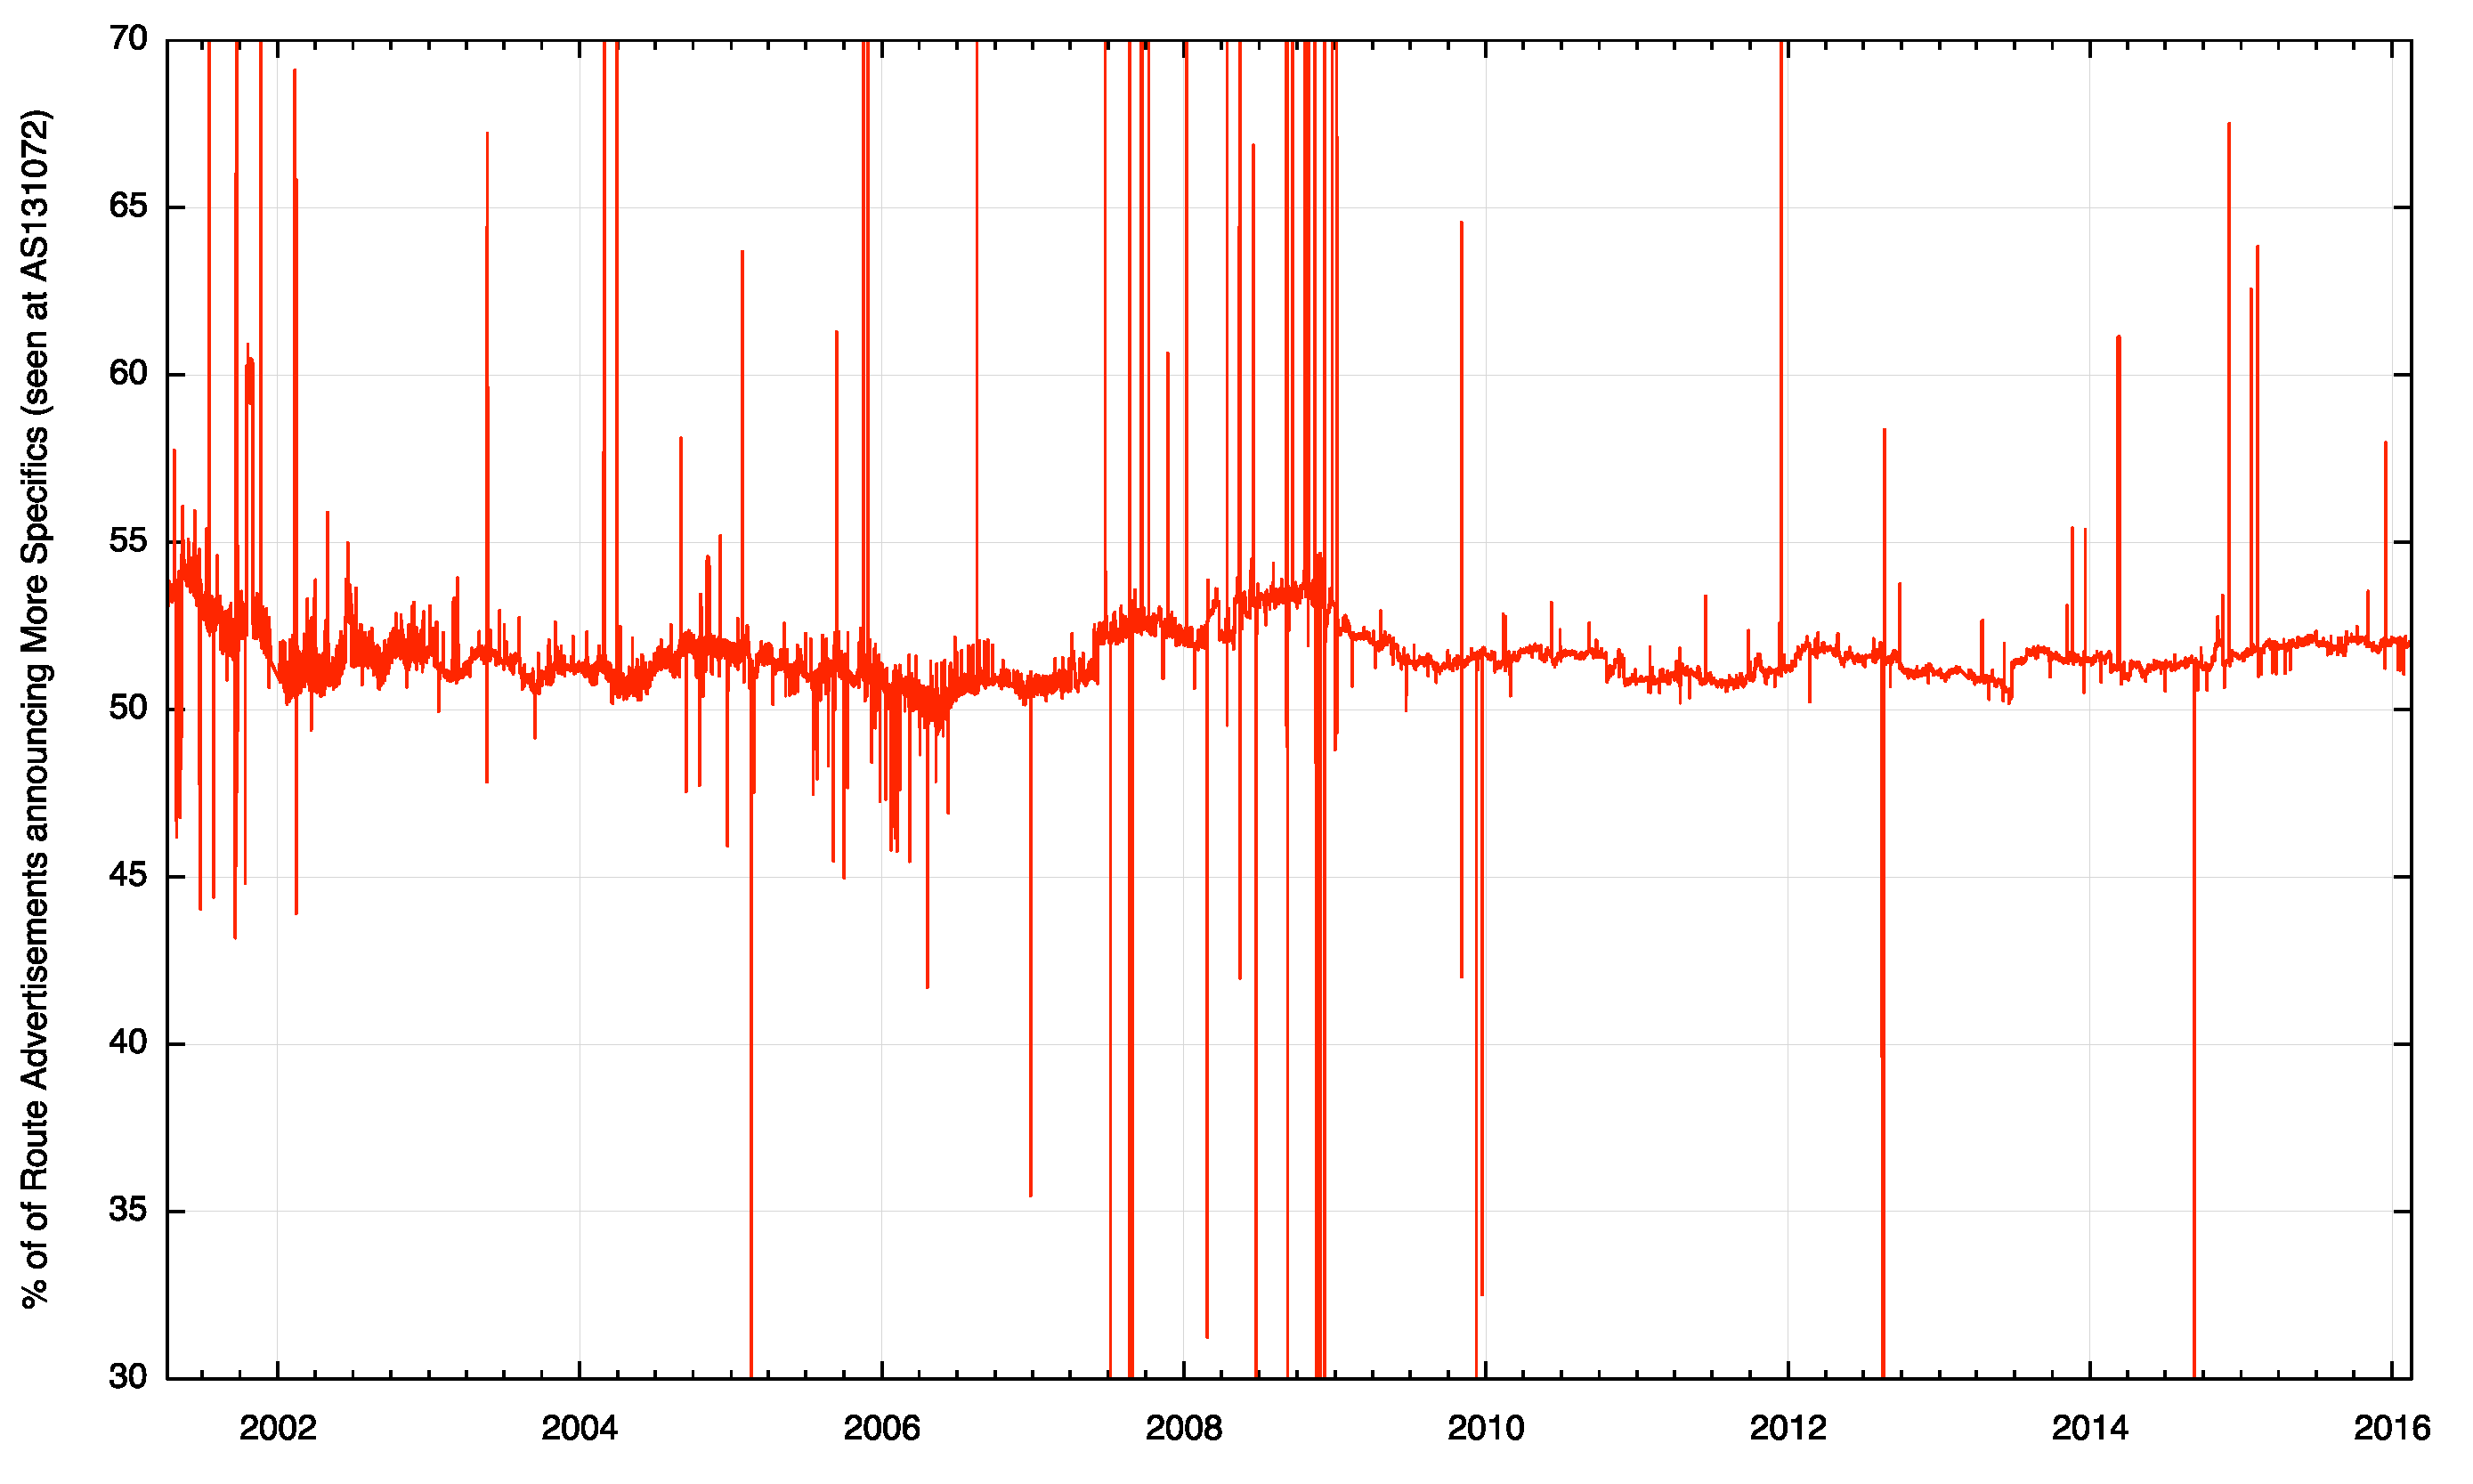
Figure 3 – Proportion of the routing system announcing More Specific Routers, as seen at AS131072
The difference in the number of routing entries as seen at each particular vantage point could be explained by observing that the efforts to exert fine-grained control over the particular paths taken by inter-domain traffic through the advertising of more specific routes are intentionally localized to some extent. The propagation of these traffic engineering prefixes is similarly intentionally localised to a particular locale or region. The conclusion therefore could well be that the variance in the number of routing objects seen at each of these routing vantage points in both the IPv4 and IPv6 networks is not due to any fundamental difference in the reachability of any addresses, but simply due to the desire to exert some additional control over the paths taken by traffic.
One way to test the validity of this conclusion is to look once more at the route collector data, but this time instead of looking at the number of route objects that are visible at each routing vantage point, lets look at the total span of addresses that are advertised as reachable. If this theory is correct then the total span of addresses should be the same from each of these vantage points and we could well be justified in believing that the Internet is indeed a uniform domain of connectivity.
Again the data does not agree with this theory – when we look at the data (Figure 4) we see that there is a range of some 5 million addresses in IPv4 where some vantage points see a larger set of addresses advertised as reachable than other vantage points. And again there is a consistency across the year: those peers that see a larger span of addresses than others appear to do so consistently across the entire year. And again, with three exceptions, those that advertise a lower span of addresses do so consistently across the entire period. The exceptions show one trend of approaching a route span that get closer to the group, while the other two peers are announcing a span that appears to be shrinking over the year.
In IPv6 we see the same situation, where different vantage points see a different span of addresses. In IPv6 there are large scale differences, so that at the extremes one routing peer sees one half of the total address span of the peer announcing the largest range (Figure 5). The difference is here is an outlier that is not seeing the same address span to the extent that they are not advertising to Route Views a /16 route that all other peers are advertising. The explanation is, this case, easily found: there is only one /16 advertisement in the IPv6 world, which is 2002::/16, the advertisement of the anycast 6to4 tunnel ingress fot the 6to4 tunnelling transition technology. It may be that this network is not operating a 6to4 gateway, or, more likely, they havce elected to run a local 6to4 relay and have restricted its advertisement to a mimited local which does not onluce their peer session with Route Views.
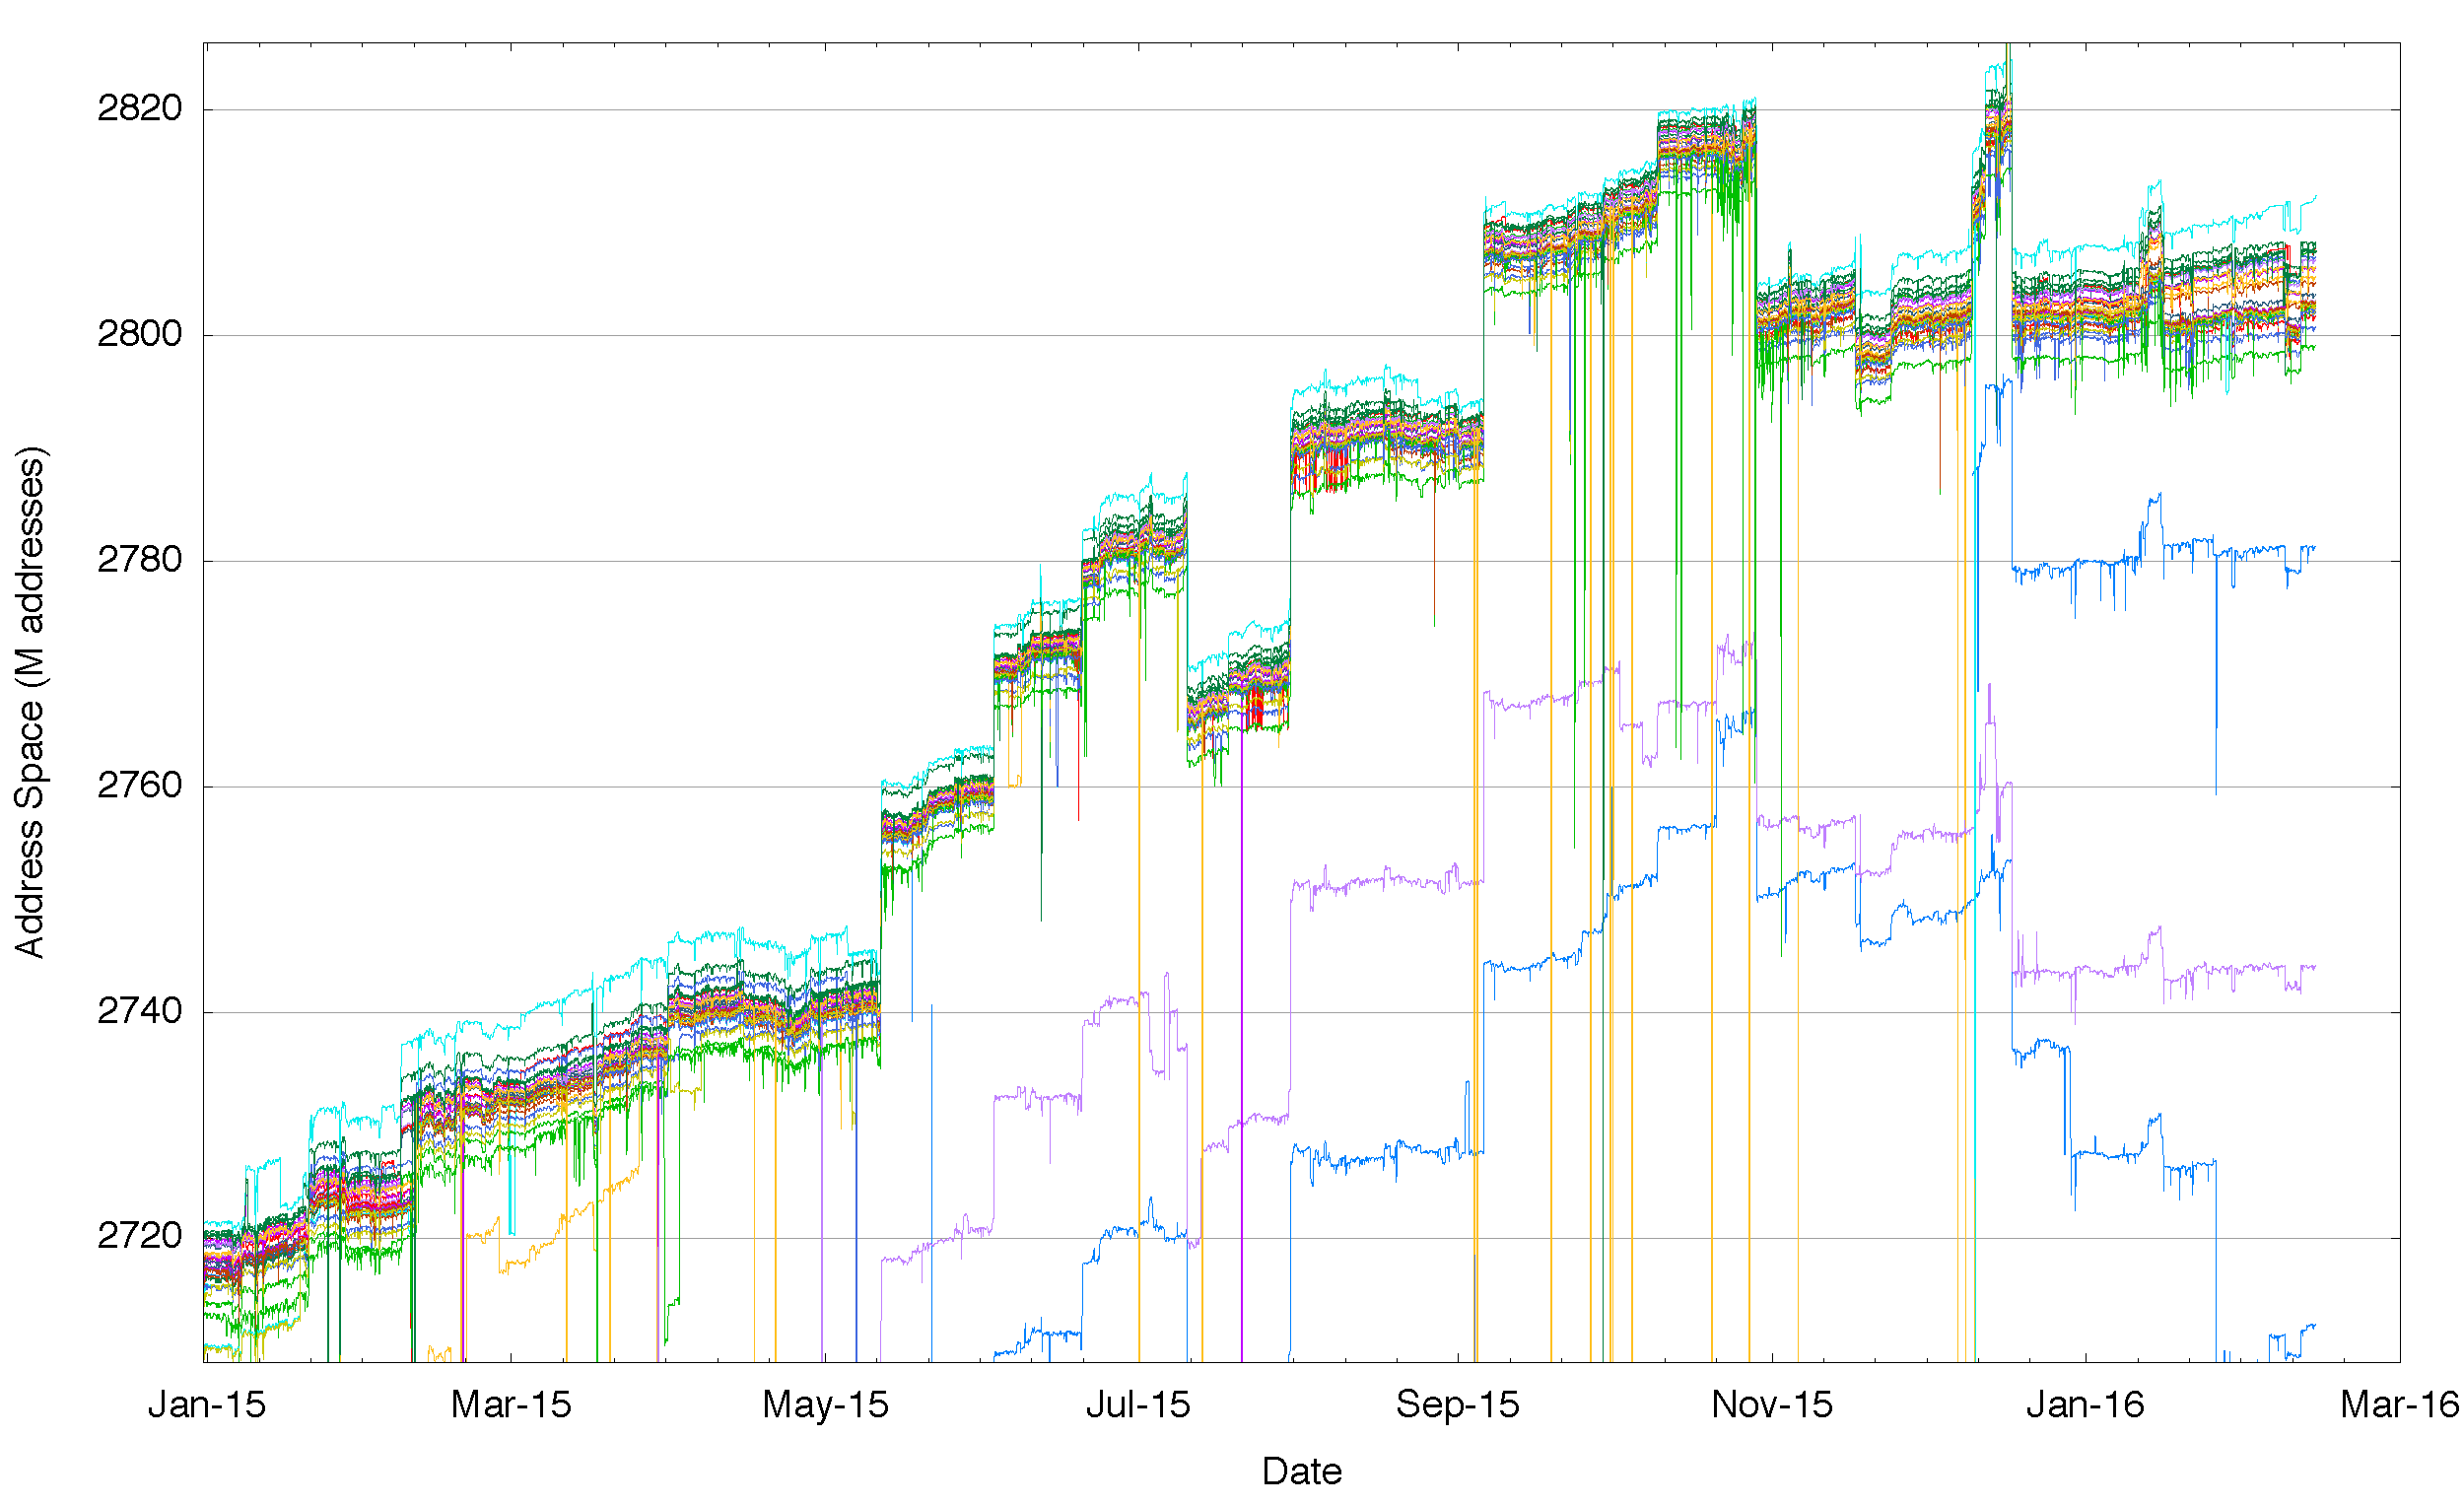
Figure 4 – Aggregate span of reachable IPv4 addresses announced by each BGP peer of Route Views for 2015
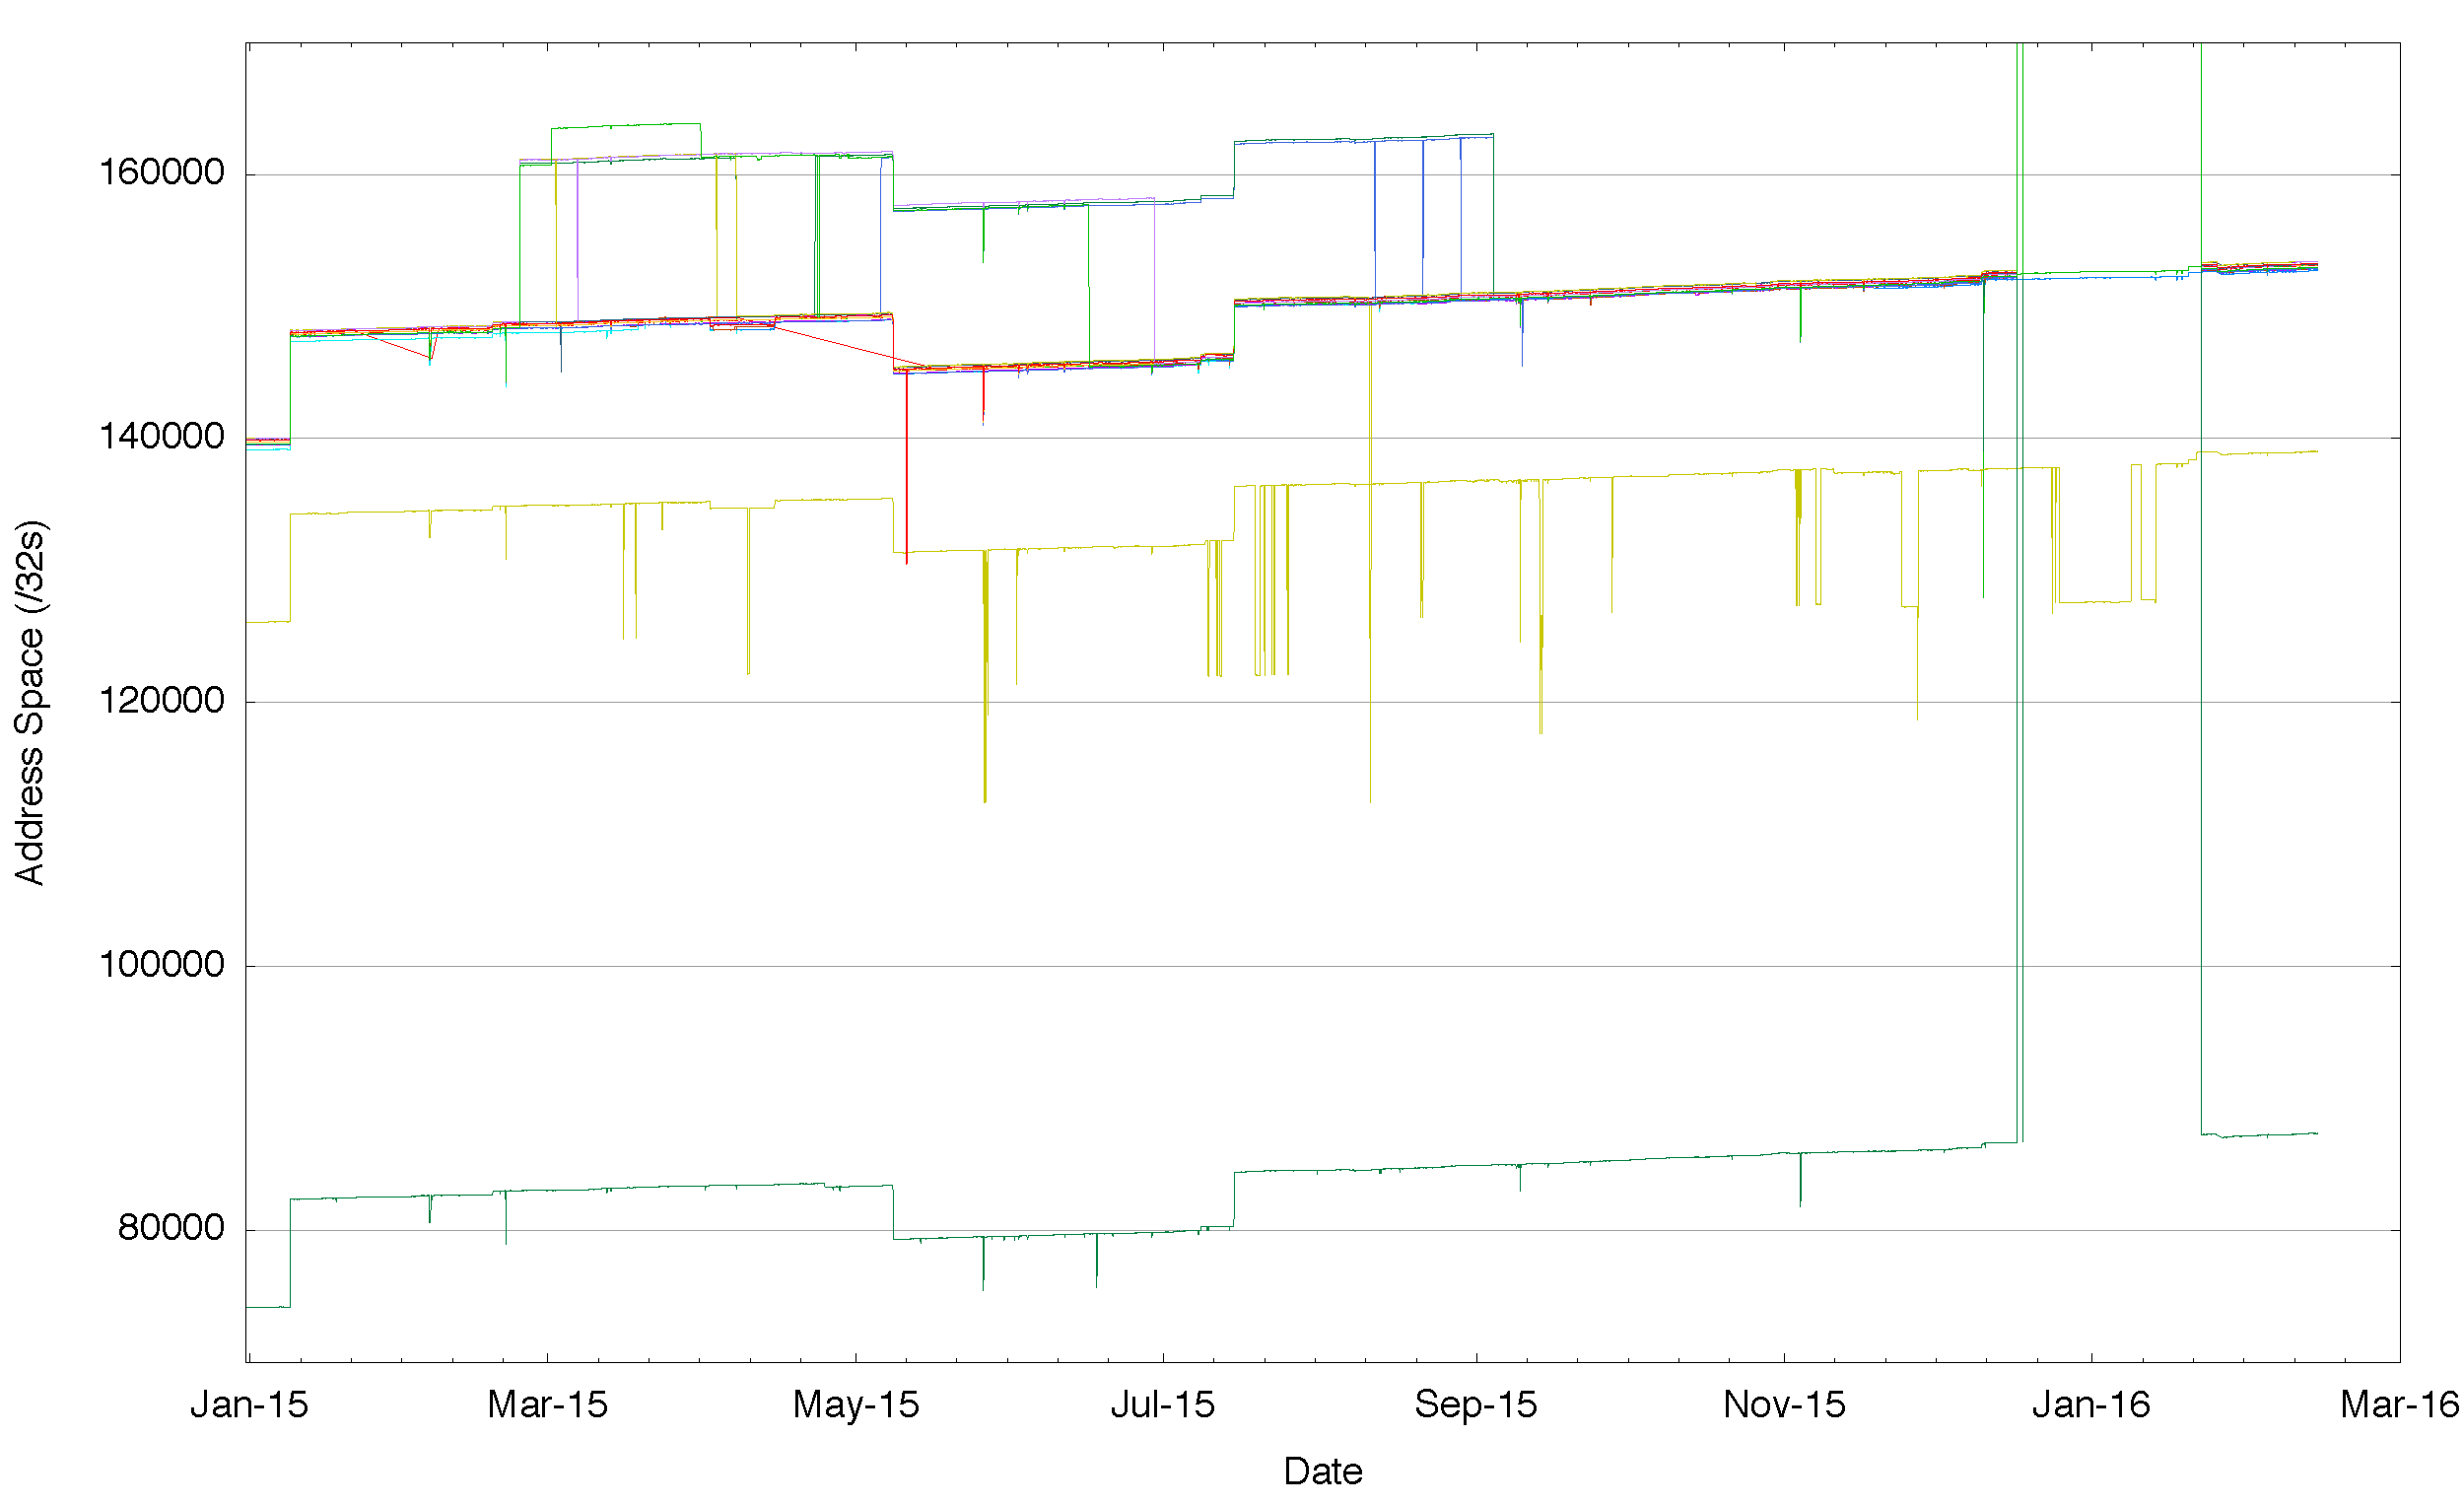
Figure 5 – Aggregate span of reachable IPv6 addresses announced by each BGP peer of Route Views for 2015
Figure 5 tends to suggest that IPv6 is showing a tight ‘cluster†of address reachability and in this respect is perhaps better than the equivalent picture in the IPv4 Internet However, this is not a good reflection of the IPv6 Internet. When we look at just this central cluster (Figure 6) its clear that like IPv4 there is a variance, and some networks see up to 600 more /32s than others, encompassing a range of address reacahability of a /23 in address terms.
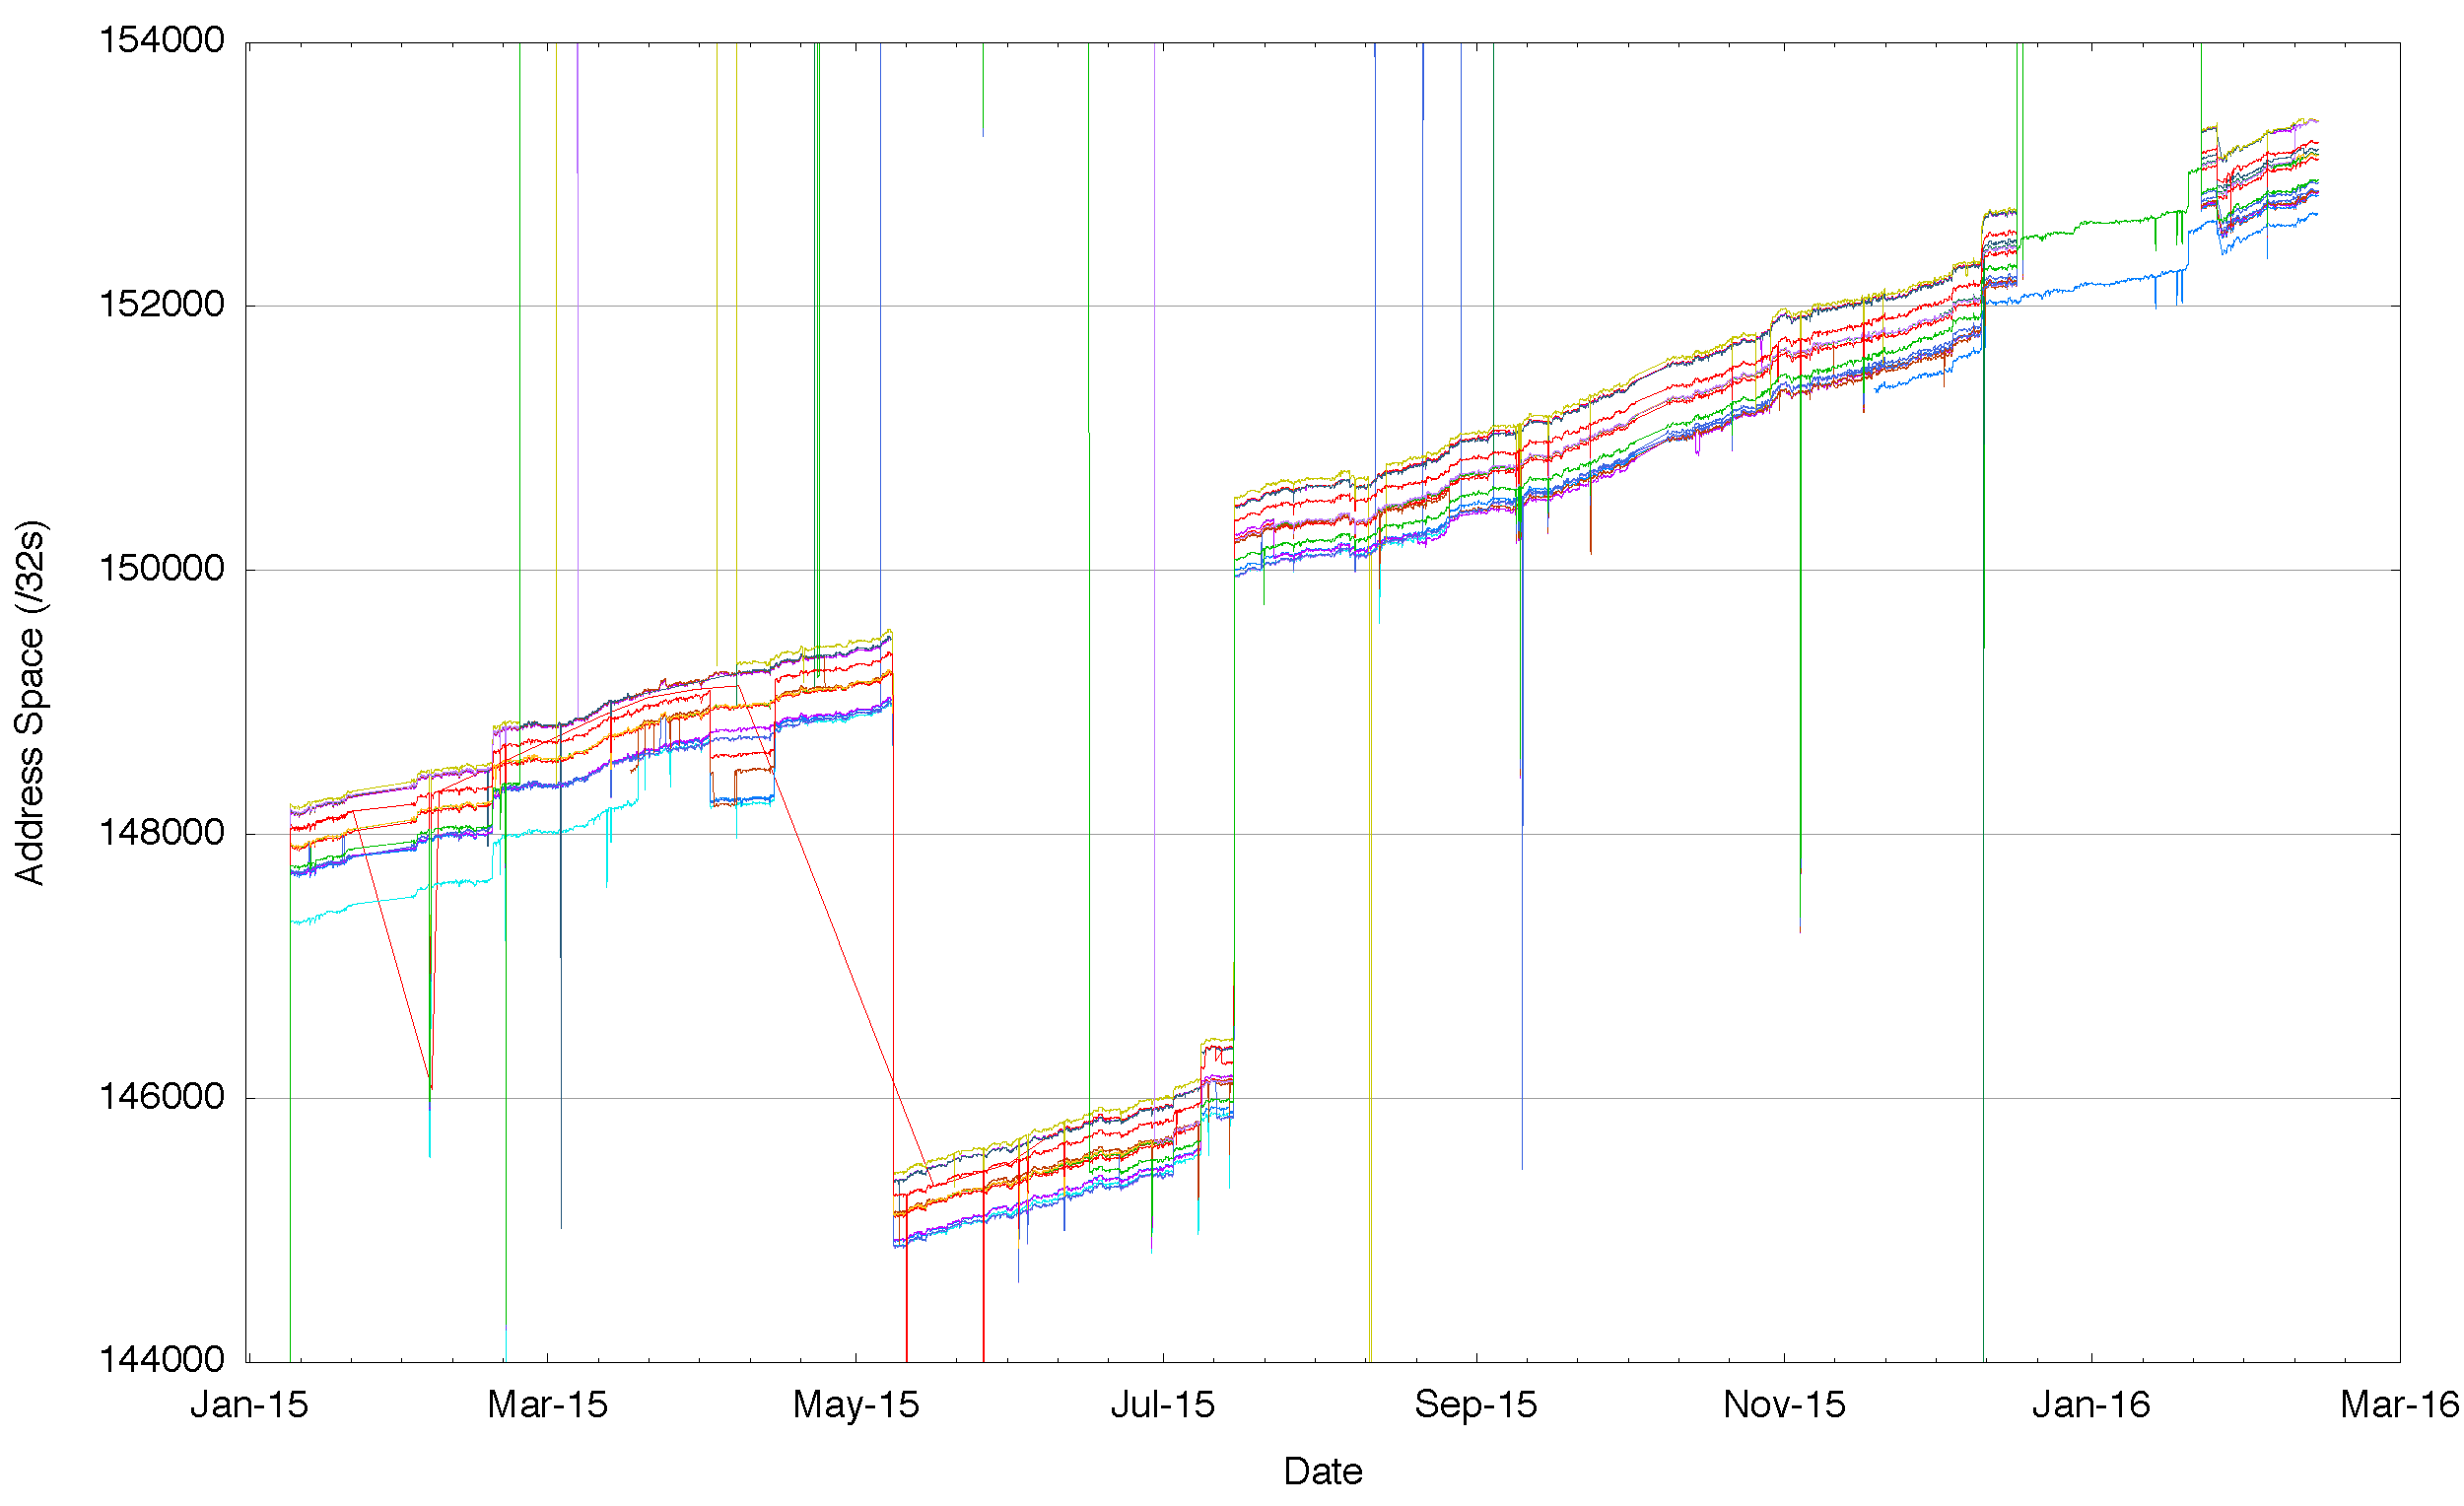
Figure 6 – Detail of Aggregate span of reachable IPv6 addresses announced by each BGP peer of Route Views for 2015
Let’s keep drilling down in this space for one further level of detail. One way to examine this is to define a “core†of announced prefixes. Firstly, lets select those peers that advertise a minimum of 85% of the average number of advertised routes, so as to eliminate from consideration those peers that only provide a partial route set to route views. Then we’ll use a threshold of 5/8 of the remaining peer set, or 62.5% to define a “quorumâ€. If 5/8 (or more) peers announce an address prefix, then we can include this prefix in a quorum set of announced routes. We can then take the set of “root†quorum prefixes and define a quorum span of addresses, which we can then use to compare against each peer that is announcing a route table to Route Views. What we are interested in is the extent to which individual peers announce a greater span of addresses that can be seen in the quorum set, and, by the same token the total span of addresses that exist in the quorate set, but are not explicitly announced by the peer. For example, Telstra in Austalia (AS1221) announced an address span of the equivalent of 166.06 /8s from the quorum set. Some 14 million IPv4 addresses that form part of the quorum set were not announced by AS1221, and this network also included a further set of 199,552 advertised addresses that were not part of the quorum set.
The complete analysis of all peers from a Route Views BGP snapshot taken on the 17th February 2016 is shown in Table 1. It’s evident from this table that nobody sees the same set of addresses as anyone else, and the degree of variance can be quite high.
| Route Views IPv4 Peers | |||||
| Peers: | 40 | ||||
| Quorum: | 25 | ||||
| Announcements: | 618,124 | ||||
| Quorum-Announcements: | 570,372 | ||||
| Span: | 167.48 (/8s) | ||||
| Quorum Span | 166.90 (/8s) | ||||
| AS | # Objects | Quorum (/8s) | Missing /32s | Additional /32s | AS Name |
| AS286 | 570,258 | 166.89 | 279,808 | 416,656 | KPN KPN B.V., NL |
| AS293 | 581,940 | 166.79 | 2,002,432 | 4,471,122 | ESNET – ESnet, US |
| AS852 | 571,209 | 166.59 | 5,376,256 | 325,632 | TELUS Comms, CA |
| AS1221 | 571,660 | 166.06 | 14,228,736 | 199,552 | Telstra, AU |
| AS1239 | 568,202 | 166.02 | 14,801,192 | 0 | SPRINTLINK – Sprint, US |
| AS1299 | 563,988 | 163.38 | 59,226,624 | 66,048 | TELIANET TeliaSonera AB, SE |
| AS1668 | 569,862 | 166.61 | 4,953,856 | 39,168 | AOL Transit Data Network, US |
| AS2152 | 571,882 | 166.74 | 2,842,112 | 1,123,584 | CSUNET-NW, US |
| AS2497 | 577,689 | 166.39 | 8,639,232 | 4,958,976 | Internet Initiative Japan, JP |
| AS2914 | 569,261 | 166.46 | 7,479,608 | 4,992 | NTT America, Inc., US |
| AS3130 | 570,348 | 166.89 | 290,560 | 9,600 | RG-BIWA – RGnet, LLC, US |
| AS3257 | 569,221 | 166.83 | 1,264,608 | 54,016 | TINET-BACKBONE, DE |
| AS3277 | 581,618 | 166.83 | 1,194,240 | 5,018,144 | RUSNET-AS NPO RUSnet, RU |
| AS3303 | 571,302 | 166.66 | 4,088,064 | 310,784 | SWISSCOM, CH |
| AS3356 | 566,679 | 164.14 | 46,459,904 | 1,792 | Level 3 Communications, US |
| AS3549 | 569,244 | 166.77 | 2,337,216 | 72,448 | Level 3 Communications, US |
| AS3561 | 569,285 | 166.37 | 8,959,232 | 1,536 | Savvis, US |
| AS3741 | 571,241 | 166.62 | 4,758,528 | 304,640 | IS, ZA |
| AS5413 | 570,940 | 166.85 | 852,480 | 182,816 | Daisy Communications Ltd, GB |
| AS6539 | 574,633 | 166.88 | 438,784 | 100,864 | GT-BELL – Bell Canada, CA |
| AS6762 | 571,435 | 166.88 | 478,464 | 12,032 | SEABONE-NET, IT |
| AS6939 | 580,094 | 166.77 | 2,348,800 | 3,721,728 | Hurricane Electric, US |
| AS7018 | 567,633 | 162.44 | 74,979,328 | 45,056 | AT&T Services, US |
| AS7660 | 556,519 | 161.39 | 92,543,856 | 1,421,960 | AsiaPac Advanced Network, JP |
| AS8492 | 581,296 | 166.84 | 1,122,048 | 4,744,960 | OBIT-AS OBIT Ltd., RU |
| AS11686 | 573,309 | 166.76 | 2,376,952 | 1,081,856 | Education Networks, US |
| AS13030 | 569,627 | 166.84 | 1,078,016 | 2,768,397 | INIT7, CH |
| AS20771 | 589,700 | 166.79 | 1,871,360 | 4,280,576 | Caucasus Online, GE |
| AS20912 | 576,857 | 166.77 | 2,221,822 | 2,743,621 | Panservice, IT |
| AS22652 | 574,852 | 166.89 | 241,664 | 342,272 | Fibrenoire, CA |
| AS23673 | 584,638 | 166.48 | 7,168,256 | 11,248,384 | Cogetel Online, KH |
| AS37100 | 574,864 | 166.66 | 4,088,576 | 4,175,104 | SEACOM-AS, MU |
| AS40191 | 571,528 | 166.90 | 40,448 | 163,200 | AS-PRE2POST-1, CA |
| AS47872 | 592,253 | 166.82 | 1,391,360 | 4,277,664 | SOFIA CONNECT EOOD, BG |
| AS53364 | 570,002 | 166.87 | 587,264 | 54,016 | AS-PRE2POST-2, US |
| AS58511 | 589,579 | 166.82 | 1,500,822 | 6,139,973 | Connectivity IT, AU |
| AS62567 | 570,671 | 166.90 | 104,448 | 111,104 | ASN-NY2 – Digital Ocean, US |
| AS200130 | 571,269 | 166.86 | 772,096 | 2,549,760 | ASN-1 Digital Ocean, EU |
| AS202018 | 570,636 | 166.90 | 72,704 | 103,936 | ASN-3 Digital Ocean, NL |
| AS393406 | 570,588 | 166.89 | 187,648 | 116,736 | NY3 – Digital Ocean, US |
Table 1 – Route Views per-peer view of the IPv4 routing table, 17 February 2016
Table 2 shows a similar report for IPv6. Again its evident that there is no single view here. Some peers have little in the way of addresses over the quorate set, while others are seeing some additional 120 – 130 /32s. The picture of missing addresses is also a mixed one with some peers reporting little in the way of missing data, while others are not seeing a somewhat larger address set.
| Route Views IPv6 Peers – Address Spans are show in units of /32s | |||||
| Peers: | 24 | ||||
| Quorum: | 15 | ||||
| Announcements: | 28,935 | ||||
| Quorum-Announcements: | 26,232 | ||||
| Span: | 87,688 | ||||
| Quorum Span | 87,468 | ||||
| AS | # Objects | Quorum | Missing /32s | Additional /32s | AS Name |
| AS33437 | 26,013 | 87,194 | 275 | 120 | HOTNIC – Hotnic LLC, US |
| AS2914 | 26,144 | 87,296 | 174 | 2 | NTT America, Inc., US |
| AS47872 | 27,037 | 87,466 | 4 | 123 | SOFIA-CONNECT, BG |
| AS3277 | 27,699 | 87,467 | 3 | 170 | RUSNET-AS NPO RUSnet, RU |
| AS1239 | 25,694 | 87,155 | 314 | 1 | SPRINTLINK – Sprint, US |
| AS30071 | 23,696 | 73,520 | 13,949 | 4 | OCCAID, US |
| AS20912 | 26,666 | 87,466 | 4 | 126 | Panservice, IT |
| AS37100 | 26,199 | 87,412 | 58 | 6 | SEACOM-AS, MU |
| AS31019 | 26,730 | 87,459 | 11 | 160 | MEANIE, NL |
| AS701 | 25,989 | 87,025 | 445 | 1 | Verizon Business, US |
| AS200130 | 26,609 | 87,467 | 3 | 129 | Digital Ocean, EU |
| AS7018 | 26,127 | 87,019 | 451 | 3 | AT&T Services, US |
| AS202018 | 26,608 | 87,467 | 3 | 121 | Digital Ocean,NL |
| AS393406 | 26,608 | 87,467 | 3 | 121 | Digital Ocean, US |
| AS3257 | 26,006 | 87,299 | 171 | 1 | Tinet, DE |
| AS62567 | 26,608 | 87,467 | 3 | 121 | Digital Ocean,US |
| AS53364 | 26,428 | 87,306 | 164 | 1 | AS-PRE2POST-2, US |
| AS22652 | 27,377 | 87,412 | 58 | 2 | FIBRENOIRE-INTERNET, CA |
| AS40191 | 27,562 | 87,466 | 4 | 122 | AS-PRE2POST-1, CA |
| AS6939 | 25,979 | 86,932 | 537 | 120 | Hurricane Electric, US |
| AS3741 | 26,885 | 87,434 | 36 | 123 | IS, ZA |
| AS2497 | 26,251 | 87,463 | 7 | 121 | Internet initiative Japan, JP |
| AS13030 | 26,876 | 87,394 | 76 | 27 | Init7, CH |
| AS209 | 26,653 | 86,949 | 520 | 120 | CENTURYLINK, US |
Table 2 – Route Views per-peer view of the IPv6 routing table, 18 February 2016
While a single snapshot of the routing system can illustrate that in terms of explicitly announced address space there are significant differences to be seen in various parts of the Internet, what it cannot show is whether such differences are part of the normal operation of a dynamic routing protocol, which would imply that a snapshot taken one day later, or even one hour later, would see a distinctly different view, or whether these differences are structural, in which case the picture of the differences in the anniounced address set from each peer would be relatively constant over time.
An analysis of daily routing snapshots from Route Views is shown in Figure 7. The scale of this plot is ±100M addresses, or approximately 6 /8s. Each peer traces two lines in this plot. The positive line is the number of additional addresses this peer is advertising in addition to the addresses that form the quorum set. The line in the negative space is the total amount of address space that is in the quorum set, but not advertised by this peer. Some peers see a considerably smaller span of addresses than others, and this difference is stable over time.
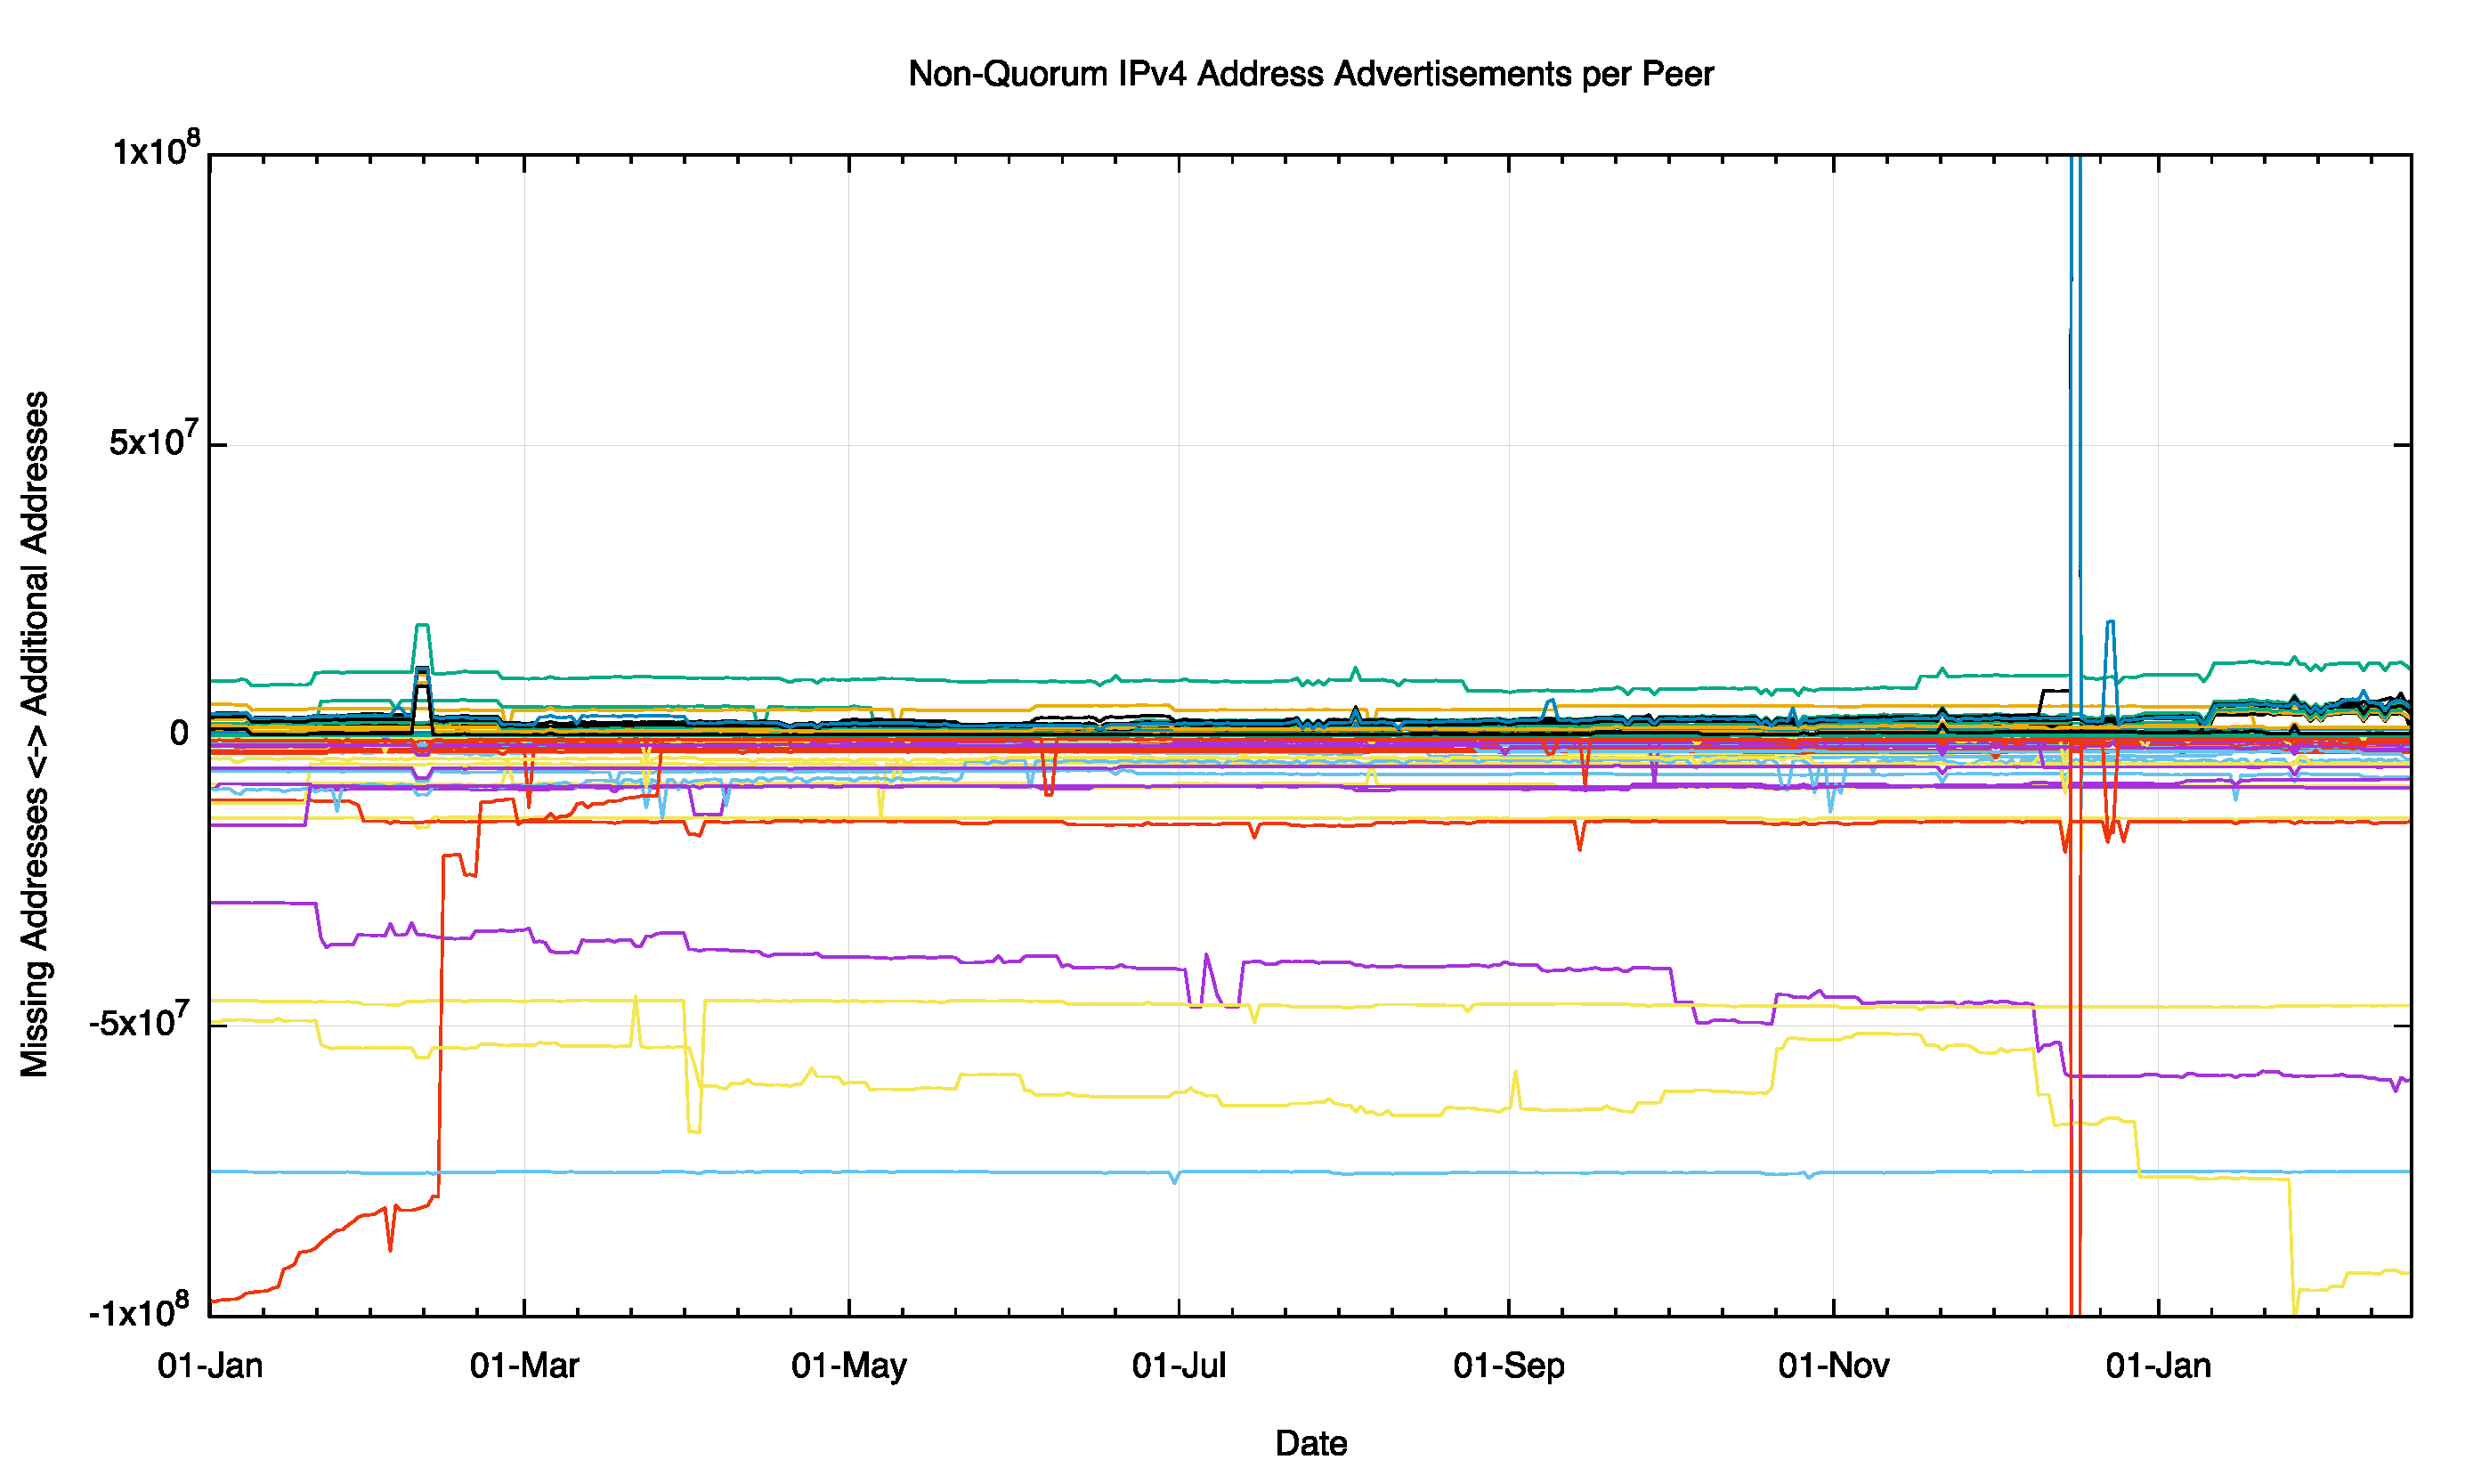
Figure 7 – Non Quorum IPv4 Address Advertisements per peer for 2015
When we look at just the cluster closer to the quorum by adjusting the scale of the plot to ±5M addresses (equivalent to a /10) we see a similar picture of stability of these address sets. There is some evidence of day-to-day variability at this level of detail. Interestingly there appears to be division in this data at the start of 2016, where a cluster of peers are advertising some 4M addresses (a /10) that are not being absorbed into the quorum set. This pool of additional addresses was some 2M addresses in the middle of 2015, and has doubled in the intervening 7 months.
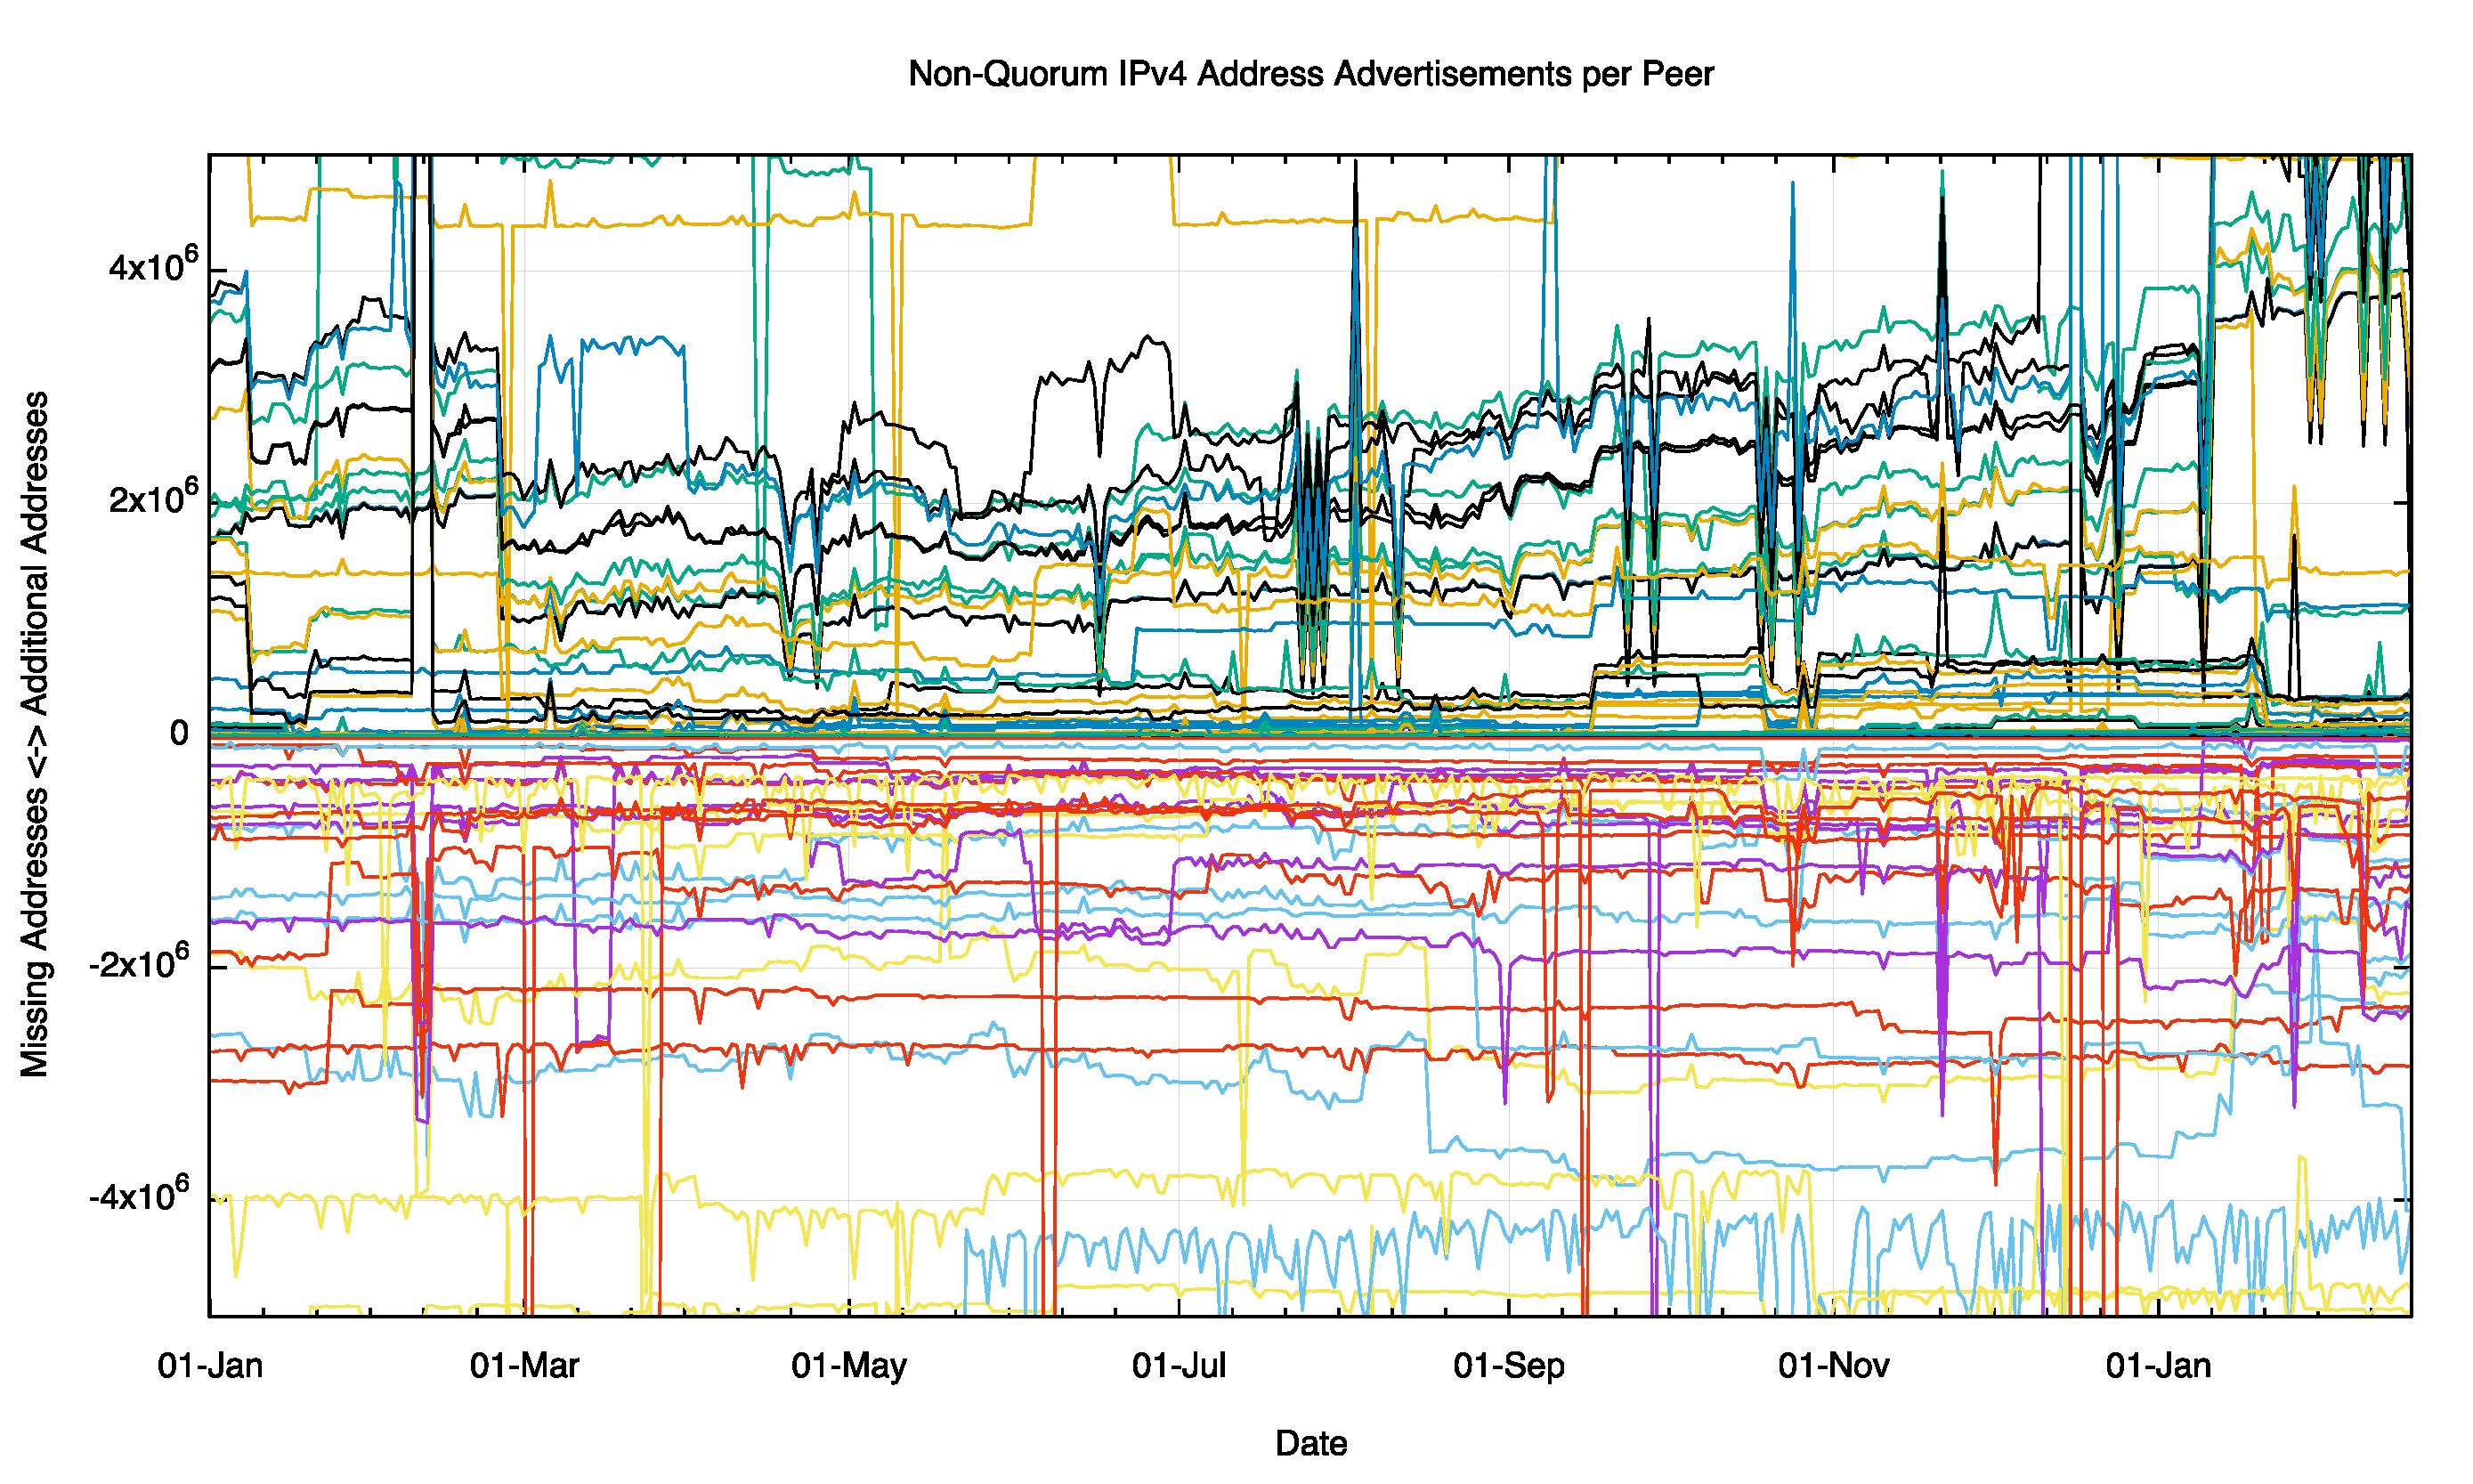
Figure 8 – Non Quorum IPv4 Address Advertisements per peer for 2015
We can also look at this at the level of detail of a span of a /16, or 65,536 addresses.
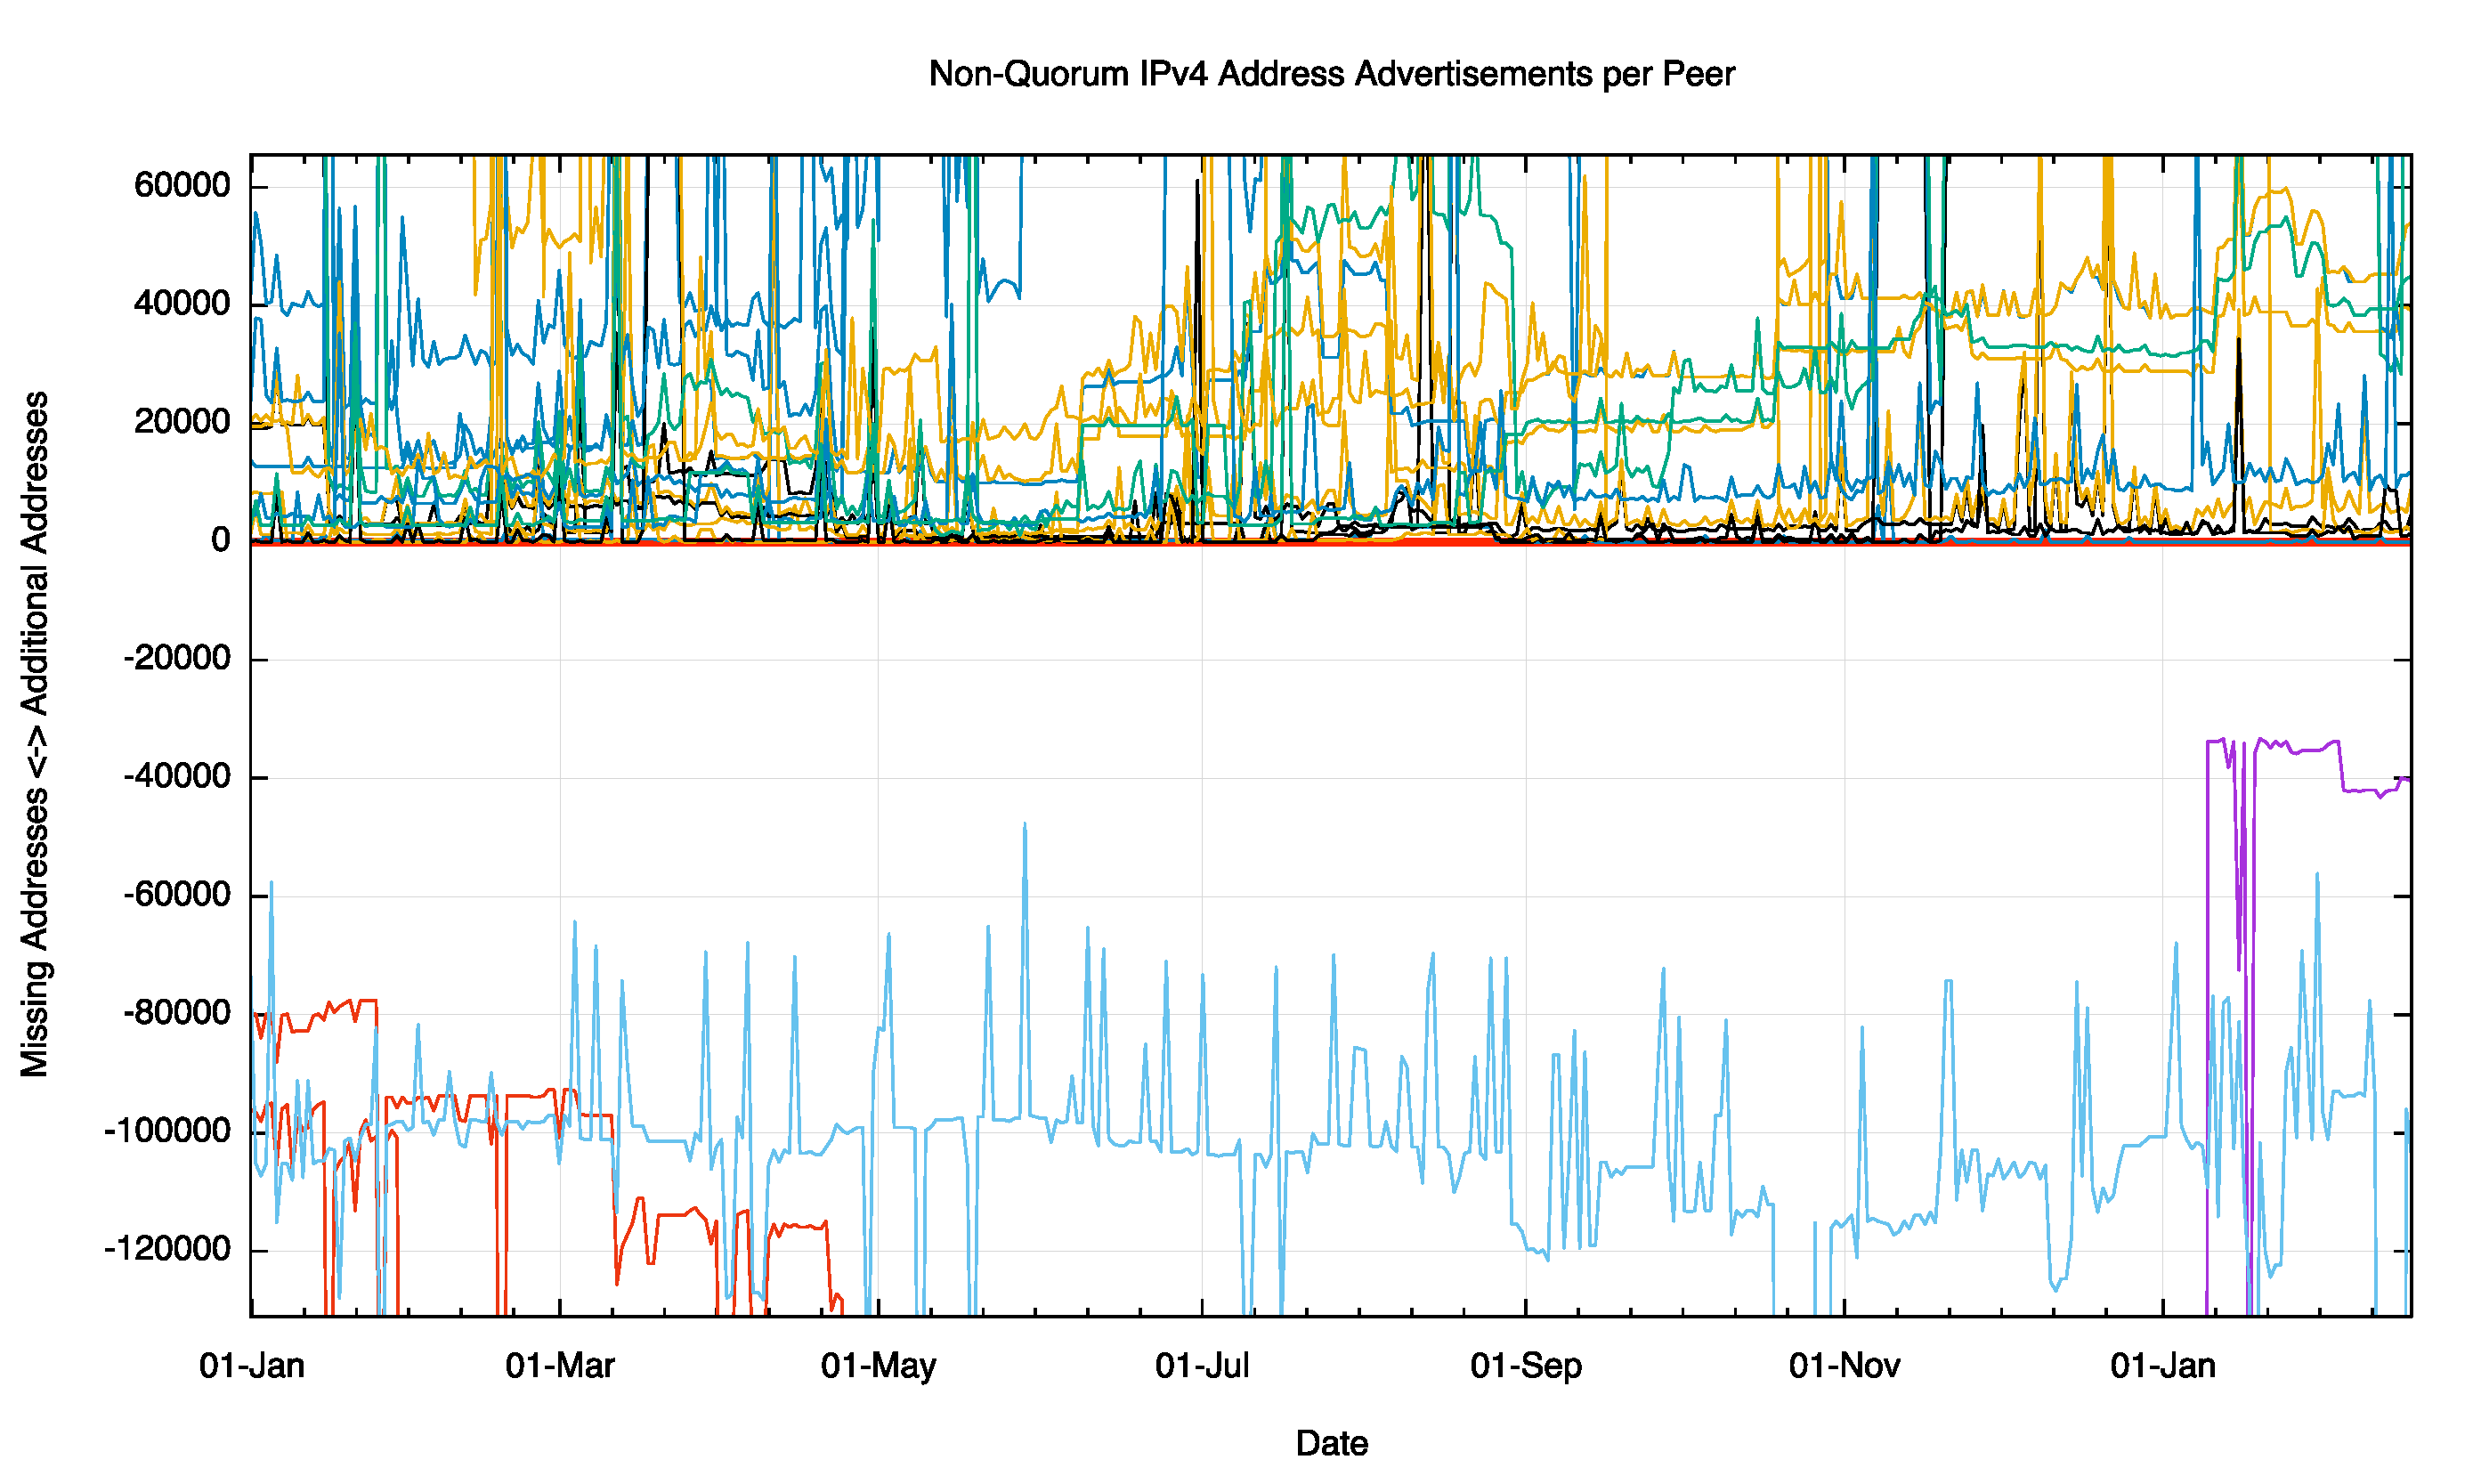
Figure 9 – Non Quorum IPv4 Address Advertisements per peer for 2015
Here a number of peers are seeing additional addresses that are not part of the quorum set, and the extent to which they vary from the quorum are somewhat unstable over the year. Few peers differ from the quorum set by up to 130,000 addresses (Figure 9).
There is a similar story for the IPv6 network, where individual peers can see differences in the address span from the quorum set that encompass some 1,000M /48’s (Figure 10). These aonmalies appear to be relatively long lived, spanning some months.
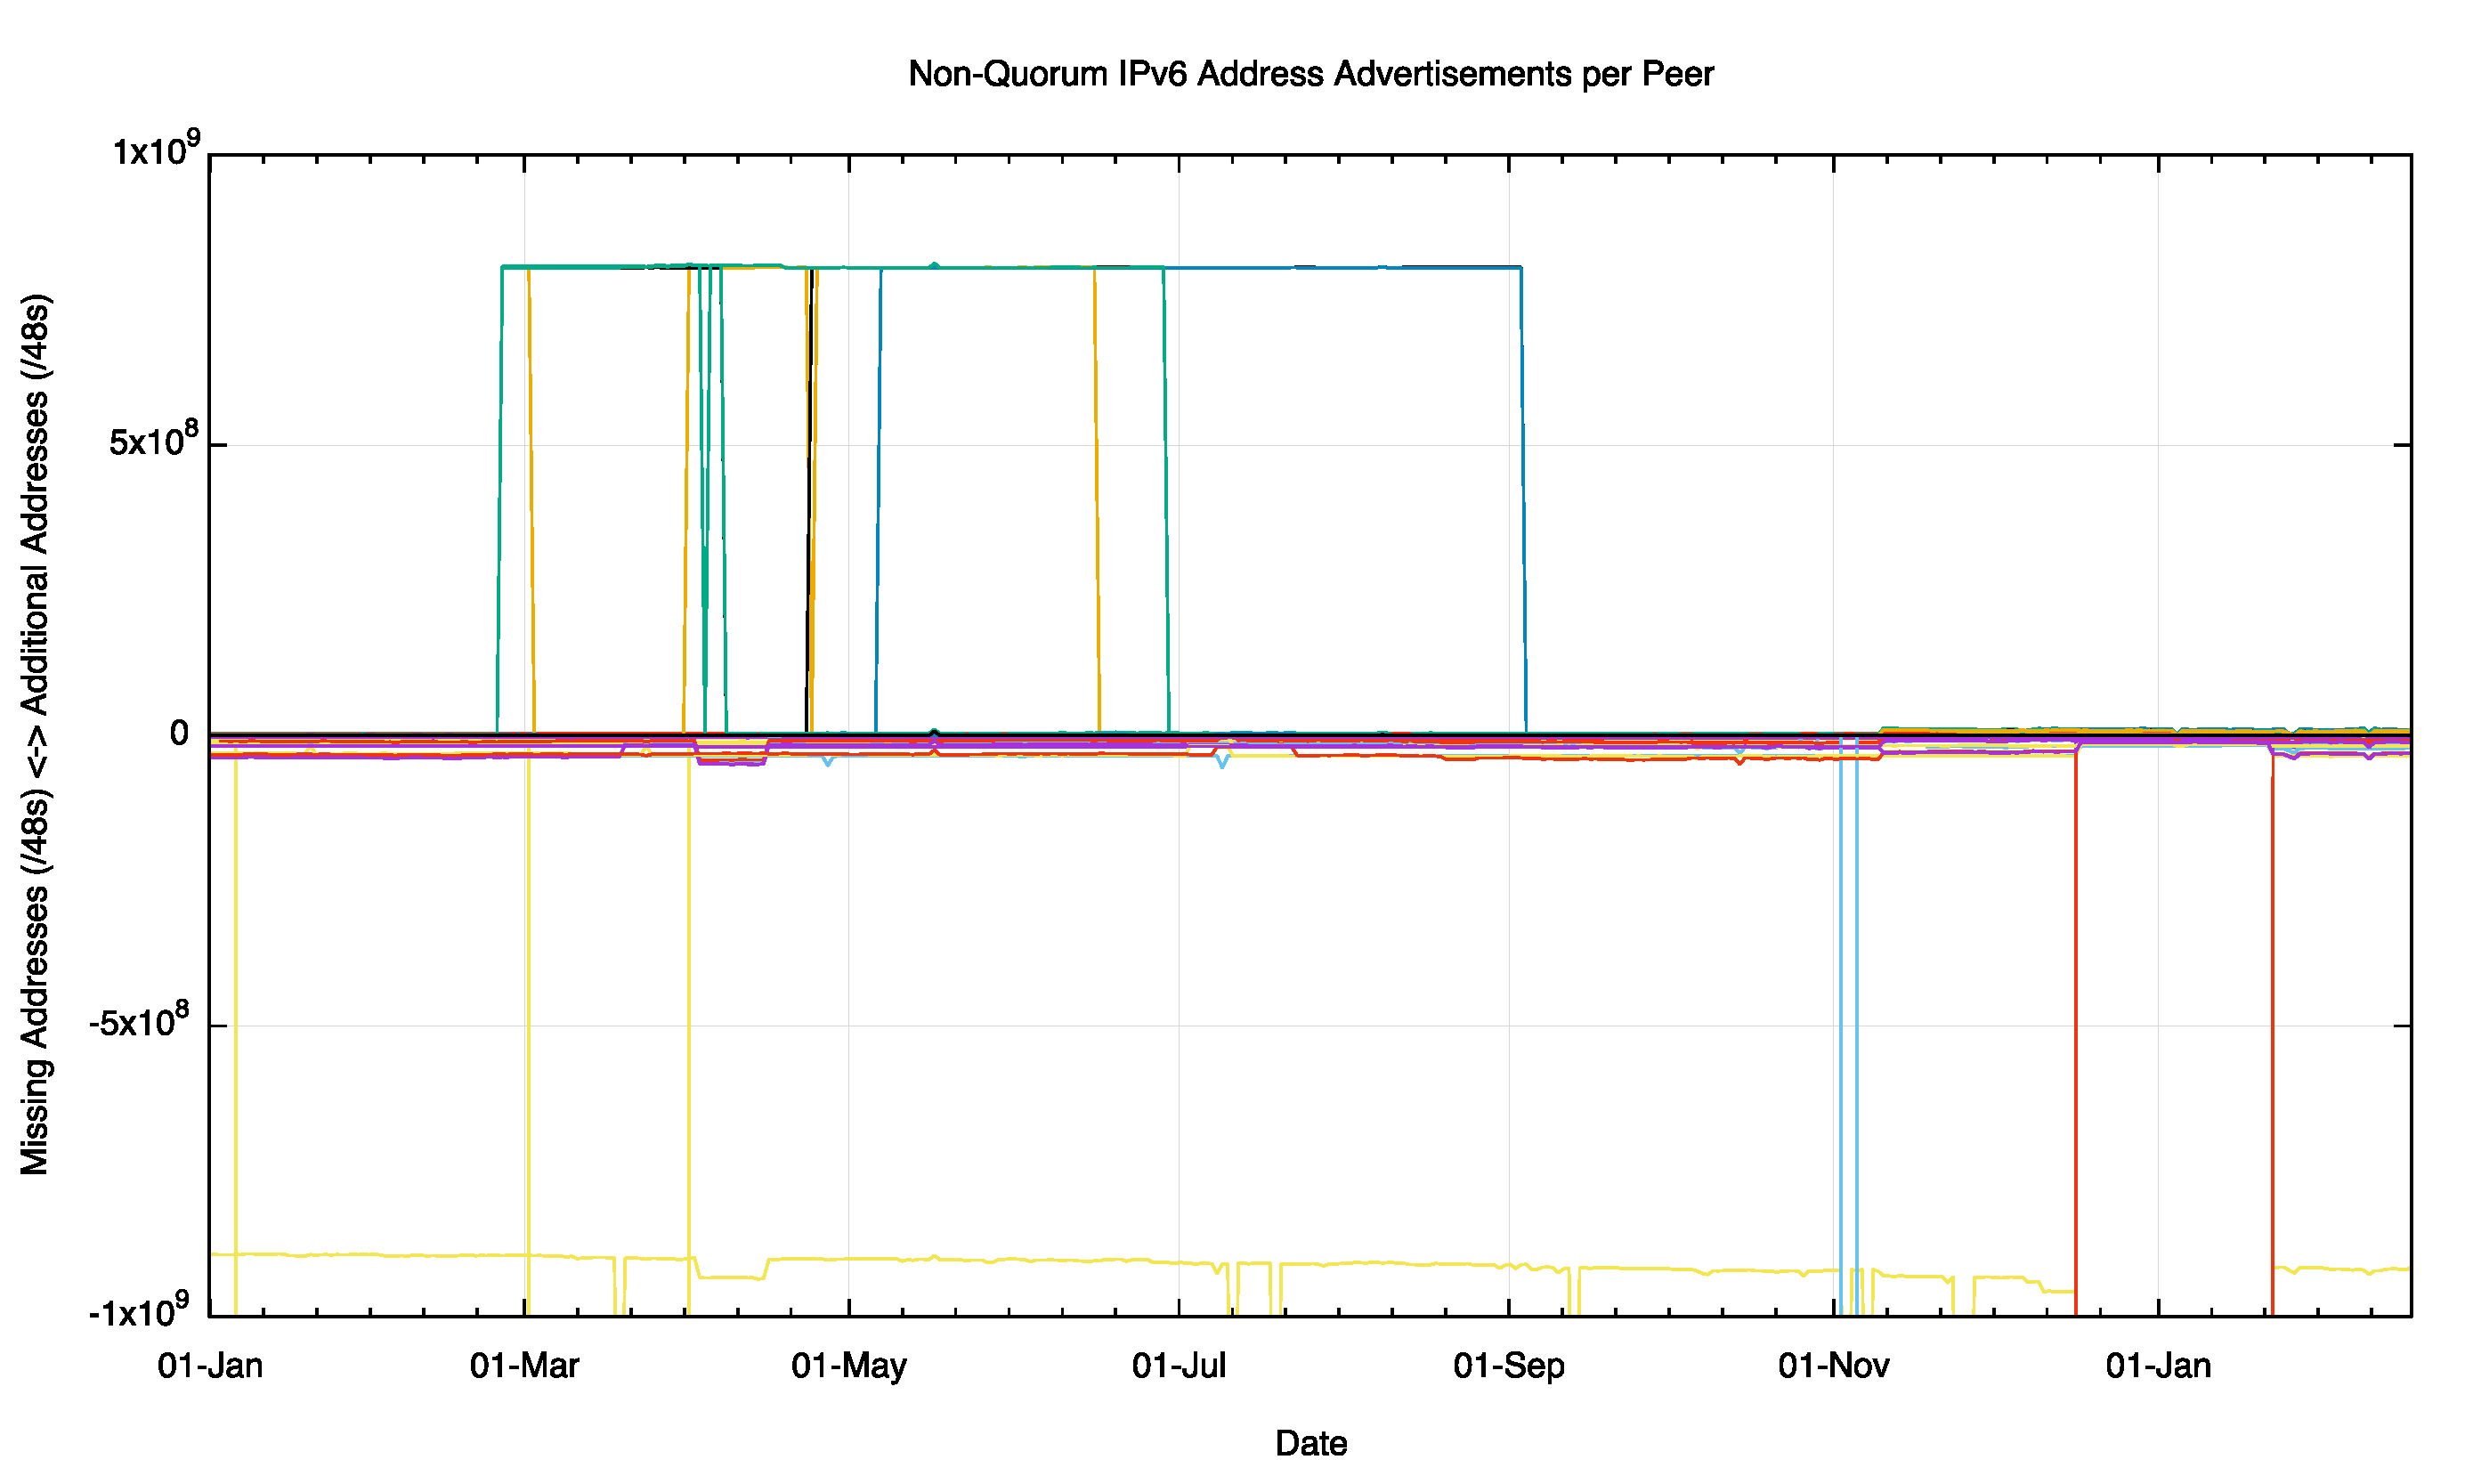
Figure 10 – Non Quorum IPv4 Address Advertisements per peer for 2015
At a finer level of detail, spanning ±50M /48s (roughly a /22) we see see a higher degree of divergence freom the quorate set, particularly where individual peers are missing advertisements that are part of the quorum set.
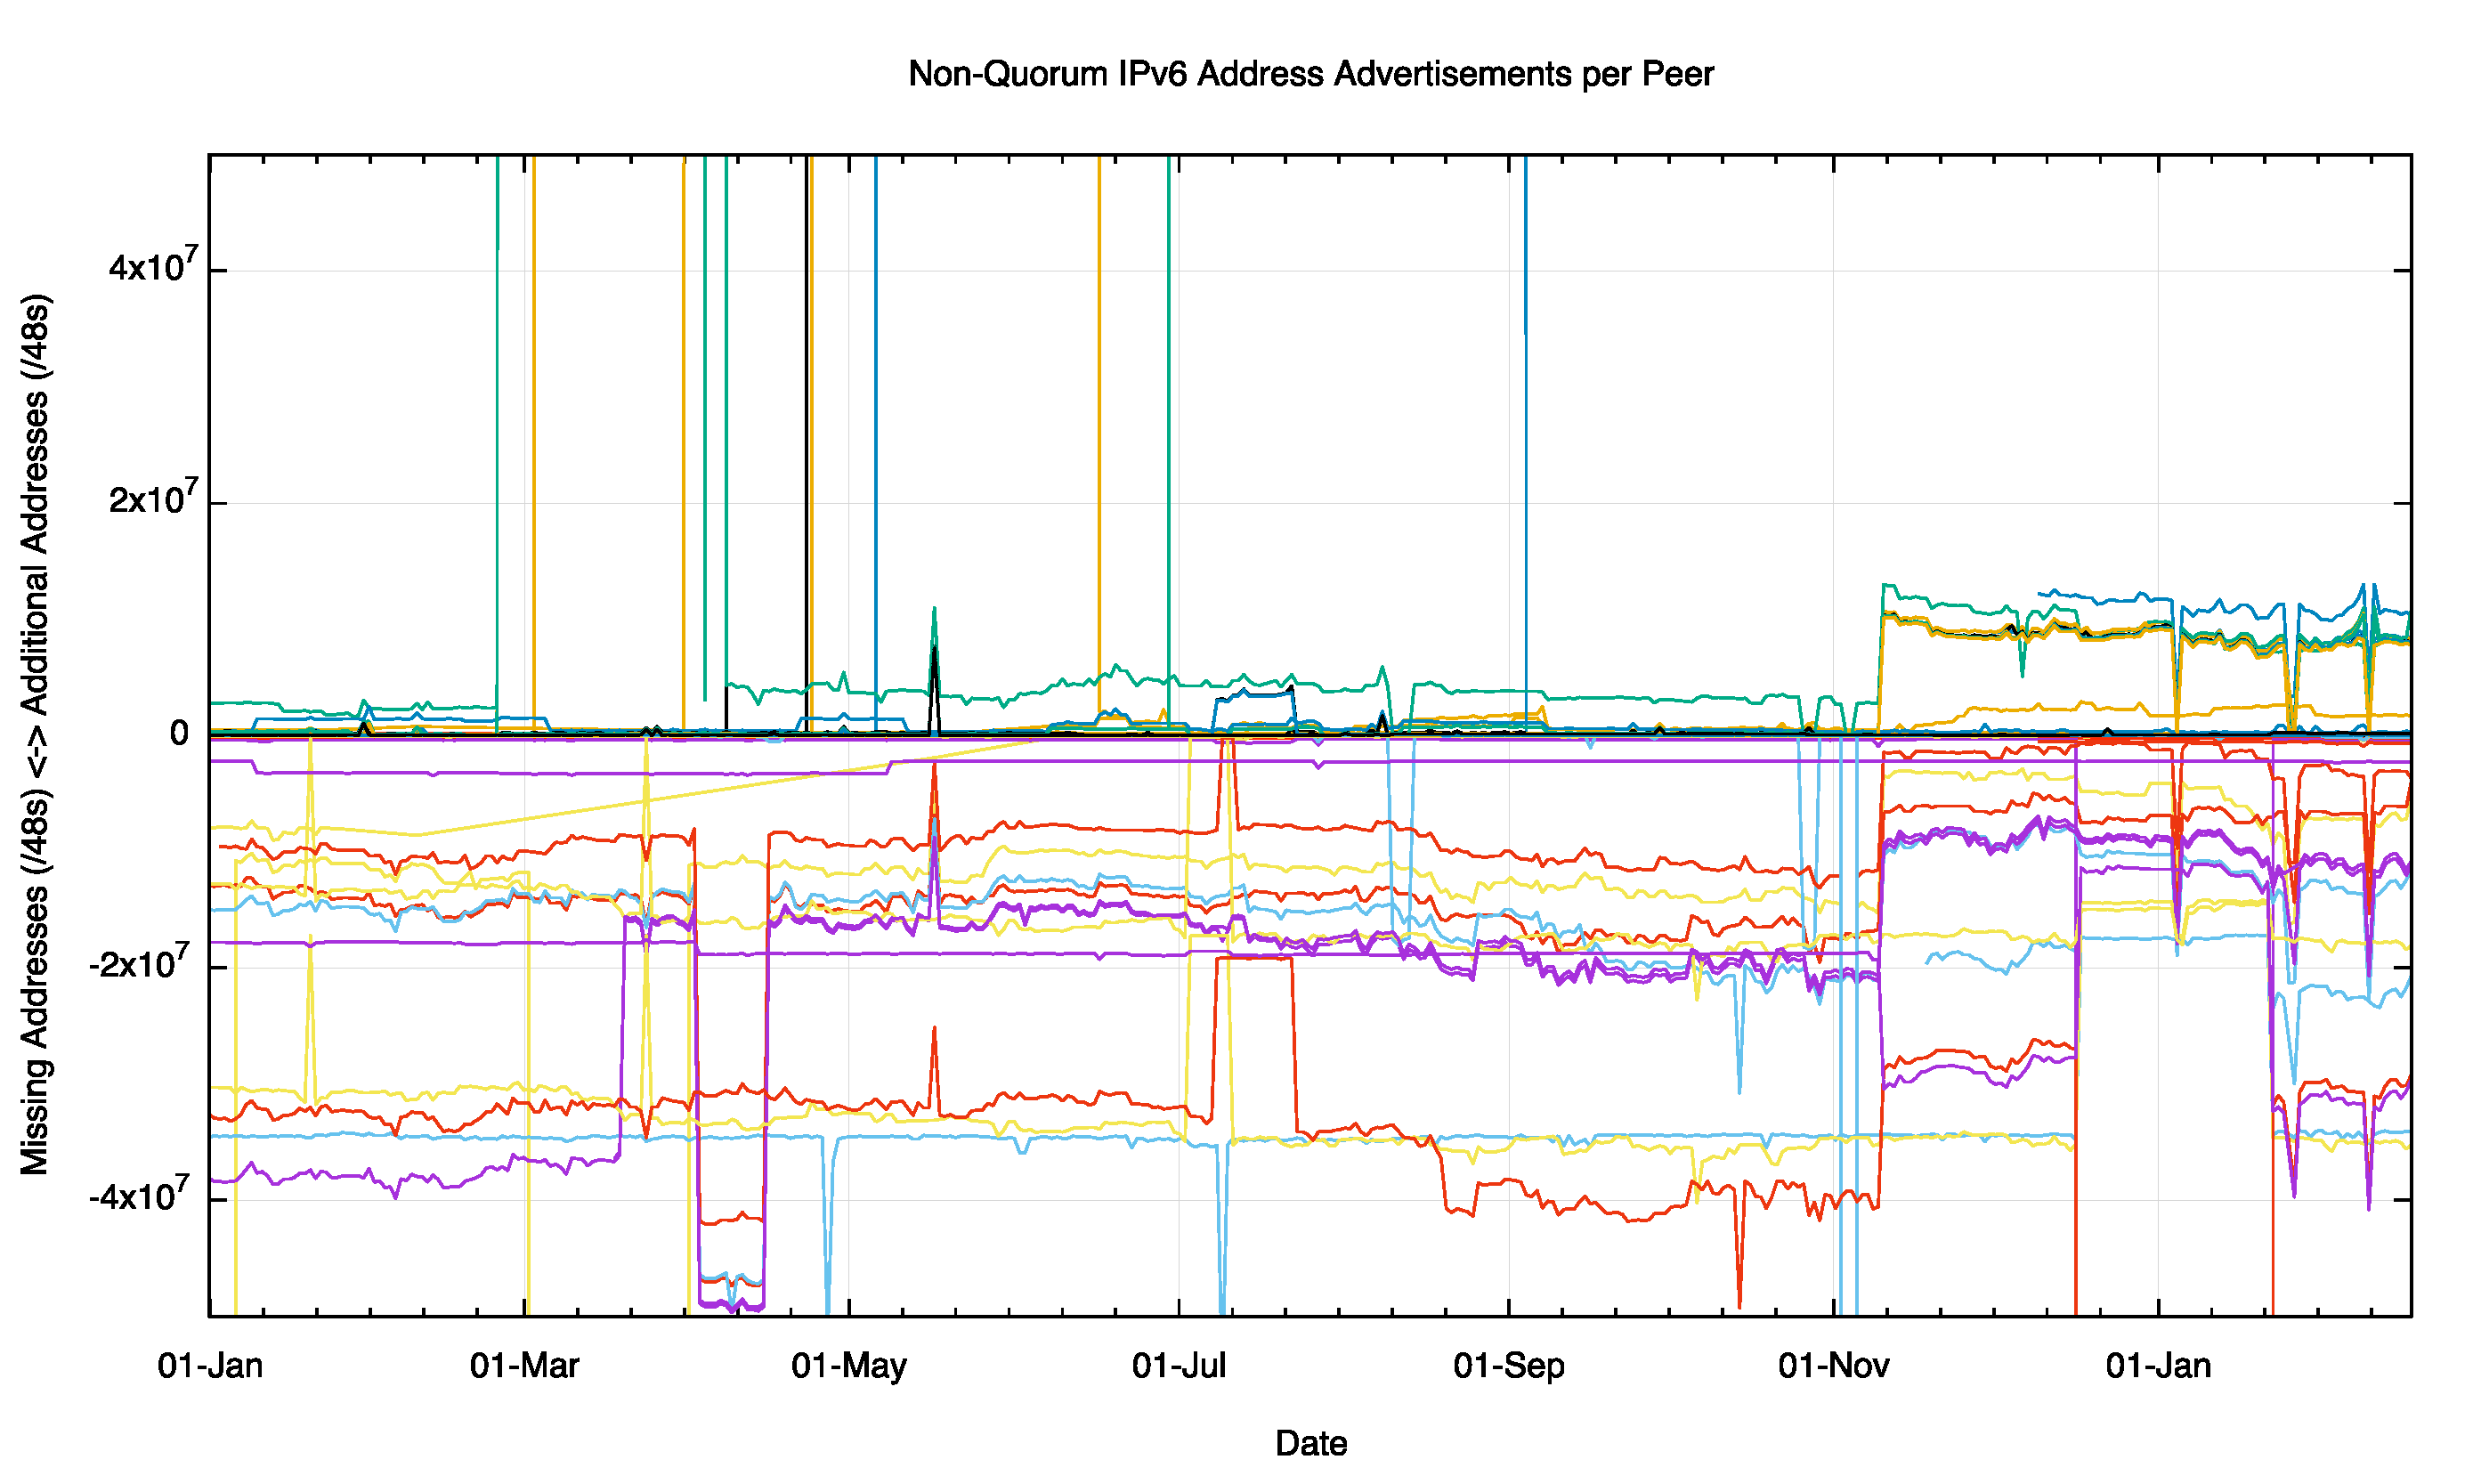
Figure 11 – Non Quorum IPv4 Address Advertisements per peer for 2015
Finally, when we look at the same data with a span of ±5M /48s (roughly a span of a /27) we can see the movement of indivdual /32 advertisements in and out of the divergent set for each peer, but there is an underlying stability to these differences over the observed period for most peers.
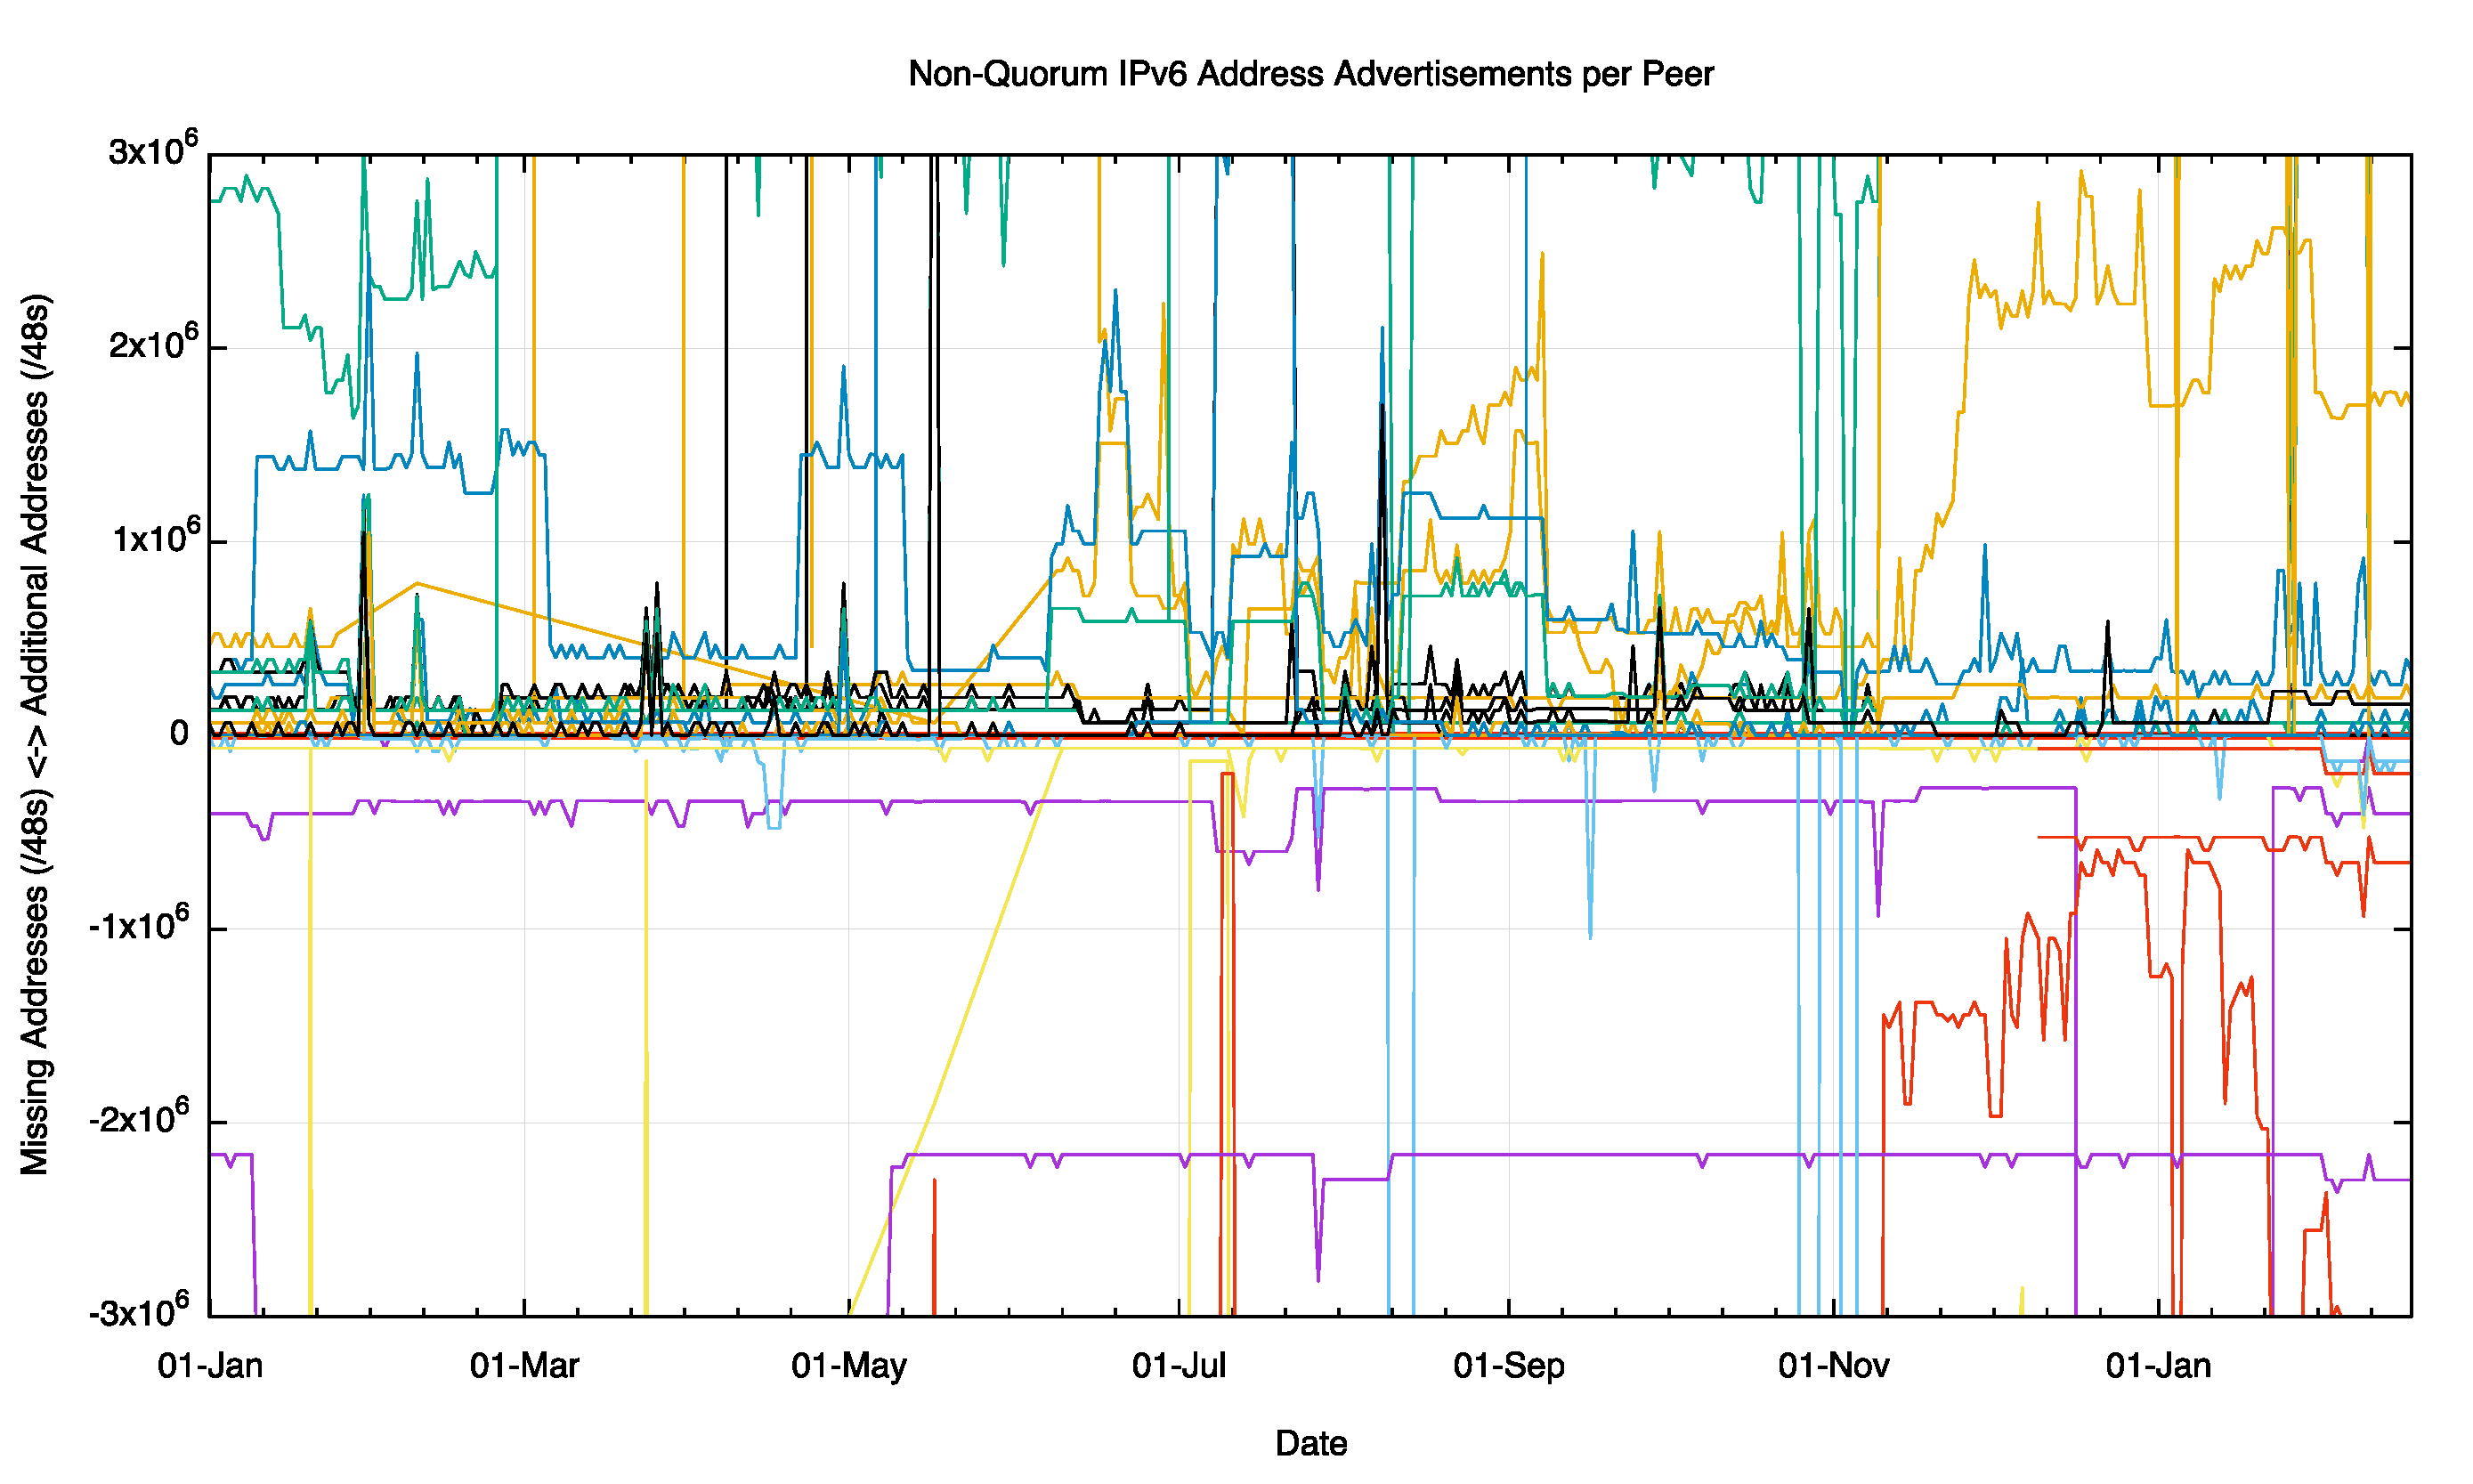
Figure 12 – Non Quorum IPv6 Address Advertisements per peer for 2015
How serious is this issue? The basic question is perhaps unanswerable in any precise manner. This is the question: “To what extent are attempts by one Internet user to contact another user, or some service, prevented by a structrual breakage of the interconnectivity of the Internet?â€
While this is perhaps an unanswerable question, there are some perspectives that can provide some indirect pointers to help quantifying the extent of this issue on today’s Internet.
The first observation is that what we see in the routing system as the control plane of data and what happens at the packet forwarding level is not always aligned. As was demonstrated in a paper at IMC in 2009 (Internet Optometry: Assessing the Broken Glasses in Internet Reachabilityâ€, R. Bush, O. Maennel, M. Roughan, S Uhlig, ACM SIGCOMM IMC, 2009), a number of network operators were observed to be using a ‘default’ route to complement upstream connectivity. This implies that as a packet traverses a sequence of upstream connections it does not necessarily need to follow explicitly advertised routes, but instead can follow the default route. What is essential for widespread symmetric connectivity is that the routes are present as explicit routes in the tier 1 providers, as there is no further default route in use at this point in the Internet’s routing hierarchy. This paper reported that some three quarters of the Ases at that time behaved in a manner that was consistent with an upstream default. However, this finding applies along data paths leading along sequences of ‘upstream’ inter-AS relationships. It is an unusual case to see a network provider pointing their default route across a peer link, and even more anomalous to see default pointing to a customer’s network. So, the use of default assists to some extent, but it can only mend a certain subset of routing anomalies, and its by no means a panacea.
The second issue is connectivity asymmetry. Its often the case that we think that connectivity breaks are symmetric, so that if endpoint A cannot send packets to endpoint B then the reverse is also assumed to be the case. In packet switched networks, particularly ones like the Internet that use a unidirectional routing protocol to maintain its internal topology and reachability, such assumptions about connectivity symmetry do not hold. In these scenarios it is not uncommon to see cases where A cannot pass packets to B but B can still pass packets to A. Can we see evidence of this?
At APNIC we run a measurement system where some 4 – 10 million Internet endpoints each day are enrolled to perform a small set of basic connection tests. These pseudo-randomly selected browsers drawn from across most of the Internet all attempt to make contact with a small set of servers that are instrumented to record connection attempts. Oddly enough not every connection attempt succeeds. Regularly there is a pattern of asymmetric failure, where the endpoint can send a packet to the experiment’s server, but the server’s attempt to respond to the endpoint fails.
Over 2015 we looked at connectivity attempts from some 446 million IPv4 endpoints, and saw 1.1 million asymmetric failures. The raw data appears to be suggesting that approximately 1 in 400 connection attempts fails in this asymmetric manner. Is this the basic evidence that suggests that not everything is connected to everything else all of the time? The daily connection failure rate is shown in Figure 13.
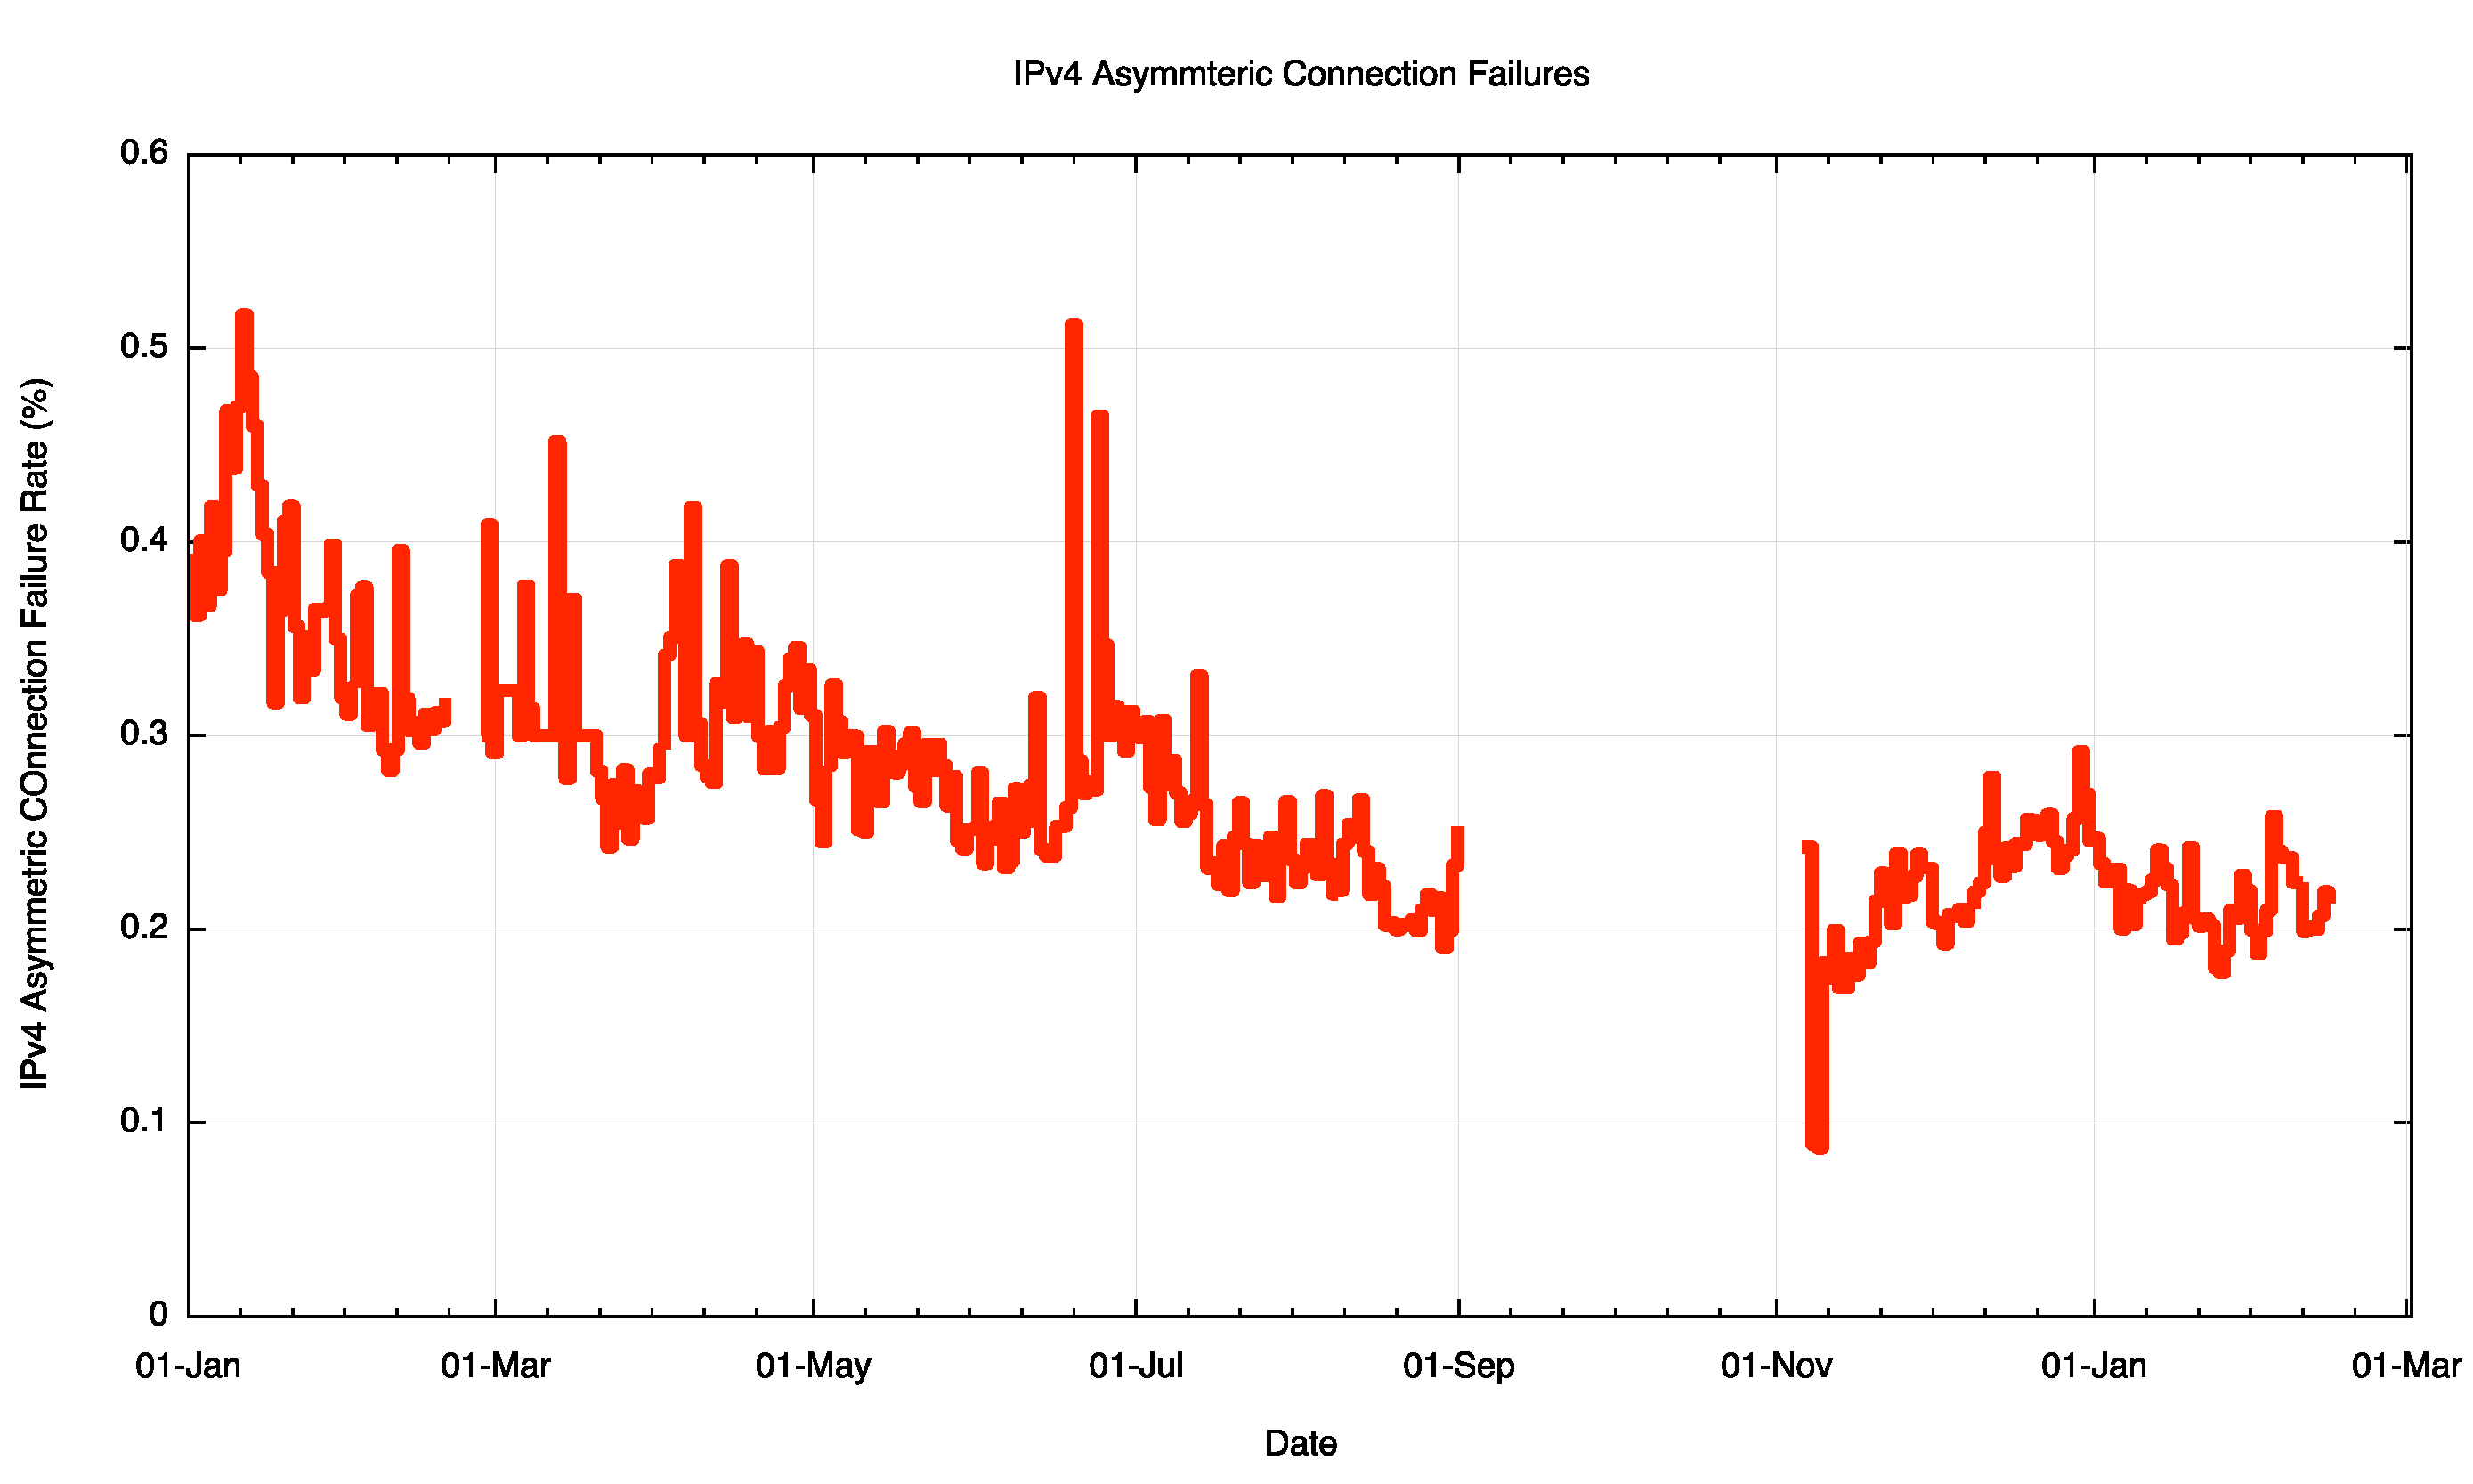
Figure 13 – IPv4 Asymmetric Connection Failure Rate
Now there are a number of potential reasons for connection failure in thos particular experiment, and the data cannot distinguish between connections initiatited in the context of the experiment and the various address scans that scan the Internet address space using TCP SYNS in ports 80 and 443. So its unlikely that all the the asymmetric connection failures shown in Figure 13 are attributable to asymmetric connectivity. But its likely that there is a significant component of failures due to this particular form of asymmetric connectivity fragmentation in the Internet.
A comparable picture of IPv6 asymmetric failure paints a somewhat worse situation (Figure 14).
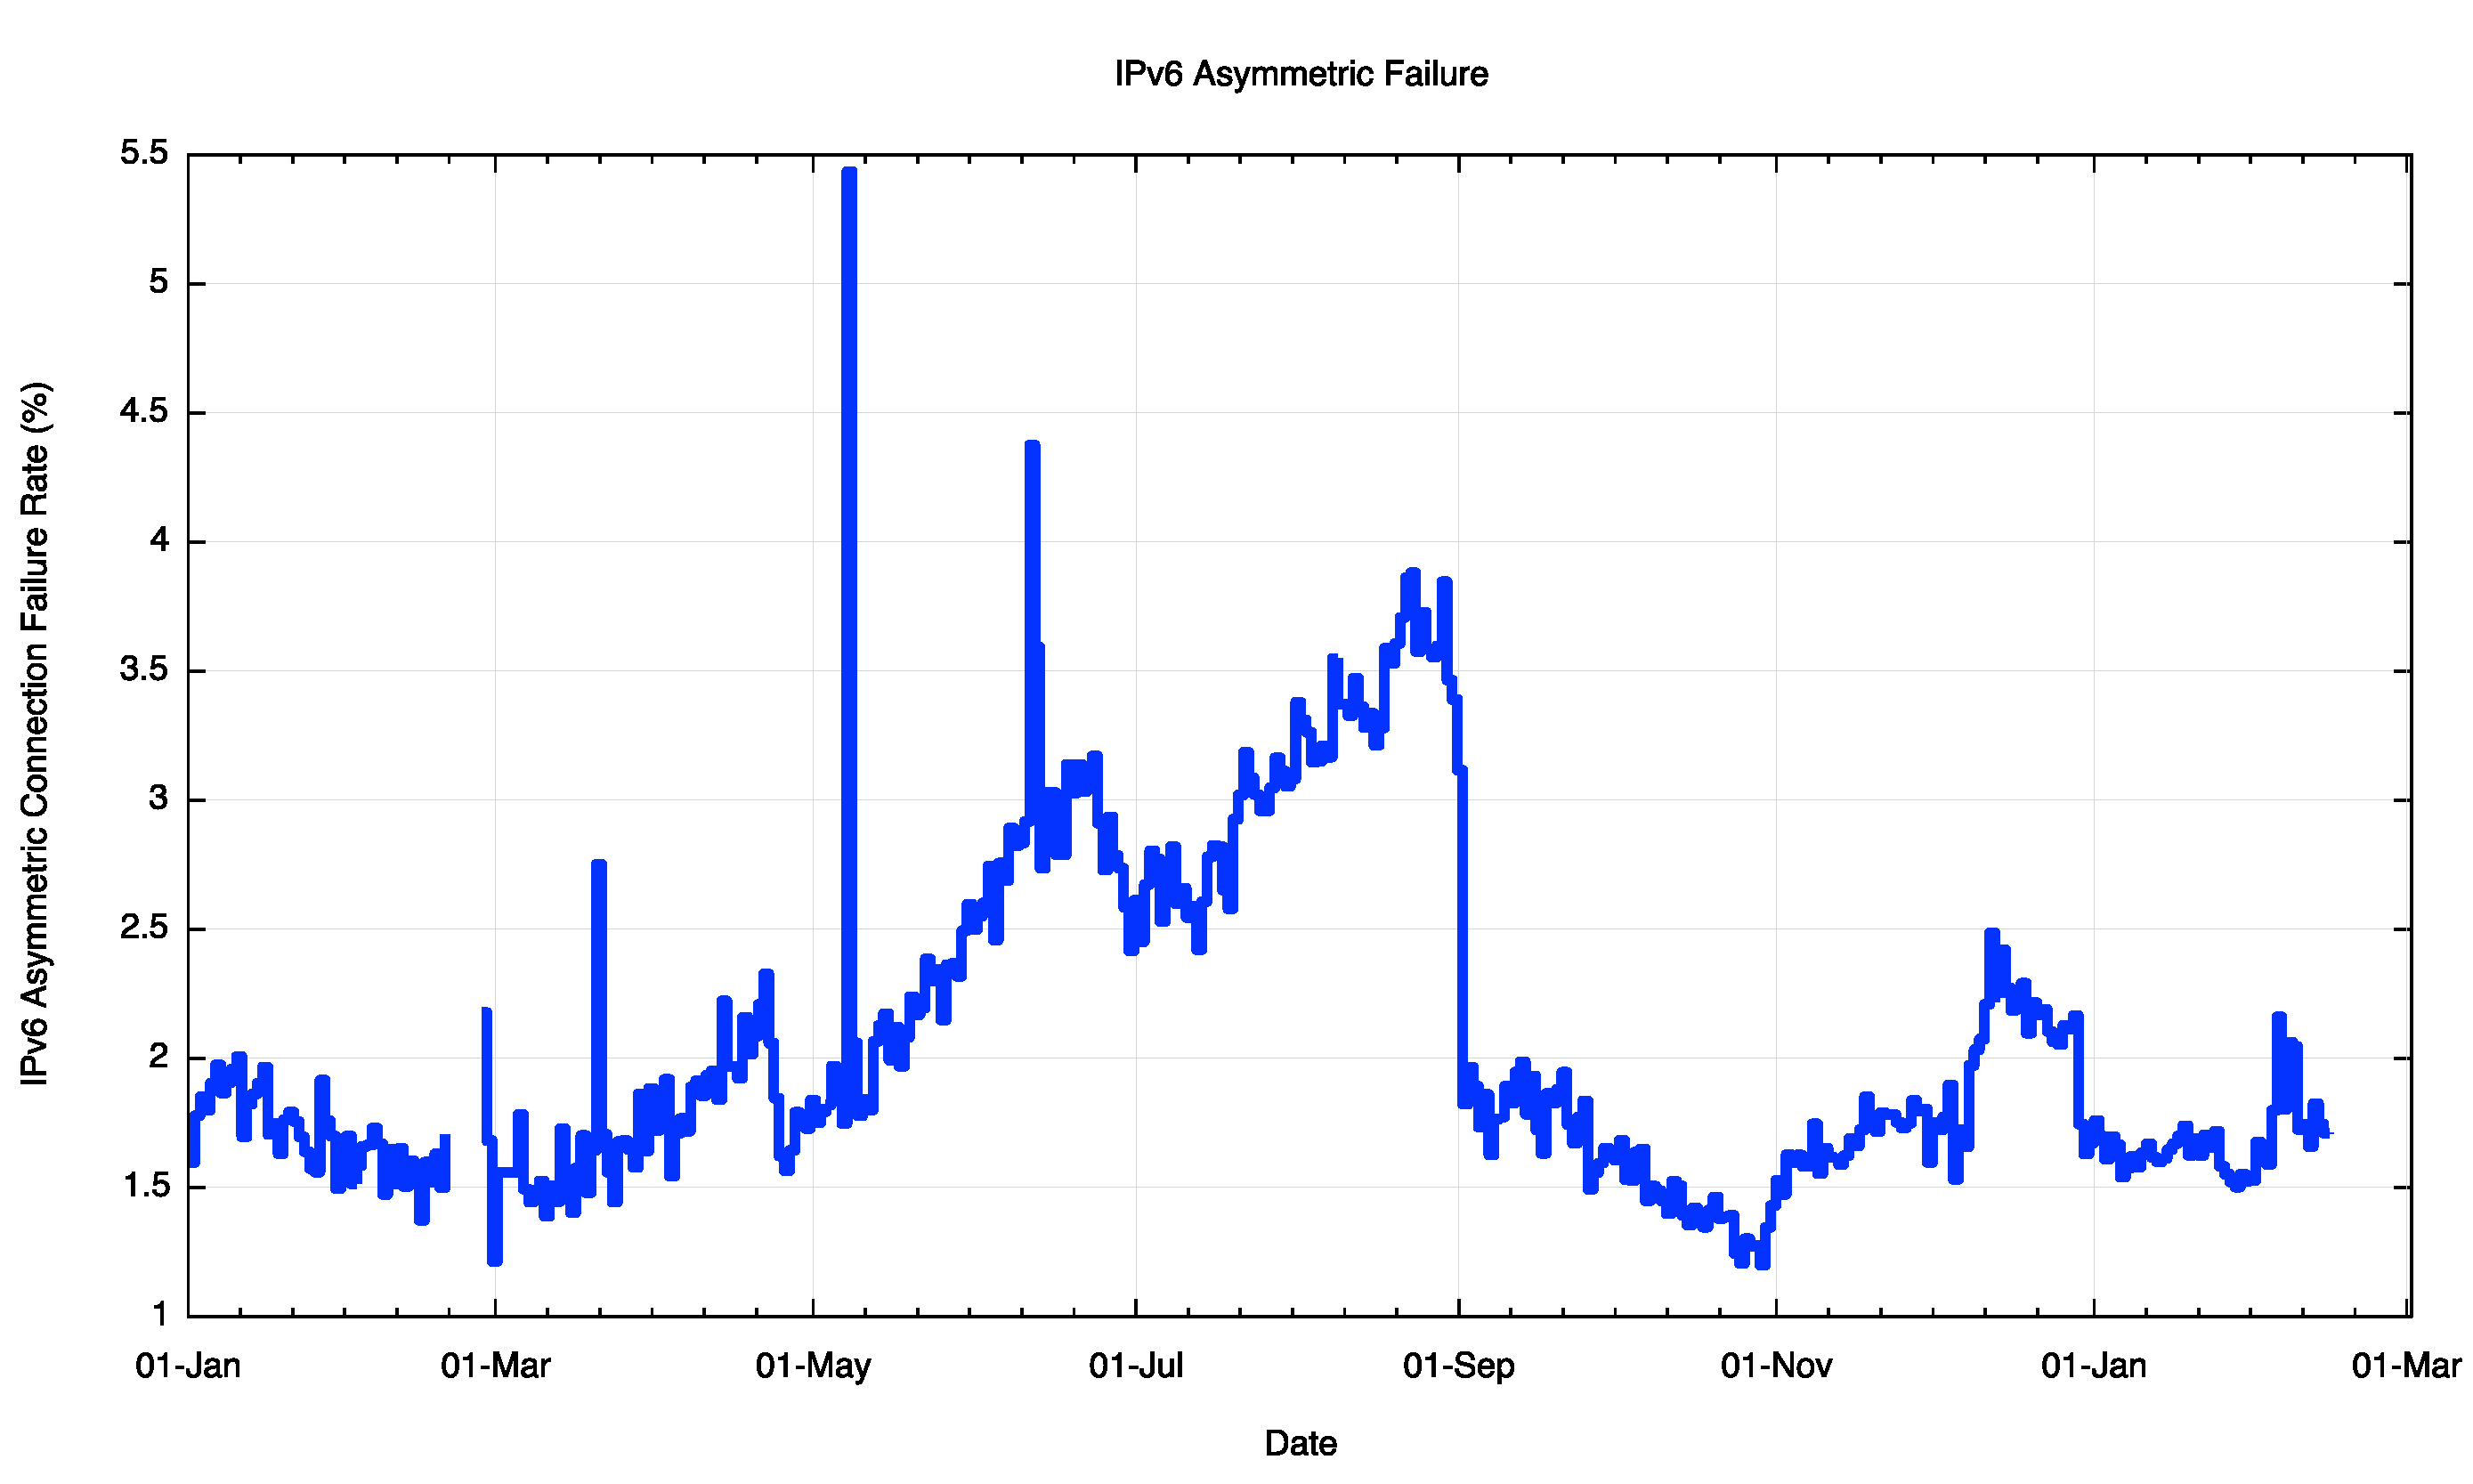
Figure 14 – IPv6 Asymmetric Connection Failure Rate
It is likely here that a number of additional factors come into play to account for this relatively high asymmetric connection failure rate of 1 in 50 connections, including suspected issues with the Consumer Premises Equipment (CPE) and a piecemeal picture of IPv6 support, but within this rather disappointing figure asymmetric network connectivity is a contributing factor.
Why is this?
Or, to put the question in the opposite sense, why isn’t all of the Internet fully connected? Surely this is a case where individual motivations coincide with the common good. Each connected network is best served by being reachable from the entirety of all other connected networks, and network is potentially detrimentally affected when there are networks that cannot reach them. This is also a symmetric desire, in that the same applies to the set of networks that can be reached by this connecting network. The theoretical value of the connection is maximised when the network can reach, and be reached by, all other connected networks.
In practice however it is not possible to purchase a service that guarantees such universal reachability. Service providers strive to fulfil such expectations on the part of their customers, but universal connectivity falls into the category of ‘best effort’ as distinct from “service garanteeâ€.
Why is this?
Universal interconnection is not a requirement imposed by any regulatory fiat, nor by any deliberate arrangement between network operators. Interconnection is its own market, and the outcomes can be viewed as market-based outcomes.
Each individual service provider network operates in a domain or “peering” and “tieringâ€. “Tiering†refers to an implicit structuring of networks into a collection of customer and provider relationships. This tends to be hierarchical, in that if A is a customer of B is a customer of C then it would be highly irregular to see that C is a customer of A. (Figure 15)

Figure 15 – Customer/Provider Relationships
In this example A would be a network operating a tier 3, B at tier 2, and C at tier 1, and the money associated with the provision of connectivity and transit services would conventionally flow along the same path. In this particular case, absent any other inter-AS relationships, A has the expectation that B can provide a complete set of routes to all other connected networks, and B is relying on C in the same manner.
“Peering†refers to a subtly different relationship between networks, where neither is a customer of the other. The typical template of a peering relationship is that the two peering networks exchange reachability of their own and their customers’ routes, but do not exchange routes that they learned from being a customer of a higher tier provider, and nor do they exchange routes learned from other peering relationships. So in our simple three network picutre of A -> B -> C, if we introduce a fourth network, D, who peers with B, then D will learn how to reach addresses of endpoints located in networks B and A, but not C. (Figure 16)

Figure 16 – Customer/Provider and Peering Relationships
There is no incremental reachability achievable to D were it to also peer with A, and if it did B may come to the conclusion that if D is peering with one of its customers then D should also be a customer, as a peering relationship normally infers that both networks are positioned at the same tier in the customer/provider hierarchy. Obviously, commercial reality is far subtler than this and network operators have managed to invent many variations on this basic theme, but the underlying principles of interconnection are relatively constant.
If all of these relationships were static this situation would be tractable, but of course the system is constantly changing. Providers shift their relationships in the connectivity ecosystem. New providers appear, such as content distribution networks, and of course there are acquisitions, mergers and splits where the resultant entities need to recalibrate their position in the realm of connectivity.
One view is that is a surprising outcome that the connectivity on the Internet is as stable and as comprehensive as it is, given that this is a market driven outcome without any particular guarantees of the right outcome.
Perhaps it’s not as surprising as that. Another, admittedly cynical, view is that its all about what one would loosely call an “informal cartel†of the tier 1 providers that are at the core of connectivity. As long as each connecting network takes the effort to ensure that their routes are advertised to at least one tier one router via one or more customer / provider relationships then some level of basic connectivity is an outcome. After that basic connectivity is achieved, then peering is there to minimise the cost and/or improve the service for selected routes. Within this perspective Internet-wide connectivity is defined almost completely by the ability to have one’s routes passed into the tier one provider cartel. This group of peered interconnected networks essentially define what it is to be connected in the Internet. So another view of Internet connectivity is that this is not a distributed open market for connectivity, and instead we have a self-perpetuating routing monopoly at its ‘core’!
Is the Internet fully interconnected? Probably not. Around its edges it a grey zone of connective asymmetry where you might be able to send a packet to me, but that does not mean that you get to see my response!