Much has been written about the progress of the adoption of IPv6 over the years. I know I’ve been guilty of adding my writings into the pool, and this article is a further contribution to that pool of observations and measurements. In this case I want to look in some detail at the deployment of IPv6 in China.
Why is China so important in this story of IPv6 deployment?
We can look at IPv6 adoption in economic terms as a market. What we have is an unregulated market, in that market participants will act according to their perceptions of self-interest, as there is no external control over behaviours. The entrance of new goods and services into a market face some particular problems. If a good (a behaviour, a characteristic or a service) is used by only a small proportion of the market’s consumers then either the good provides relative advantage to early adopters (the so-called early adopter advantage), in which case the volume of the market traded good will rise over time as other market participants are motivated to also realize this potential relative advantage, or it provides insufficient relative advantage, in which case the good will languish and possibly even disappear from this theoretical market. Once a good achieves a certain level of adoption a different market behaviour emerges. Late adopters suffer a penalty because they are not participating in this common activity and may well have to expend resources to compensate for their inability to directly participate in this market for the introduced product or service. The market has achieved critical mass, and at this point the pressures for adoption across the remainder of the market is virtually assured, as laggards in adoption are now at a relative disadvantage as compared to the pool of existing adopters.
It’s hard to tell at what point a critical mass condition might emerge, as the historical record shows different thresholds for the adoption of different goods and services. It may be as low as 5%, particularly if the early adopter advantage is very large, or it may be as high as 50% or 60% if there is virtually no early adopter advantage. Nicholas Felton of the New York Times reported on the adoption of a number of household items over the twentieth century (Figure 1). With the exception of the hiatus of consumer spending in the 1940s due to the war effort, adoption curves show a similar pattern, with a slow initial phase, an accelerated adoption phase and a declining market saturation phase. In retrospect the critical mass for colour televisions in the consumer market was just 5% of the consumer population, while the washing machine has experienced a much slower adoption momentum, and its critical mass appears to have been at 30%.
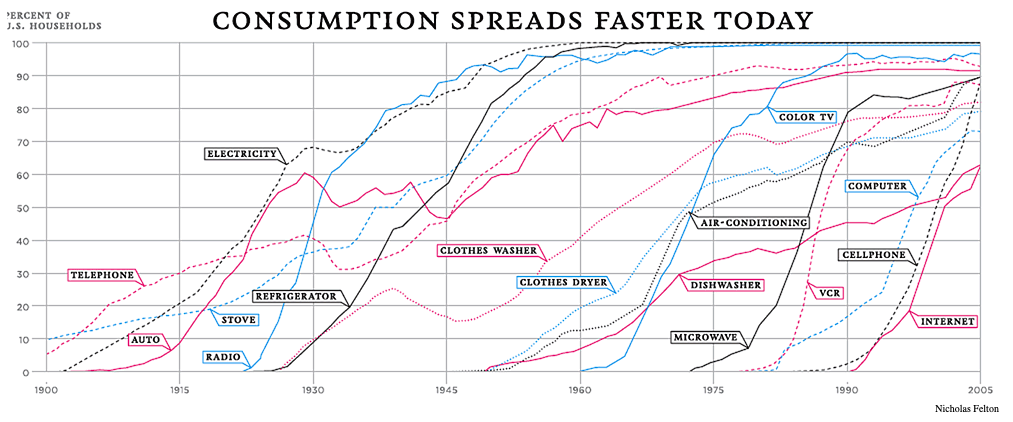
Figure 1 – Adoption of household technologies in the US over the Twentieth Century, Nicholas Felton, New York Times
IPv6 Adoption Worldwide
If we look at the metrics of IPv6 adoption in human terms (by that I mean counting ‘users’ rather than counting connected devices or the volume of traffic) then we observe that the five most populous economies are China, India, the United States of America, Indonesia and Brazil, and collectively these five economies contain some 48% of the world’s population. When we look at the population of Internet users per economy then there are some changes, in that countries with a high count of children and a low GDP per capital may not have as high a level of Internet use per capita as compared to richer and demographically more mature populations. The five largest Internet user economies are China, India, the United States of America, Brazil and Japan, and collectively they contain some 51% of the population of Internet users.
Without knowing exactly what critical mass might be for the adoption of IPv6, it is certainly the case that if five largest national populations all adopted IPv6 then the assertion that IPv6 has achieved critical mass would be very hard to challenge.
Of these five national economies, India has the highest IPv6 deployment counts. Some 60% of its estimated 475 million users are using devices and services that support IPv6 to the endpoint. The count in the United States of America is slightly lower at some 48% of its 291 million users. Brazil has an IPv6 infrastructure that serves 26% of its 140 million users, and Japan is measured at 30% of its 116 million users. China is the lowest of these five economies in terms of IPv6 deployment.
China has an estimated Internet user population of 741 million, out of a total population of 1.4 billion people. If there was extensive deployment of IPv6 services in China, then the case that IPv6 has already achieved critical mass of deployment would be easy to make. On the other hand, if such a significant user population had no IPv6 service and no visible plans for IPv6 services, then the entire conversation about the times and certainties about the future of IPv6 takes on a different direction.
Which means that China matters in the world of IPv6. It matters a lot.
It is therefore no surprise that measuring IPv6 adoption in China is a topic of intense interest at present. Which is what I want to look at in this article.
IP Adoption in China
Internet measurement is always challenging. The Internet is largely constructed on a platform of private investment and network measurements can often be analysed to yield competitive market intelligence. The result is that broad based measurements that would allow us to gain real insight into the constituent networks’ behaviours are frustratingly scant. Of course, it’s not just researchers who get frustrated with this situation. Industry regulation and public policy relies not only on a solid understanding of the current environment but a sufficient amount of data to perform reasonable forecasts, but perhaps that’s another article for another time.
Let’s look for some public data on IPv6 deployment in China.
IPv6 Addresses in China
The regional address registries maintain records on IP address allocations. In these records they also use a country designation, adding a two-letter country code to the address allocation record. This country designation does not necessarily designate where one may find hosts using these addresses on the Internet. That’s not its purpose. The country code is generally used as the country where the major corporate office of the address holder is located, so it’s more of an administrative designation than a form of geolocation. There are some instances where a service provider spans multiple national economies and where allocated addresses may be found in any or all of these realms. There are also cases where the corporate address is in a different economy to where the addresses are actually deployed. However, these cases are not the majority of cases in the data, so while the data is not entirely reflective of actual geolocation, there is a strong correlation between the designed country code of an address allocation record and its actual geolocation of the advertised address.
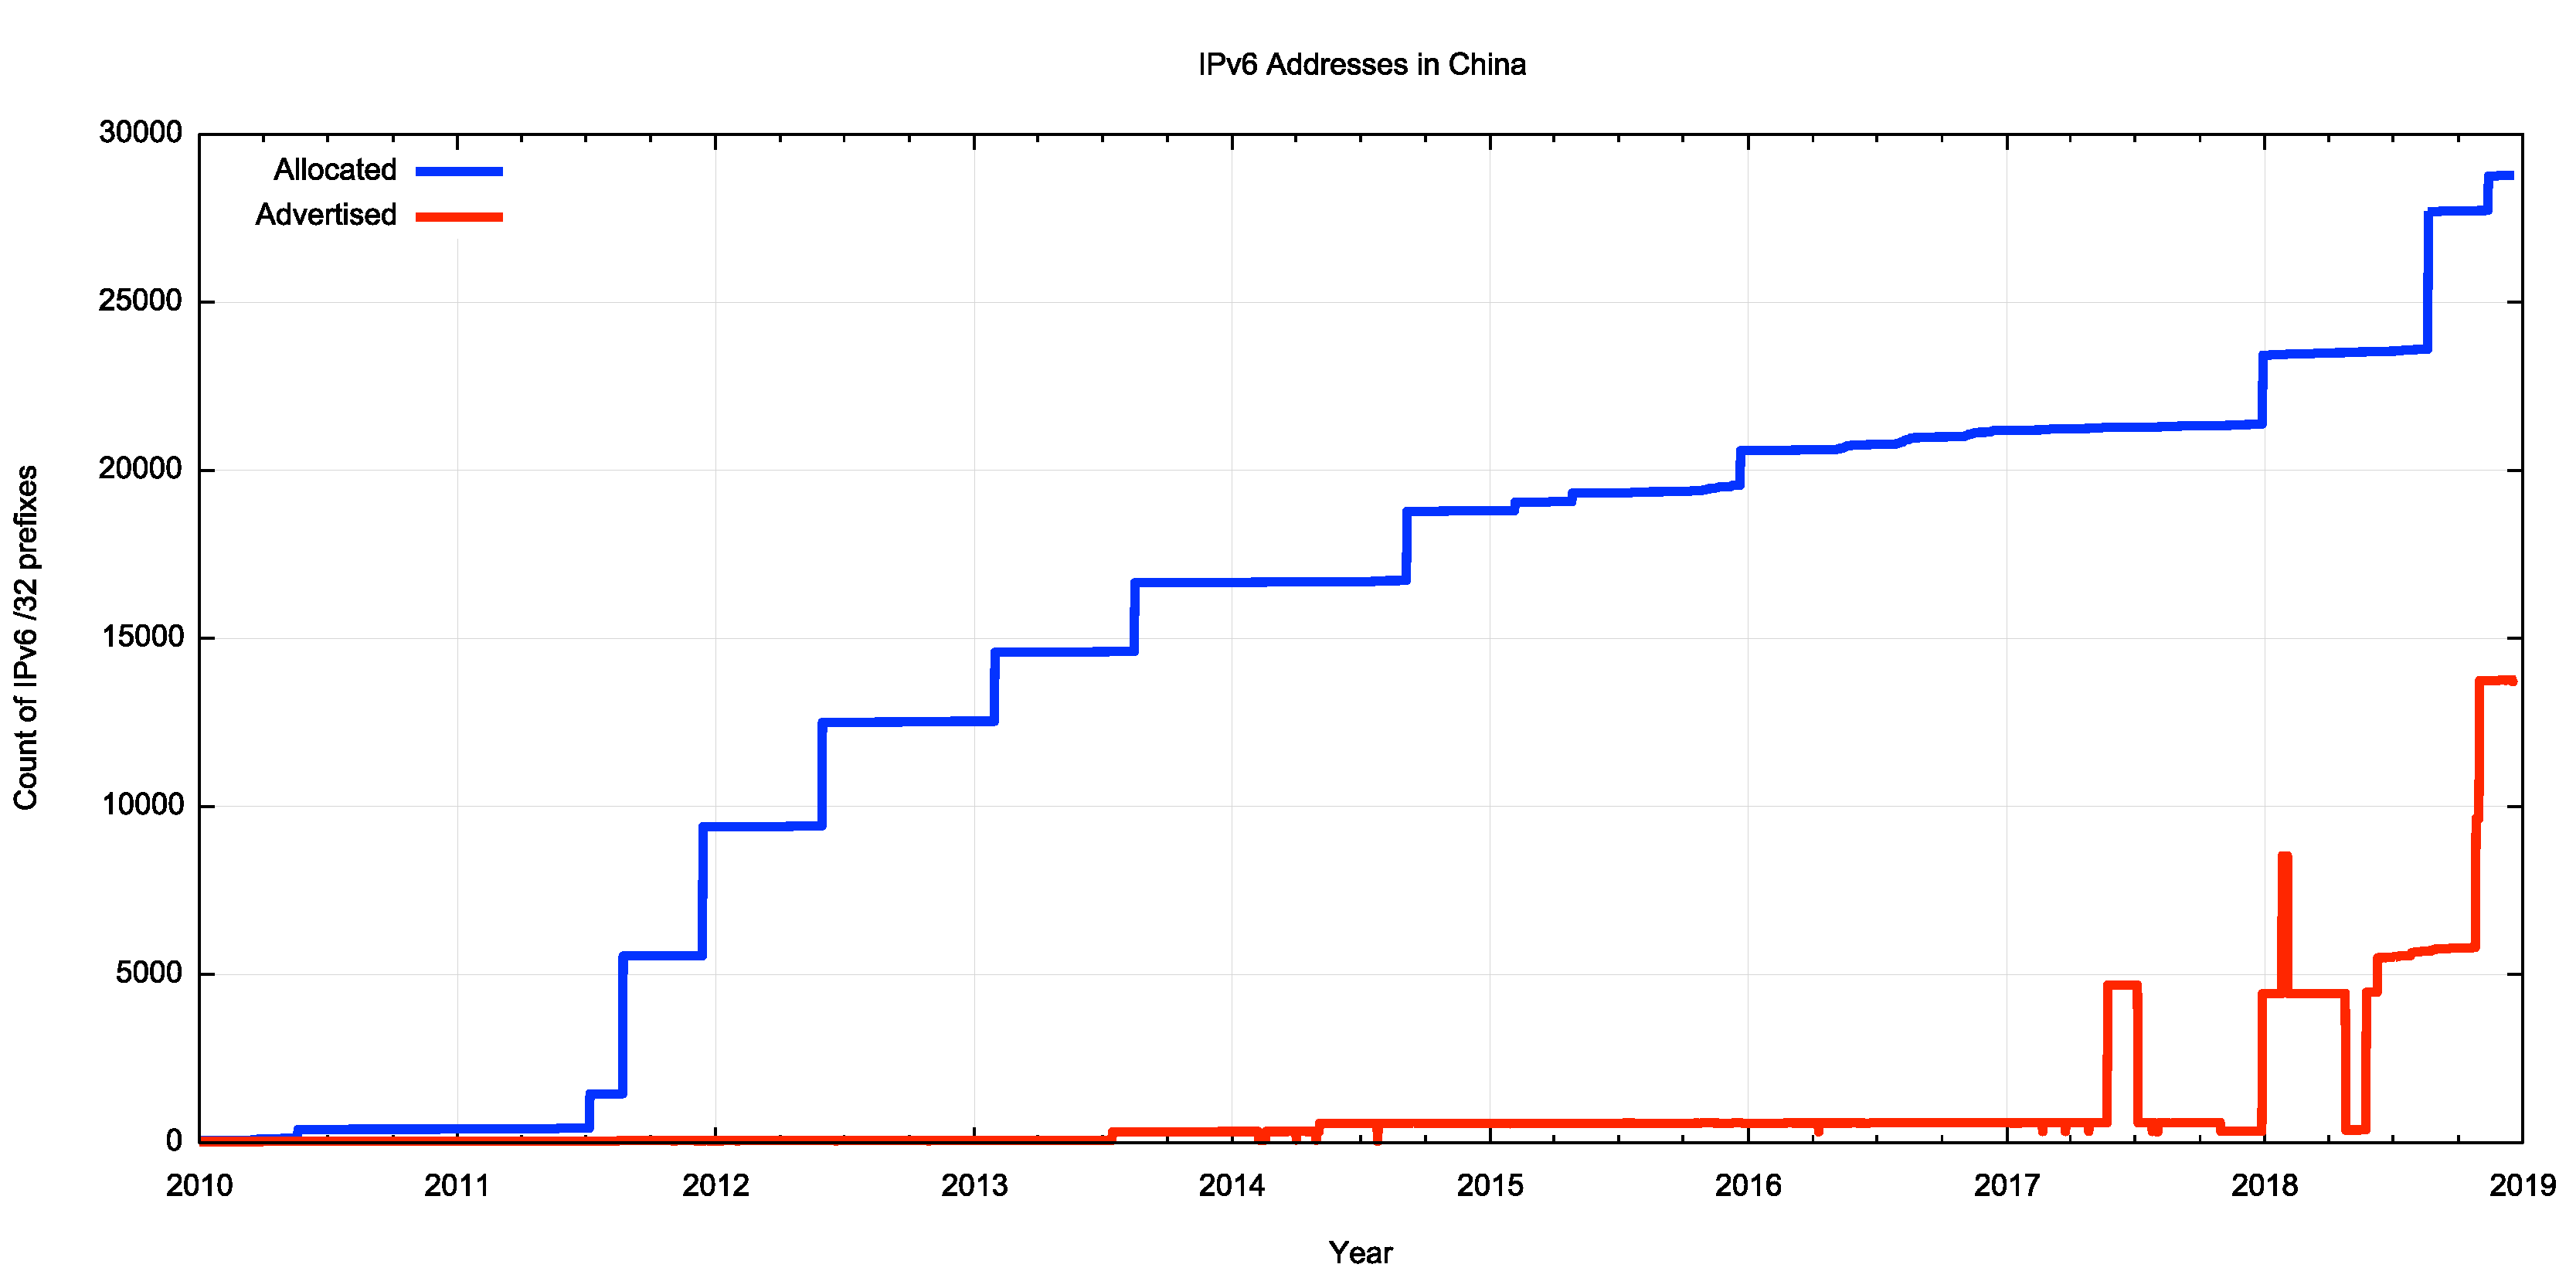
Figure 2 – IPv6 Address Allocations and BGP Advertisements in China – 2010-2018
The day-by-day record of both the total volume of IPv6 addresses allocated or assigned to Chinese entities is shown in Figure 2. The overall bulk of IPv6 addresses allocated to Chinese entities were allocated in the period 2011 to 2015. More recently, a /21 was allocated in late 2017 (to CBN, China Broadcasting Network Corporation), and a /20 in 2918 (to SINOPEC, the China Petroleum & Chemical Corporation).
While much of the advanced provisioning occurred some years ago, the total volume of IPv6 address prefixes advertised into the Internet inter-domain routing space has been very quiet until the end of 2017. On the 29th December 2017 the total advertised volume jumped from the equivalent of slightly less than a IPv6 /24 to a /20. In late October 2018 this volume of advertised addresses more than doubled, to slightly more than a /18 of address space. At the end of 2018 slightly under one half of the IPv6 allocated address space is now visible in the IPv6 routing tables.
This is consistent with IPv6 deployment activity gathering some momentum in 2018, although precisely how to interpret these numbers if challenging. Advertising an IPv6 address prefix is a necessary precursor to deploying IPv6 services, but there may be a considerable time lag between addresses appearing in the routing system and addresses being used by services and end users.
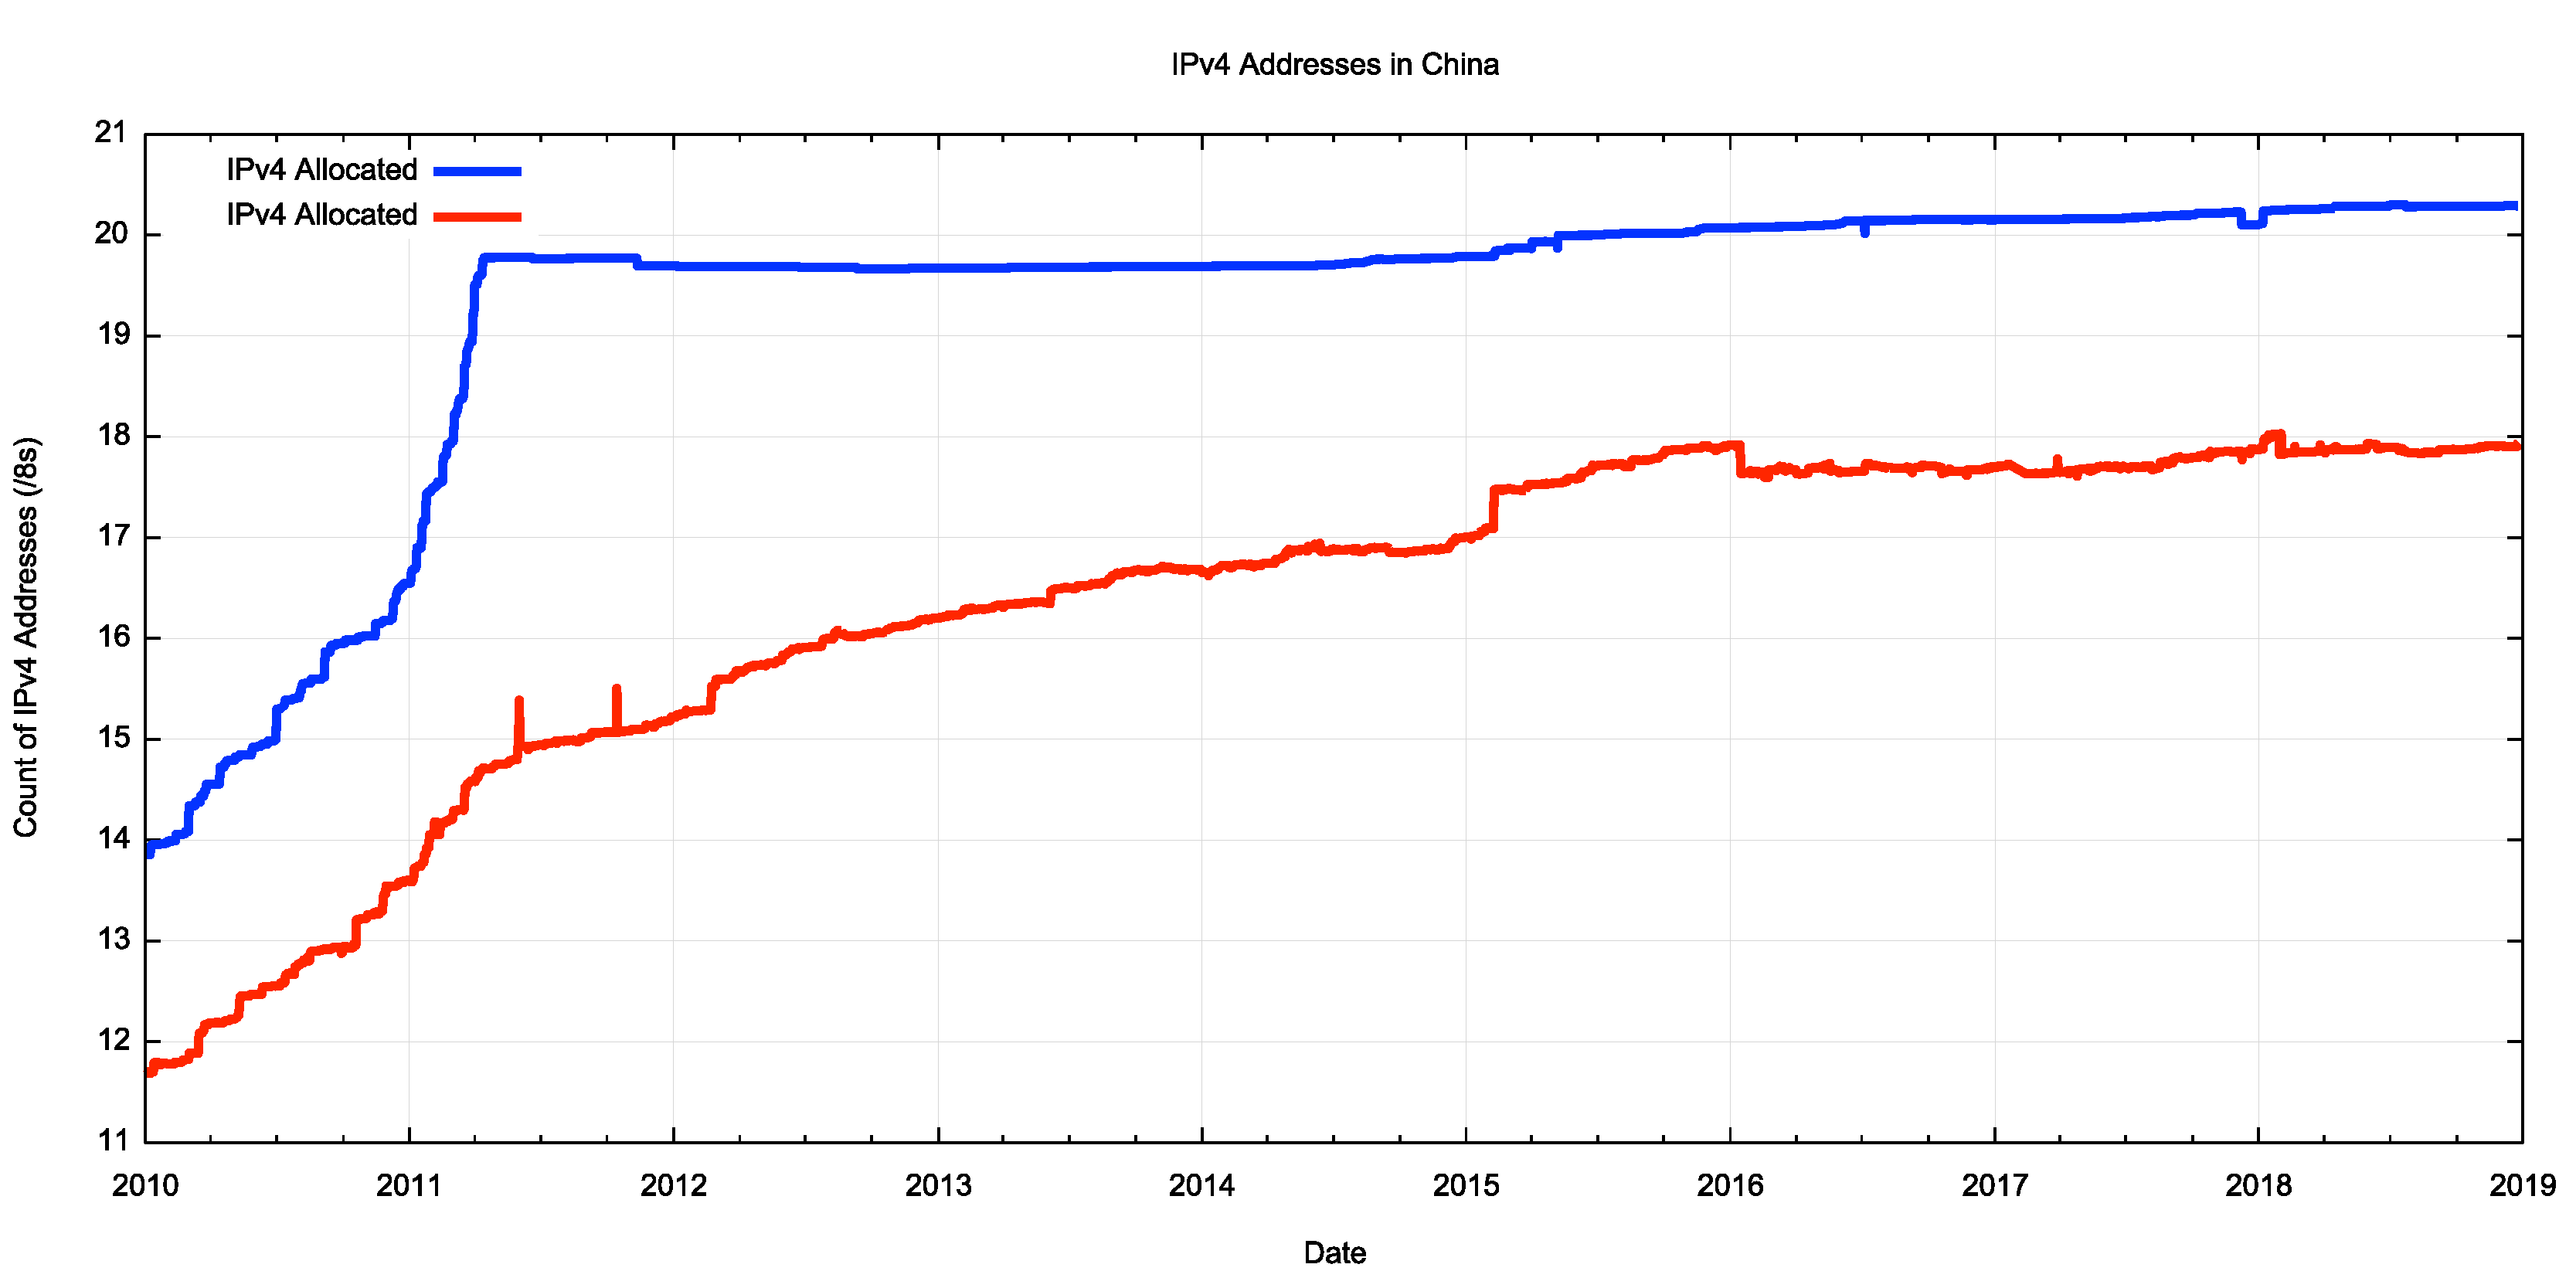
Figure 3 – IPv4 Address Allocations and BGP Advertisements in China – 2010-2018
Let’s compare this against the comparable record of the allocation and advertisement of IPv4 addresses in China (Figure 3). APNIC, the regional internet address registry that serves China recorded a significant level of address allocations in the three months preceding the exhaustion of the general use address pool in April 2011, with some 130 million IPv4 addresses being allocated to China entities in this period. The advertisement of these addresses into the routing system took some further time. At the start of 2010 some 85% of allocated IPv4 addresses were visible in the routing system. This dropped to 75% at the point of address exhaustion in May 2010. However, in the ensuring seven years this number has climbed to the current level of 90% of allocated addresses that are visible in the routing system. The unadvertised IPv4 address pool in China covers some 32 million addresses in total, although this number is slowly declining. The rise in the address holdings in China since 2014 is due to address trading, where there is a net influx of IPv4 addresses into China.
The comparable figure for IPv6 advertised addresses compared to the total allocated address pool is 49%, but this is not necessarily a comparison of similar items. IPv6 is not designed to be as intensively populated with connected host systems, as one of the rationales to head to a massively larger address space in IPv6 was to reduce, or even eliminate completely, the operators’ costs that are associated with achieving a very high address utilisation factor. Among other goals, IPv6 was intended to support a far lower, and cheaper, address utilisation ratio, so this 49% number as compared to 90% in IPv4 is consistent with this design objective.
In IPv4 growth of addresses in China has essentially ground to a halt since 2016. Any expansion in the size of the IPv4 Internet in China has to be achieved with address sharing using various forms of Network Address Translation (NATs). Unfortunately, there is no public data on the level of NAT use in China or anywhere else for that matter, but the population numbers speak for themselves. Some 301 million IPv4 addresses serve some 741 million users. Some users may well have multiple connected devices, while others may share a single connected device, but it would not be unreasonable to estimate that the device population in China exceeds 1 billion devices, which means that the average IPv4 sharing ratio is around 3 devices per public IPv4 address.
While the China IPv4 network ceased any major expansion in early 2016, when the last of the large IPv4 address blocks was deployed into the network, there has been a lag in the deployment of IPv6 into these networks. As is evident in Figure 2, IPv6 deployment activity in China stepped up only in early 2018, and the major expansion of the IPv6 network in terms of advertised addresses occurred in October 2018.
It would be useful to complement this picture of IPv6 deployment in China from Internet Registry data with data gathered from public networks. Who is publishing measurements of use of IPv6 in China?
Facebook Measurements
Facebook publish a set of measurements on IPv6 adoption. The measurement is a measure of traffic volume seen by Facebook servers, and presumably counts the proportion of traffic that is passed over IPv6 as a proportion of the total traffic volumes served from Facebook servers. Facebook report both a total volume, which is some 25% of Facebook’s total traffic as of the end of December 2018, and per country volumes. The data for IPv6 is available from the “Adoption by Country” reports at Facebook. The plot of the IPv6 data for 2018 is shown in Figure 4.
There are a few points of comment about this data.
The first comment is that the China IPv6 traffic proportion, rising from a low of 0.5% in mid-2018 to 2.5% at the end of the year, is still very low.
A likely explanation may well be in the second comment, namely that Facebook is not normally accessible from within China (see this presentation of an account on one such experience).
It is possible that Facebook users in China might be using some form of VPN tool, and also likely that the VPN tools that are being used are IPv4-only.
It is curious that for the first couple of months in early 2018 the IPv6 traffic proportion dropped by 2/3, and remained at relatively low levels until August 2018, when it rose significantly to reach 2.5% by the end of the year. The sudden changes noted in May, and again in July, are more likely to occur when using a small data set, so it’s reasonable to guess that the underlying traffic volumes that lie behind this report are relatively small.
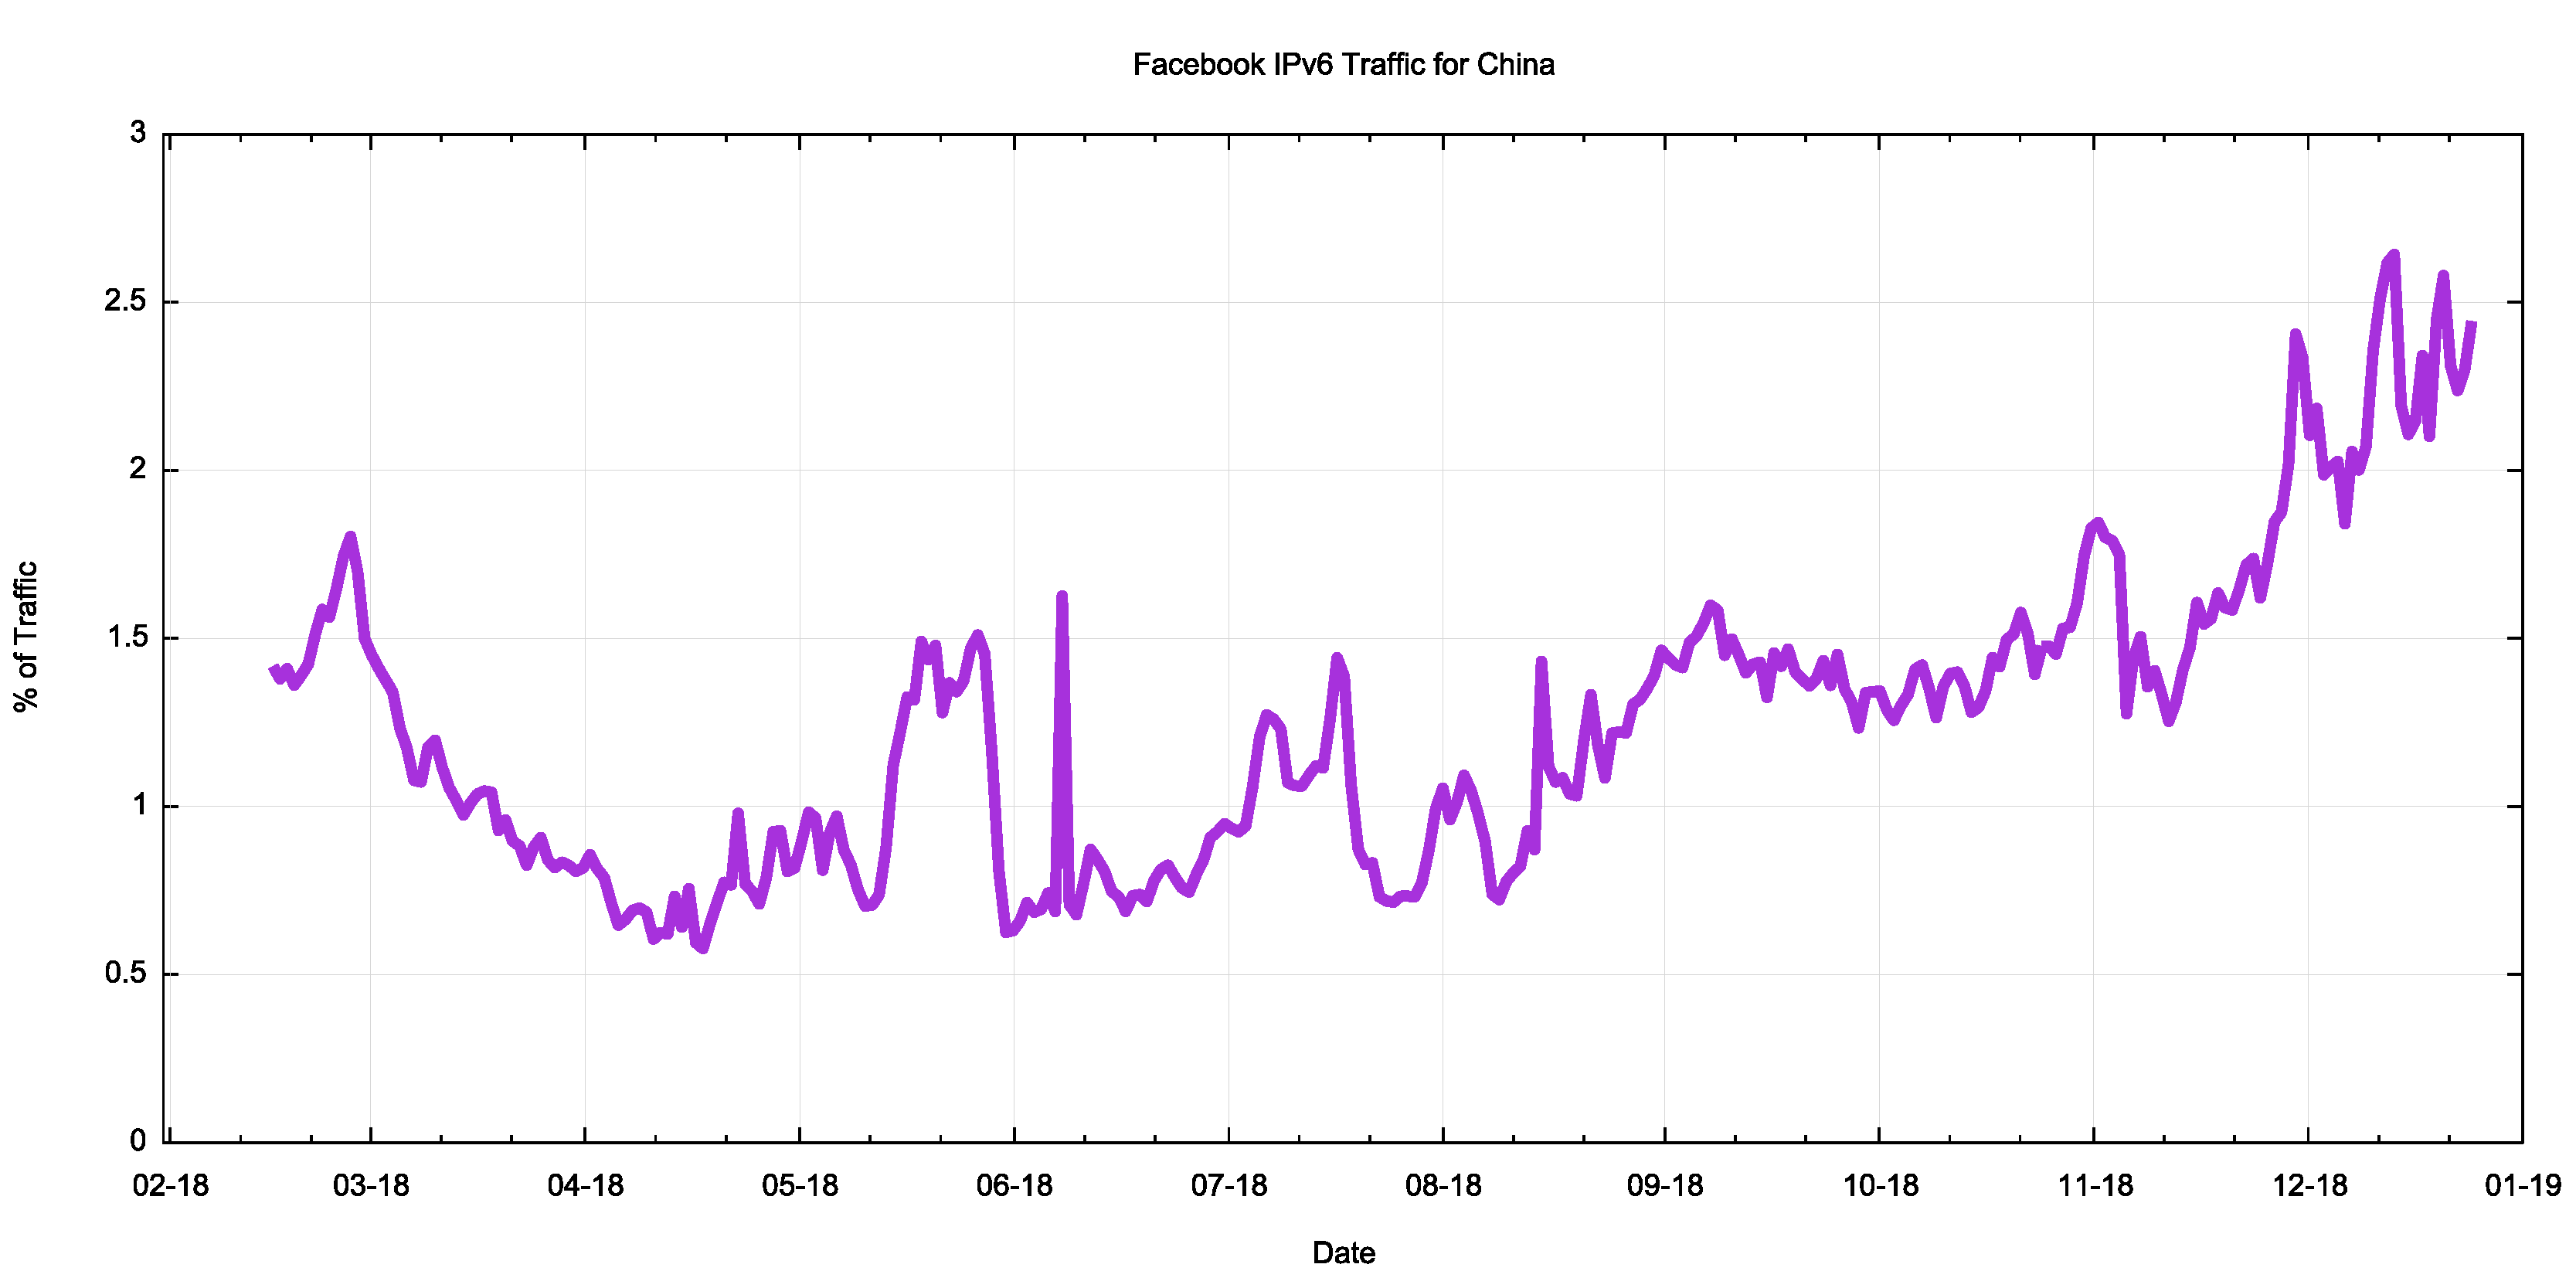
Figure 4 – Facebook report of proportion of IPv6 in Facebook traffic to China for 2018
In any case, as Facebook is reportedly not generally available within China, it’s likely that this measurement of 2.4% of traffic being IPv6 is not necessarily reflective of the broader picture of IP infrastructure within China.
Google Measurements
Google have a similar measurement page. Google reports that their numbers report on “the percentage of users that access Google over IPv6”.
The total Internet-wide user proportion, as measured by Google, is that some 22% of weekday users access Google using IPv6, while the weekend numbers rise to 26%. Without a clear understanding of the exact composition of the user populations that are measured in this way it is still reasonable to conclude that consumer services have a higher level of use of IPv6 than the corporate and enterprise service world.
Google report the current level of IPv6 use per country, and at the end of December Google reported some 3.37% of users in China used IPv6 to access Google (Figure 5).
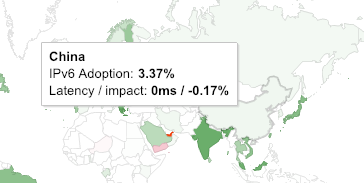
Figure 5 – Google report of IPv6 in China
While Google only publish daily reports, a useful time series of these daily measurements has been assembled by Eric Vyncke and a plot of this data is shown in Figure 6. It is not clear how popular Google is in China, particularly given that Google has formally withdrawn from the Chinese market. As with the Facebook data there are some unexpected rapid changes in the reported data, such as the rise and then collapse in early 2016 and then the rapid rise in early 2017. The pattern of the data in 2018 is consistent with that reported by Facebook, with a drop in the first part of the year and then a rise in the latter party, but while in the Facebook data we see the rise to be greater than the level at the start of the year, the Google data reports a 3.3% level at the end of the year, lower than the 4.2% level in the early part of the year.
It is entirely possible that the Google data reflects only a small set of Chinese users, and, like the Facebook data, this may not be reflective of the larger picture of Chinese IPv6 deployment.

Figure 6 – Time series of Google’s reports of IPv6 in China (data assembled by Eric Vynke)
Akamai Measurements
Akamai provide content distribution services to many online service providers, and they operate points of presence in many countries. Akamai publish a “State of the Internet” report that includes a measurement of their calculation of the proportion of Chinese users that use IPv6 to access Akamai services. They report an IPv6 rate of 4.6% as of the end of 2018 (Figure 7)
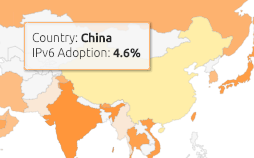
Figure 7 – Akamai report of IPv6 in China
As with the Google data, a time series of these daily measurements has been assembled by Eric Vyncke and a plot of this data is shown in Figure 8.
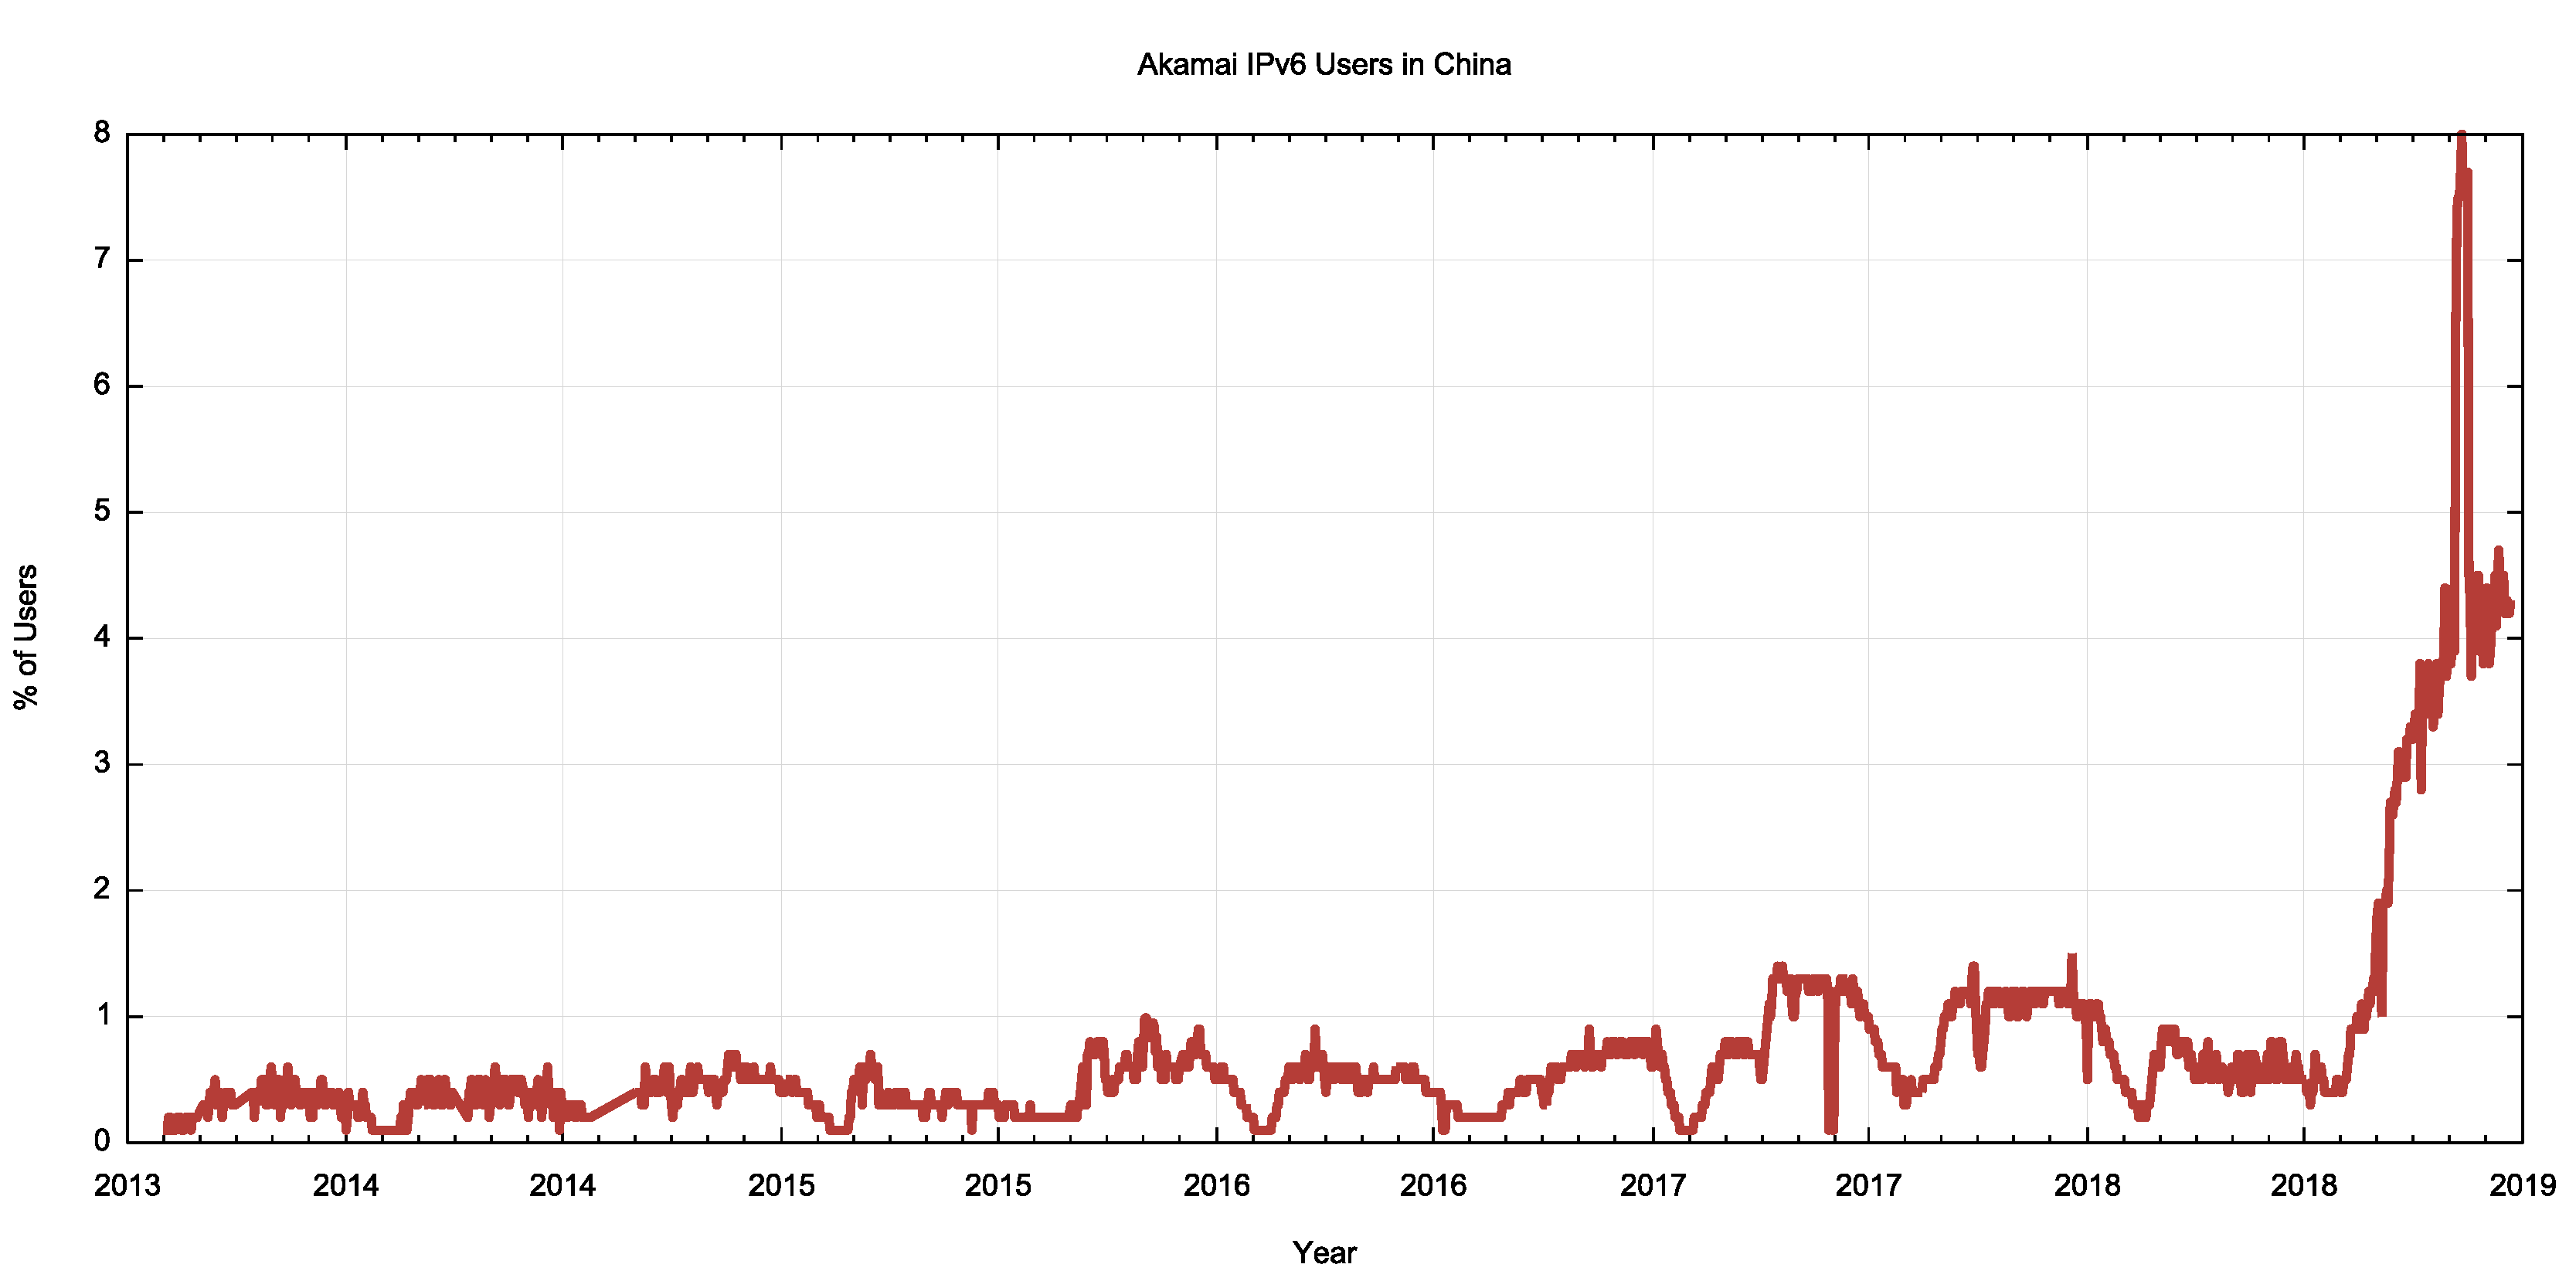
Figure 8 – Time series of Akamai’s reports of IPv6 in China (data assembled by Eric Vynke)
This data has some level of correlation with the IPv6 advertised address time series in Figure 2. However, in this case there is a very pronounced change across 2018, with the end of year data measuring IPv6 use in China at 4.5%. The overall consistency of the data in the preceding years points to the likely use of a larger measurement population than Google and Facebook, which makes the pronounced spike of 8% in mid-2018 all the more curious.
Akamai are not the only network reporting this anomaly. Cloudflare reported a similar spike in IPv6 use from AS9898 (China Mobile Guandong) at around the same time, so this spike may reflect some form of short-term test of IPv6 in one or more Chinese networks.
APNIC Measurements
APNIC has been performing measurements of IPv6 adoption using a measurement script embedded in an online advertisement campaign. When the ad is delivered to the browser an embedded script is activated. This script directs the browser to perform a fetch of a dual stack URL, an IPv4-only URL and an IPv6-only URL, all served by a common server operated by APNIC (this server is located in Singapore for Chinese users). The server is then able to report on the IPv6 capability of the users that run this measurement script.
We use the server data to measure the number of Chinese users who can retrieve the IPv6 URL. The time series of the daily totals is shown in Figure 9. The current level of IPv6 in China has been recorded at some 7% in this data set.
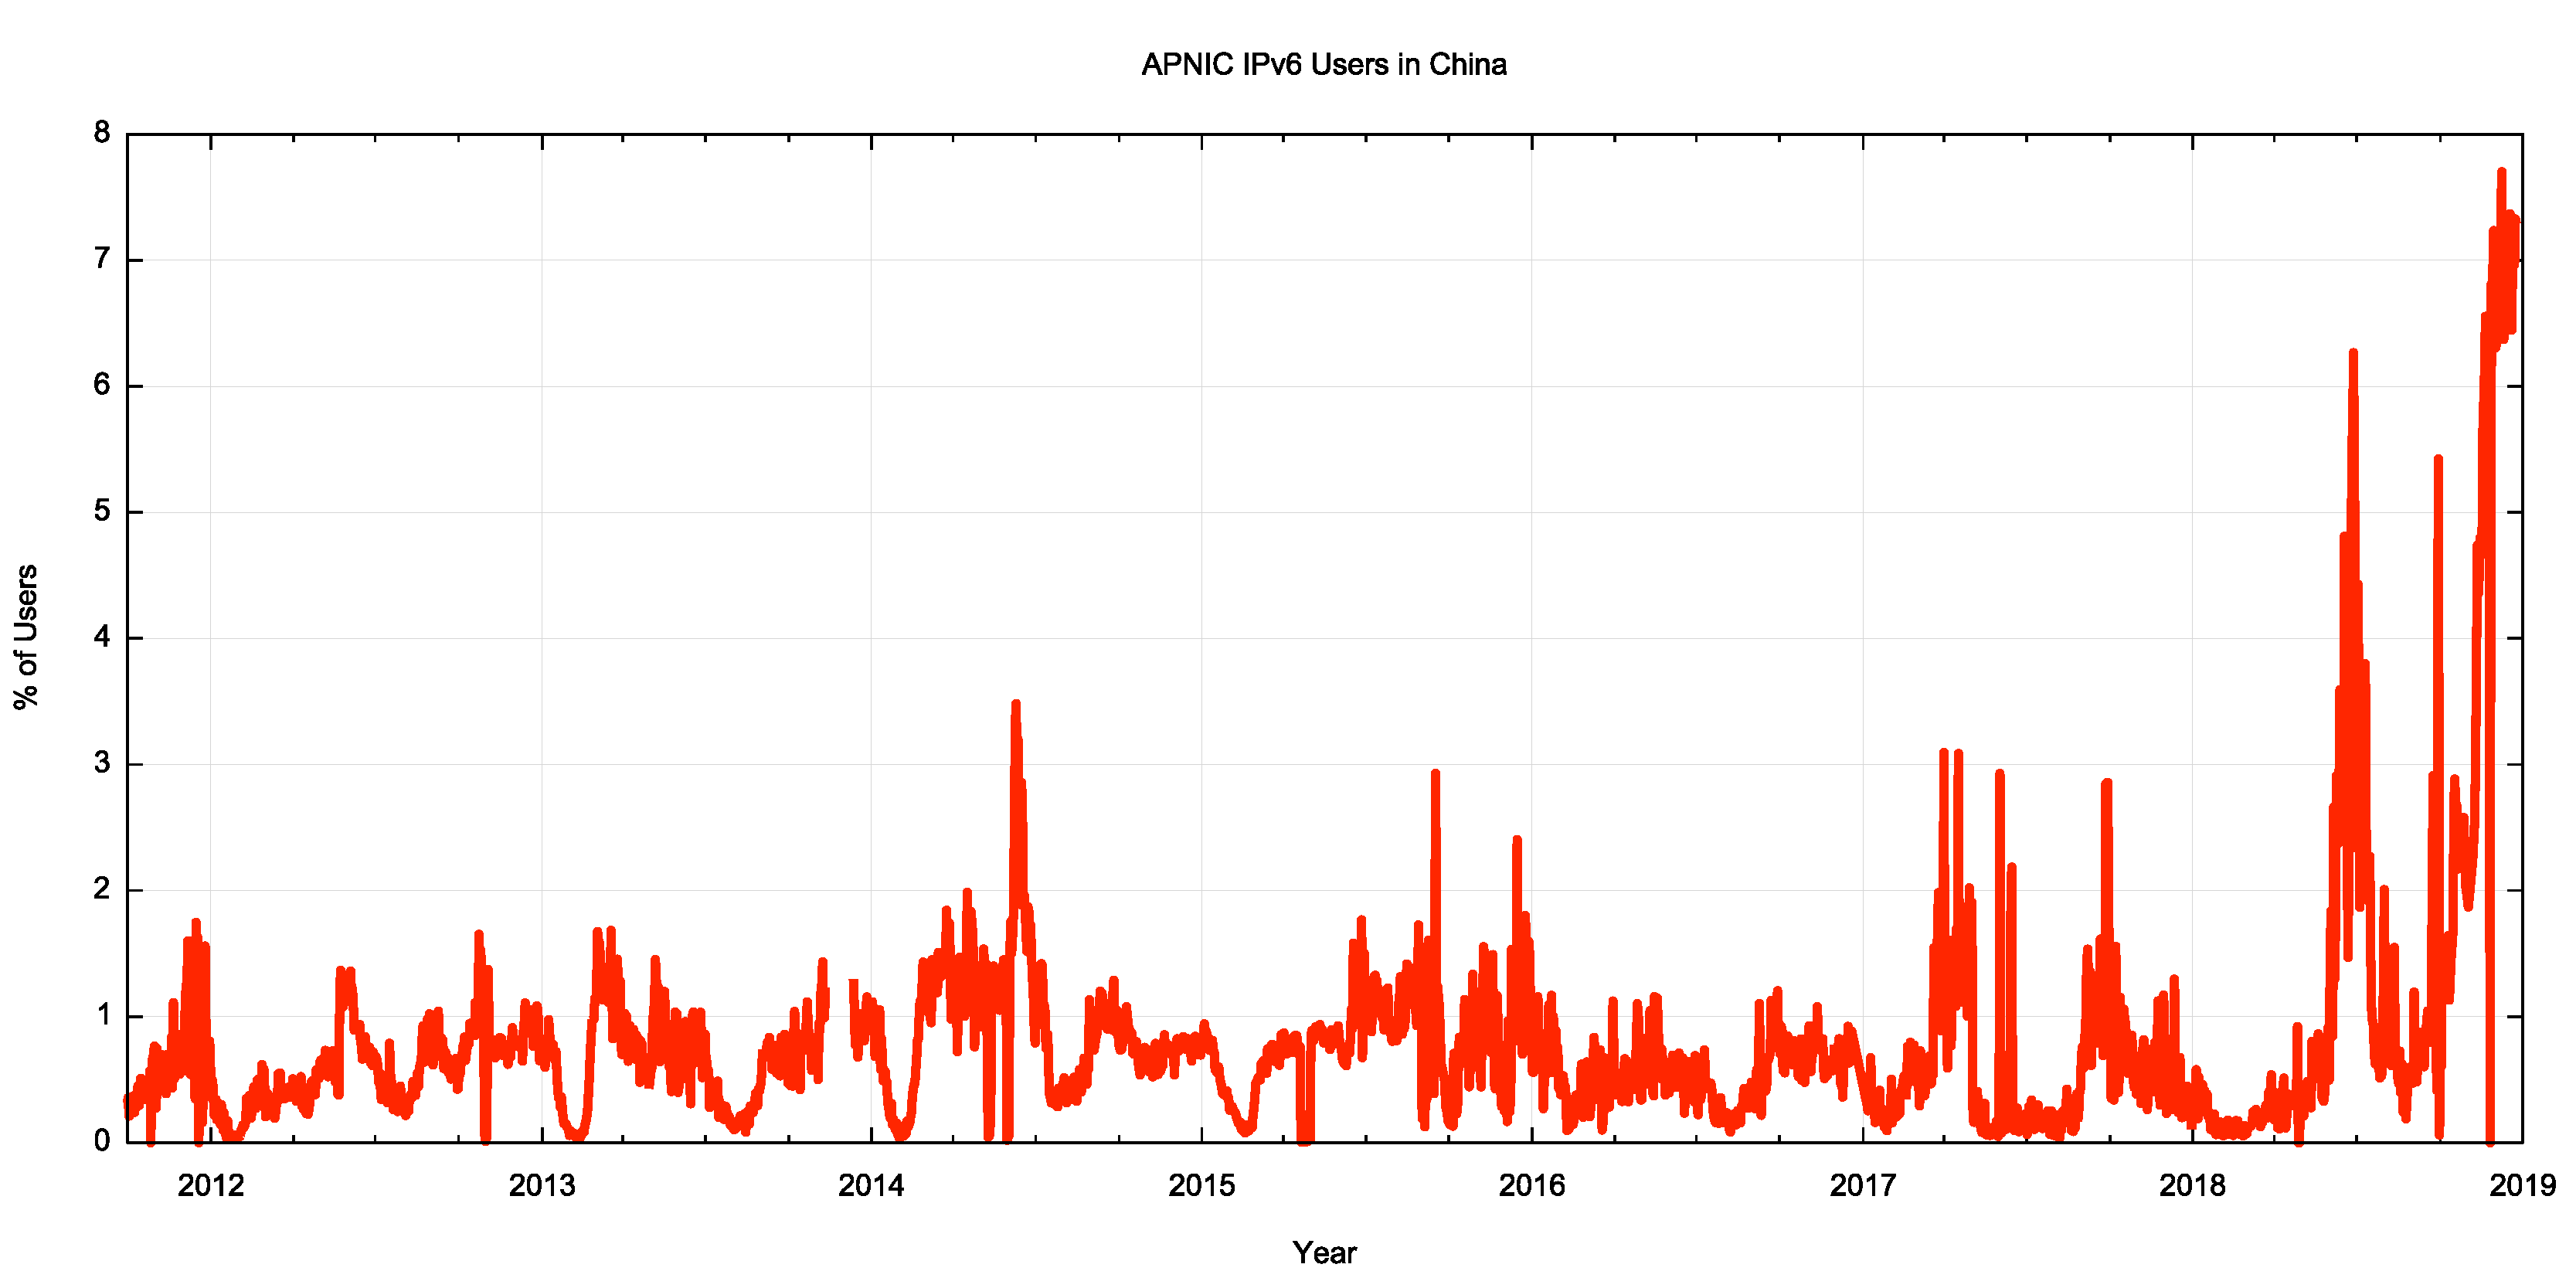
Figure 9 – Time series of APNIC measurements of IPv6 in China
The overall shape of the data is similar to that of Akamai’s data, namely a relatively small measurement of around 1% until mid-2018. There was a sharp spike in the data in July 2018, and then a pronounced increase in the level of IPv6 commencing in October 2018, currently sitting at some 7% of users.
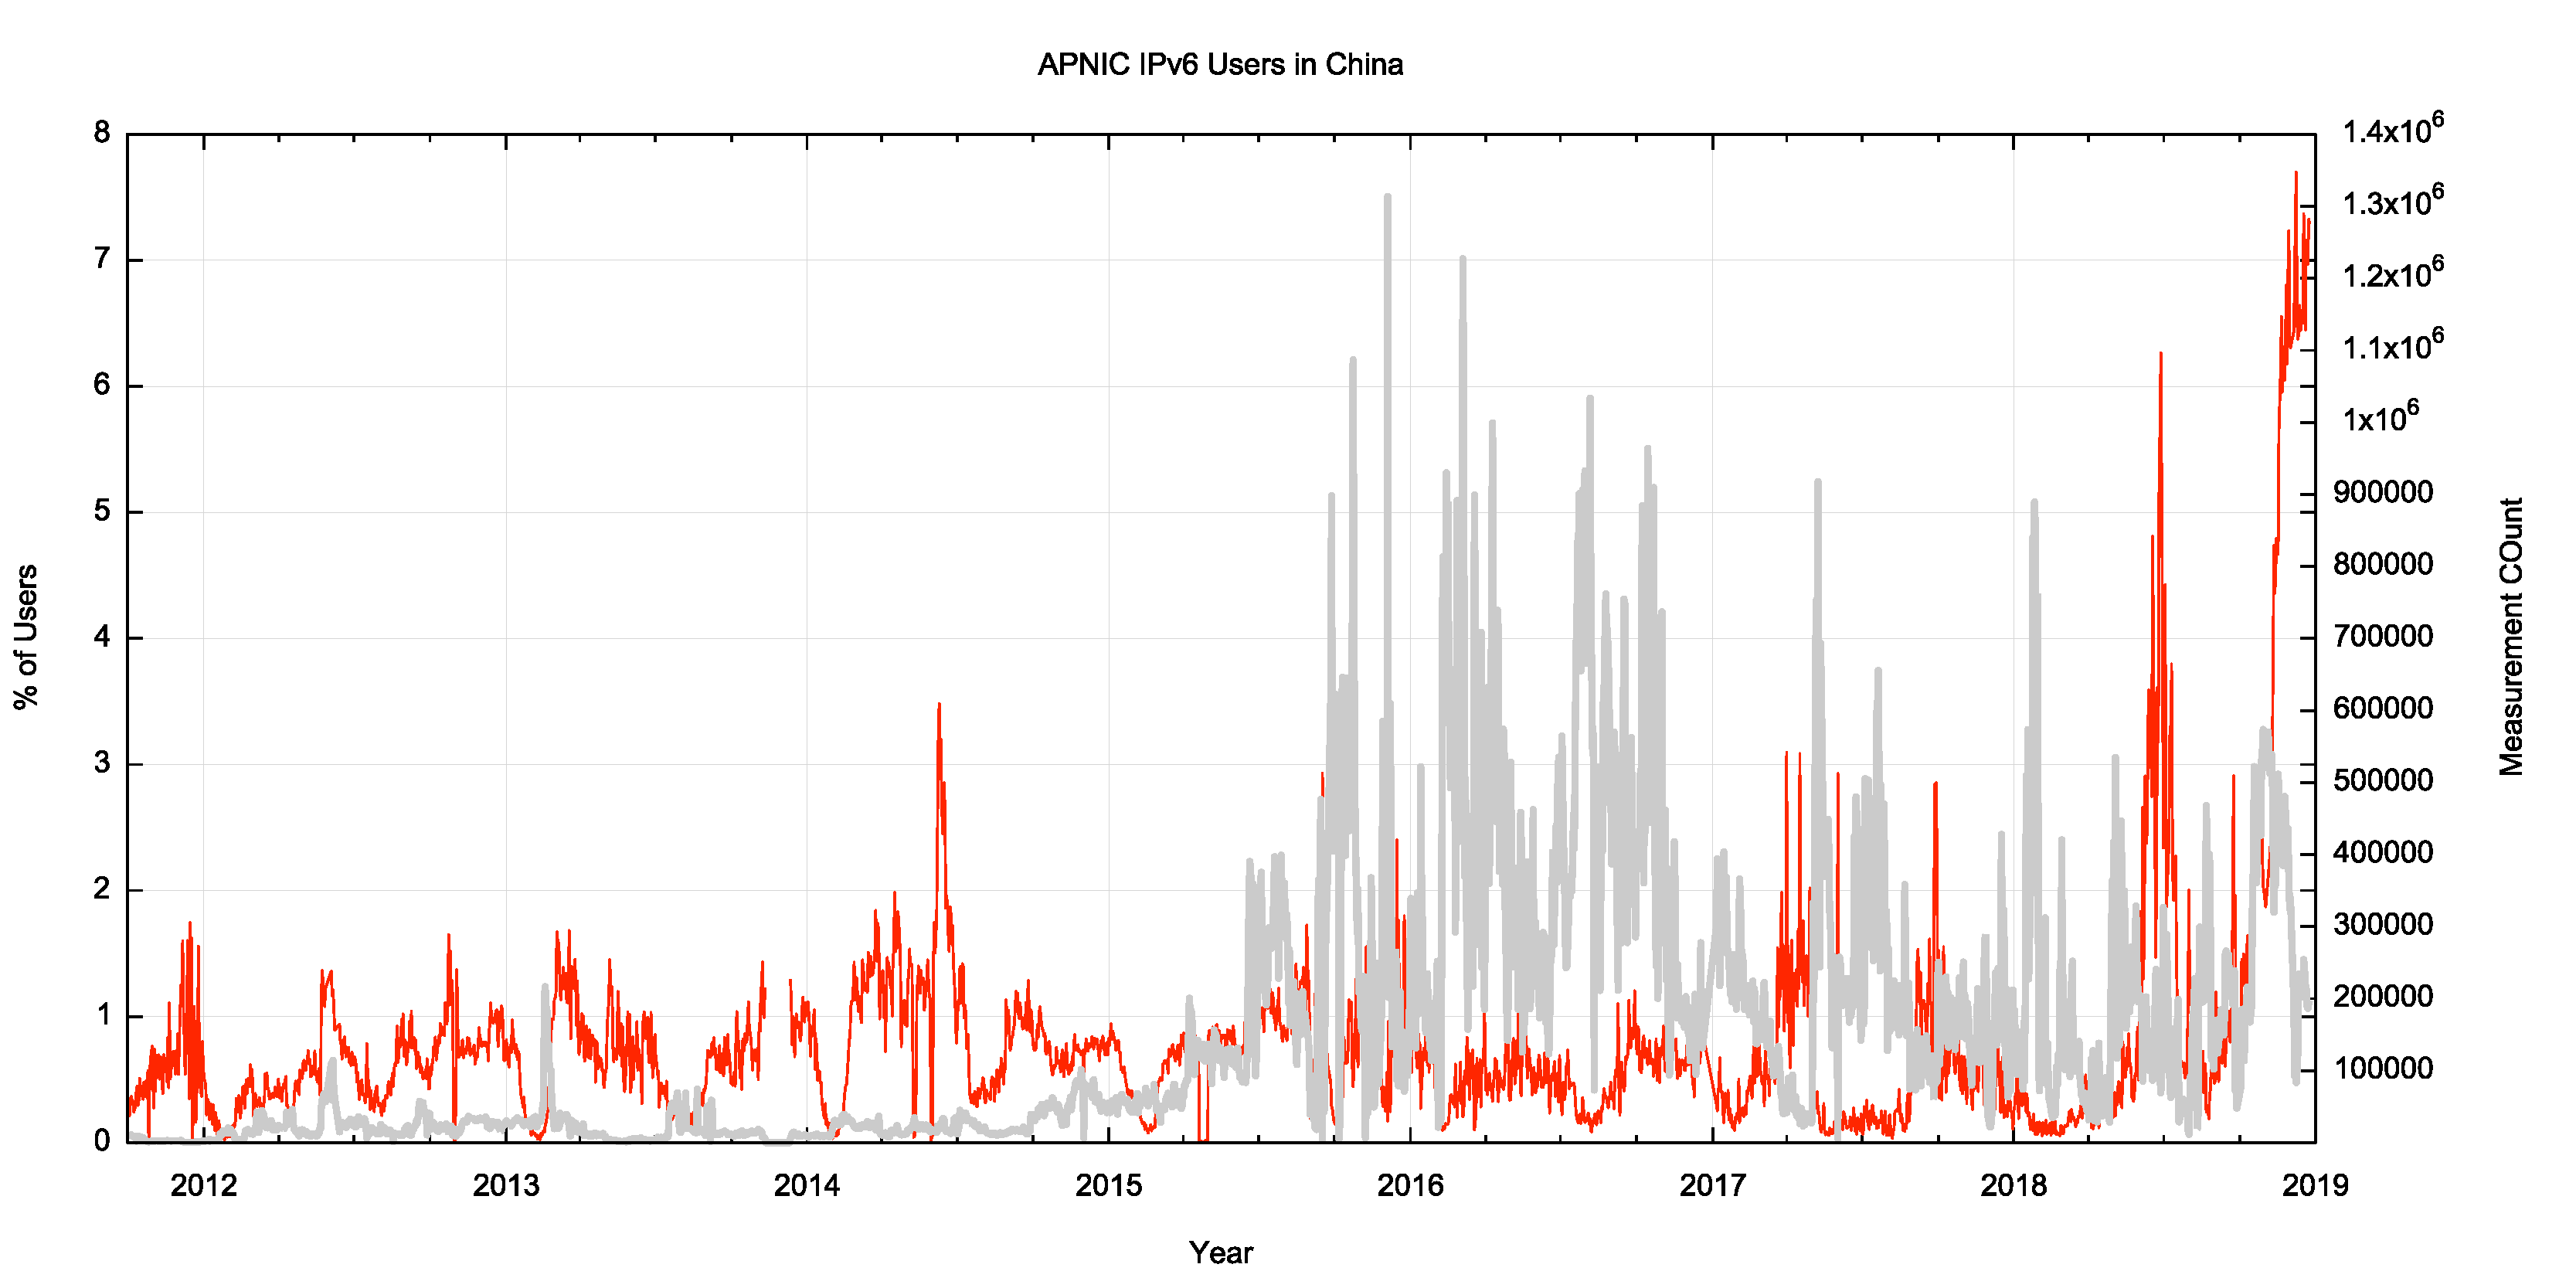
Figure 10 – Ad impression count of APNIC measurements of IPv6 in China
Ad campaign management has a large number of variable factors, as ad placement is influenced by other concurrent ad campaigns as well as the popularity of the apps that embed online ads. The result is that the daily volumes of ad presentations has considerable levels of variation, and Figure 10 shows the daily ad impression count of placements in China superimposed upon the IPv6 measurement. The measurement count of ads placed with Chinese end points was increased in late 2015 and has varied between one hundred thousand to over one million ad impressions per day since then.
The measurement server for this measurement test is located in Singapore. The question has been asked as to whether the data would different if the data collection point was located within China. Is there a larger pool of IPv6 users within China that are unable to make IPv6 connections to points outside of China? To answer this question, we’ve been assisted with a data collection point located within China and performed the same URL tests to a server located inside China. This has allowed us to collect a view of IPv6 within China from a vantage point within China and a view from outside China.
The results of this comparison are shown in Figure 11.
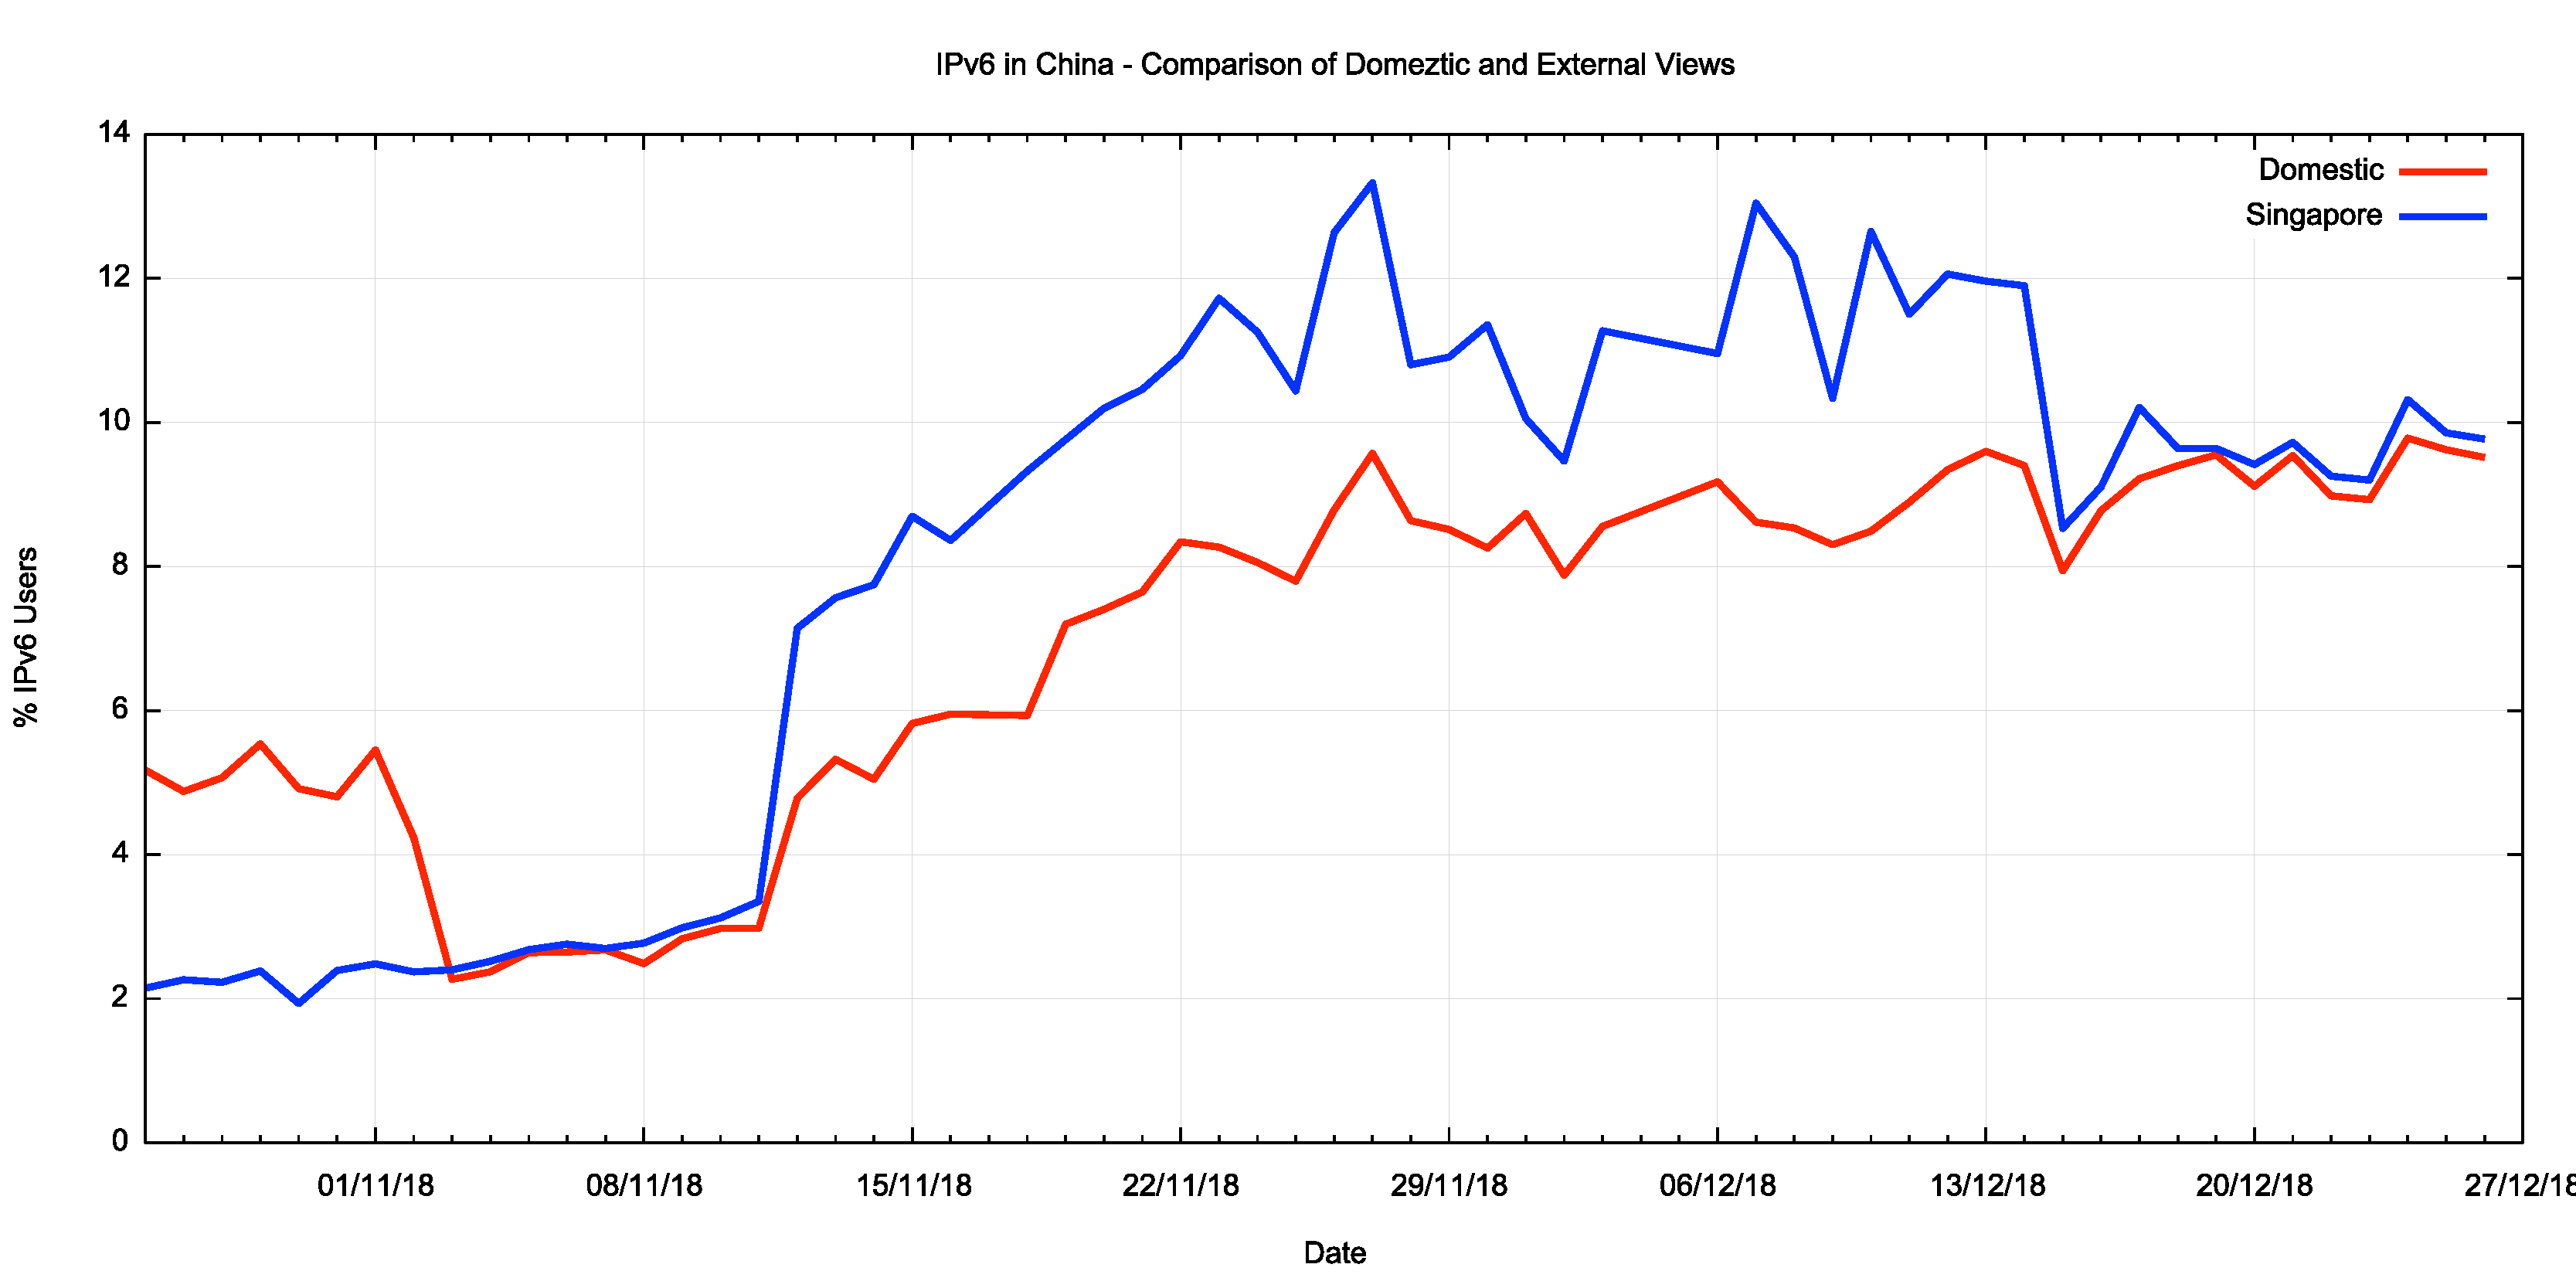
Figure 11 – Comparison of Domestic and External views of IPv6 in China
The differences in the two views at the end of October and again across November and December appear to be related to server overload factors at the Singapore location, which caused a disproportionate drop in IPv4 URL requests from Singapore. This condition was addressed in mod-December and the IPv6 measurement is consistent at both server locations. It is also interesting that both servers in this campaign report an IPv6 measurement of close to 10% in the last week of December, some 2 – 3% greater than that seen from the larger worldwide ad campaign.
Internally China has organised its ISPs along different lines to many other economies. Rather than each ISP enterprise using a single network with a single Autonomous System identifier, many Chinese ISPs have further divided the administrative view of their networks into regional networks. This is particularly so for China Unicom and China Mobile. If we look at China through the lens of Autonomous Systems, and view each of these regional networks as a network in its own right then there are 32 networks with an estimated customer base of 1 million users or more, and a further 26 networks with an estimated base on between 100,000 and 1 million users (the full table of estimates of user’s per network is reported here).
One of these networks has been supporting IPv6 for many years, namely the China Education and Research Network (CERNET), AS 4538. With some variation, potentially due to variations in the measurement environment as much as variations in the network itself, the IPv6 use rate of that network has been around 30% for many years (Figure 12).

Figure 12 – IPv6 in AS4538 – CERNET
In most of the other cases where we are looking at the IPv6 efforts of various public ISPs the deployment of IPv6 has occurred in recent months, which is an observation that is consistent with the address measurements and consistent with the Akamai data.
Notably, many regional networks within the China Mobile group have been undertaking IPv6 deployment. A good example is the network that Cloudflare observed in July 2018, AS9808. Guandong Mobile. In this network large scale IPv6 deployment appeared to start with trials in September and October 2018 and then a larger deployment exercise took place across November 2018. By the end of 2018 the IPv6 deployment level in this network is some 15% (Figure 13).
The spike on the 5th December is a measurement artefact, and not related to any activity by this network.
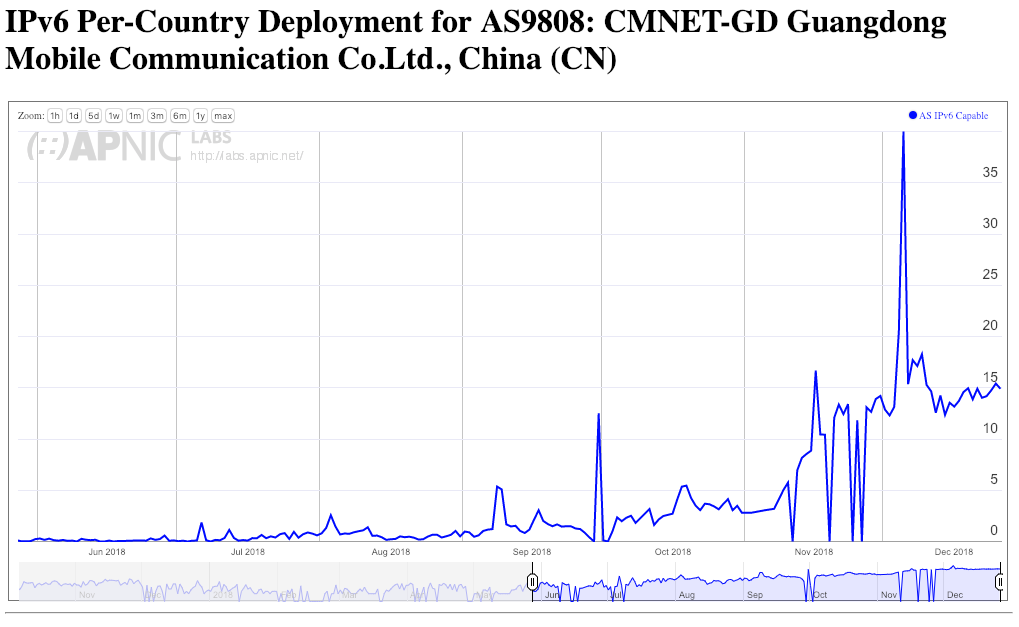
Figure 13 – IPv6 in AS9808 – China Mobile Guandong
A similar picture is evident with AS56048, China Mobile Beijing, with IPv6 trials in June, July and August, followed by large scale deployment taking place in November 2018. This network’s current deployment level encompasses some 25% of their estimated user base of some 12 million customers (Figure 14). Again the zero points in November and December are measurement artefacts and not related to any changes in this network.
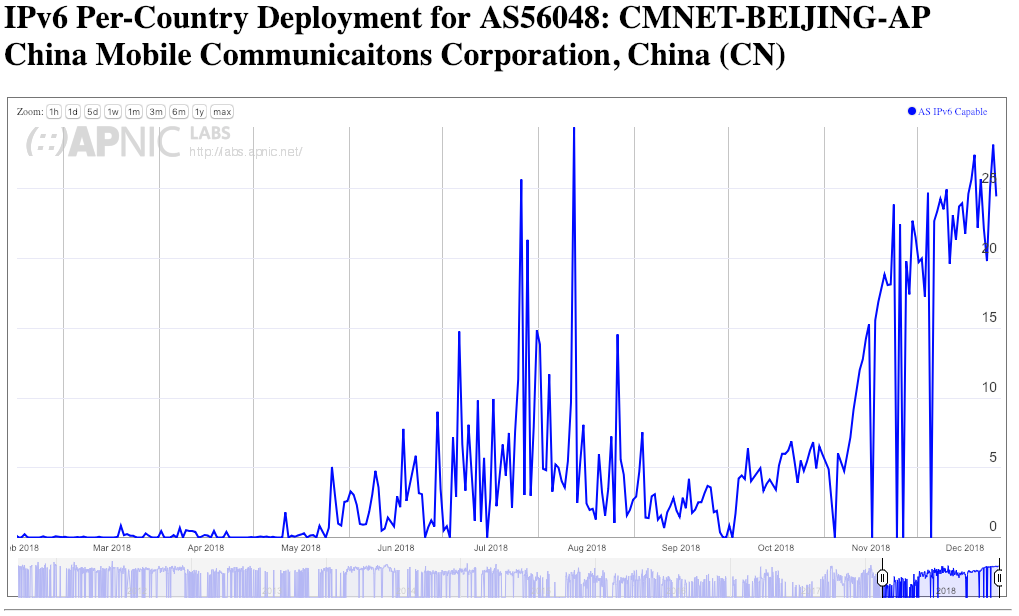
Figure 14 – IPv6 in AS56048 – China Mobile Beijing
Another member of the China Mobile group with a similar picture of very recent deployment of IPv6 is AS56047, China Mobile Huanan (Figure 15).
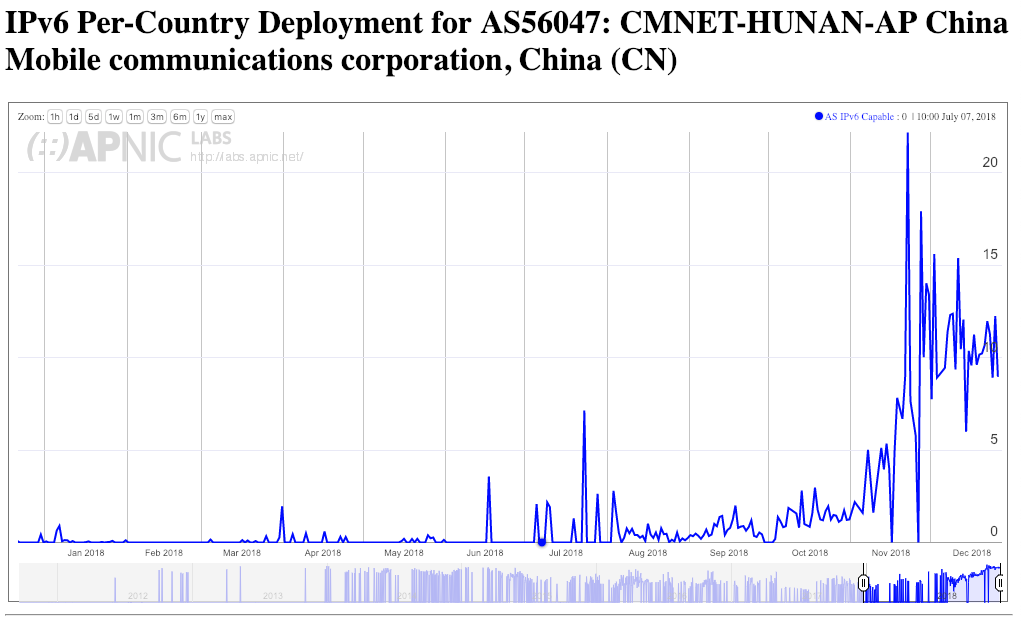
Figure 15 – IPv6 in AS56047 – China Mobile Huanan
And finally, what about China’s largest ISP? I’m referring to the Chinanet Backbone network, AS4134. This network is the largest network in China in terms of customers, with an estimated base of 300 million users. There is some visible movement with IPv6 deployment in this network, again commencing in November 2018. It should be noted that even at just 5% of their user base this network has deployed IPv6 services across 15 million customers, which is a commendable achievement (Figure 15).
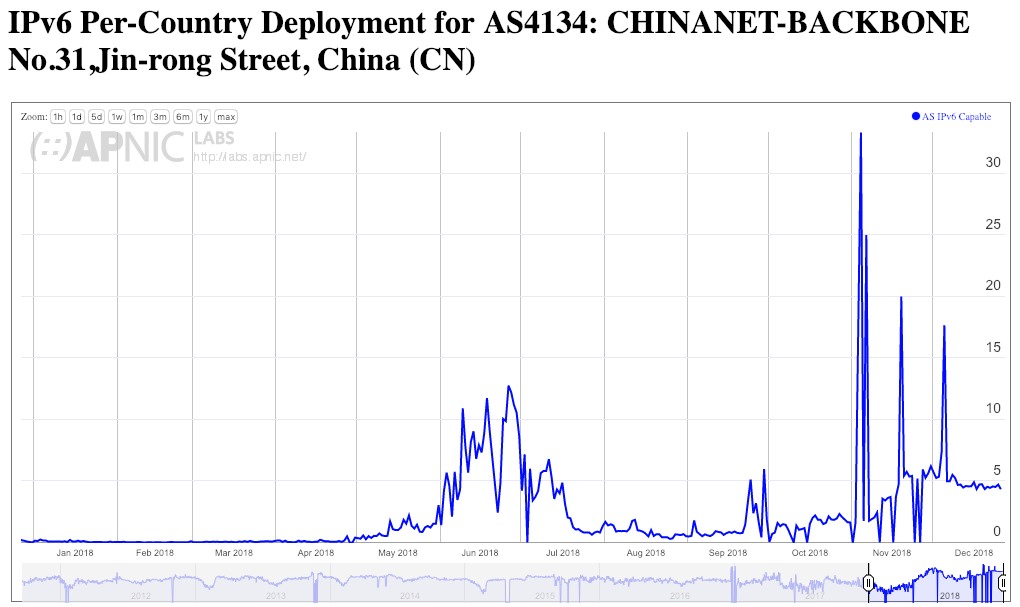
Figure 16 – IPv6 in AS4134 – ChinaNet Backbone
Performance Quality of the IPv6 Service in China
The APNIC measurement system permit two further measurements, namely connection failure and a comparison of IPv4 vs IPv6 round trip times.
The connection loss is calculated by looking at the TCP three-way handshake that occurs between the client system and the server when opening up an HTTP session to retrieve the URL. TCP commences with the client sending the server a TCP packet with the SYN flag set. The server responds with a packet with the SYN and ACK flags set, and the client completes the connection by sending a TCP packet with the ACK flag set.
A failed connection is defined as one where the server receives the initial TCP SYN packet, and sends the SYN/ACK response, but it never receives the final ACK. The most likely reason for these failed connectionsis local firewalls and filters. It is common for firewalls to permit all forms of outbound packets but examine and filter incoming packets. If the filters were configured on the basis of an IPv4-only service then incoming IPv6 packets, including these SYN/ACK responses will be dropped by such a firewall. Such a firewall configuration will always fail a IPv6 connection attempt.
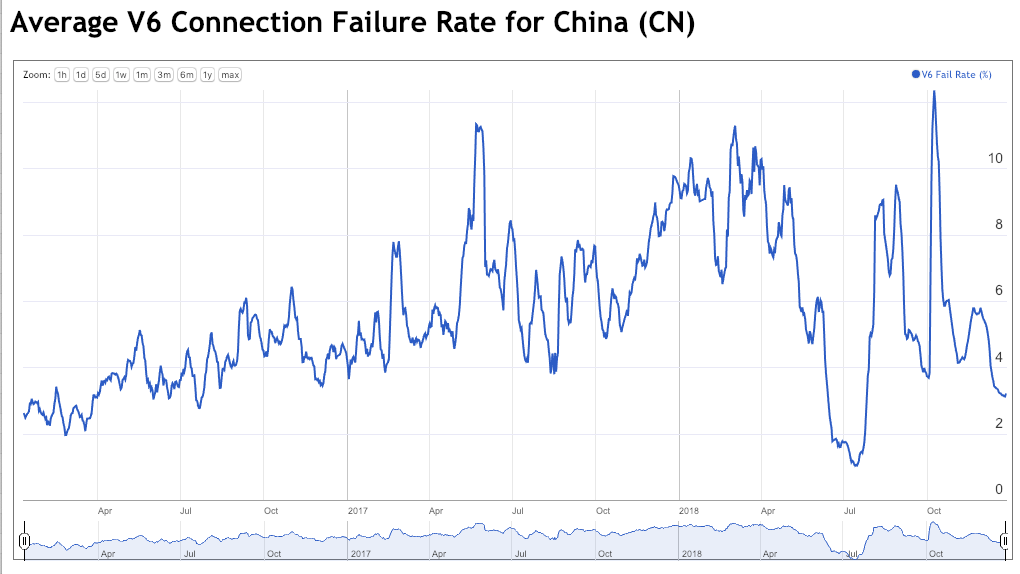
Figure 17 – IPv6 connection failure rate for China
The average IPv6 connection failure rate for the Internet is some 1%, so even the most recent value of 3% seen for IPv6 in China is well above this global average. Averages hide the variations visible in each network, and some Chinese networks are reporting very high IPv6 failure rates. The highest is AS 134543, China Unicom Guandong, which is reporting connection failure rate of up to 60% of attempted IPv6 connections. The largest network, AS4134, Chinanet Backbone, with a 15 million strong base of IPv6 clients is reporting a 4% loss rate. That’s a staggering 600,000 users who are experiencing dropped IPv6 connections. This is a significant failure rate.
The other measurement is comparing the connection round-trip time between IPv4 and IPv6 when we measure a dual-stack endpoint (Figure 18)
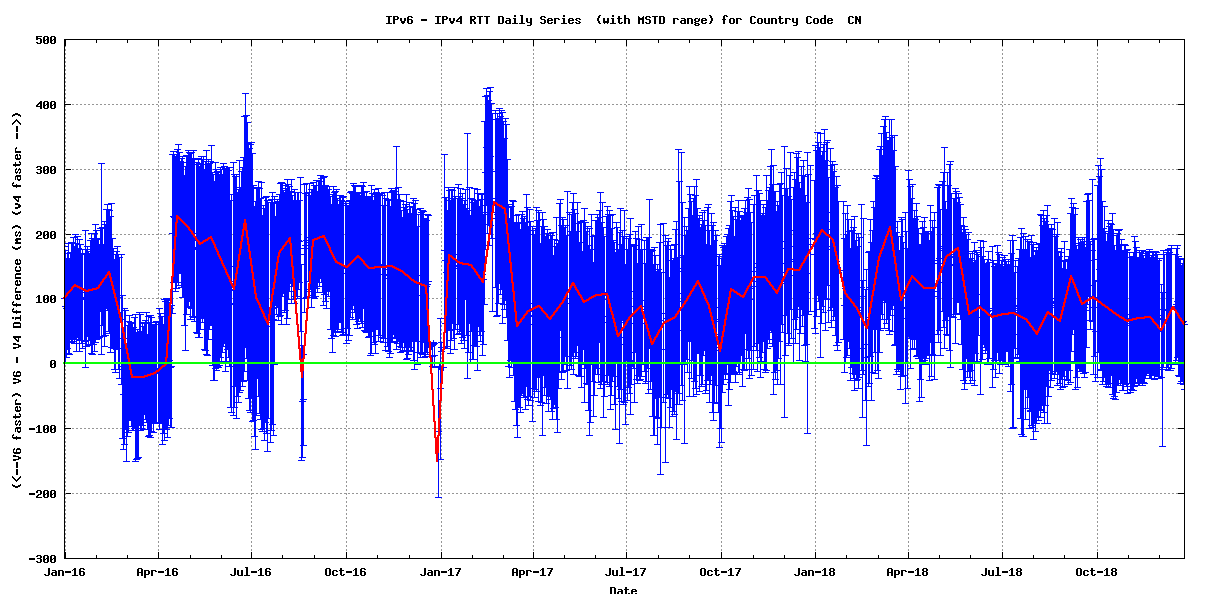
Figure 18 – RTT comparison between IPv6 and IPv4 for China
If a user has a dual stack connected device the measurement script will get the user to retrieve a web object using IPv4 and again using IPv6 from the same physical server. By looking at the TCP handshakes in these two protocols we then have 2 round-trip time measurements between the same two endpoints, using IPv4 and IPv6. As seen by the APNIC server in Singapore, IPv6 connections take an average of some 70ms longer to connect to the server as compared to the IPv4 connection from the same endpoint. This points to asymmetric routing, where IPv6 routes are not handled identically to IPv4 routes, and in particular the path to Singapore appears, might take an extended path across the Pacific Ocean and back to reach Singapore, which the equivalent IPv4 path appears to be a direct north-south connection for most ISPs. This is not the case for all ISPs, and the mean standard deviation of the sample points is some 80ms. This means that different networks use different external routing configurations and this means that some networks show a better RTT performance between China and Singapore over IPv6 as compared to IPv4. AS5837, China Unicom Backbone, reports an IPv6 RTT to Singapore which is 25ms faster than the IPv4 RTT.
What happens to these numbers when we look at connections that are terminated by a server located within China? Figure 19 shows the connection failure rate for this server.
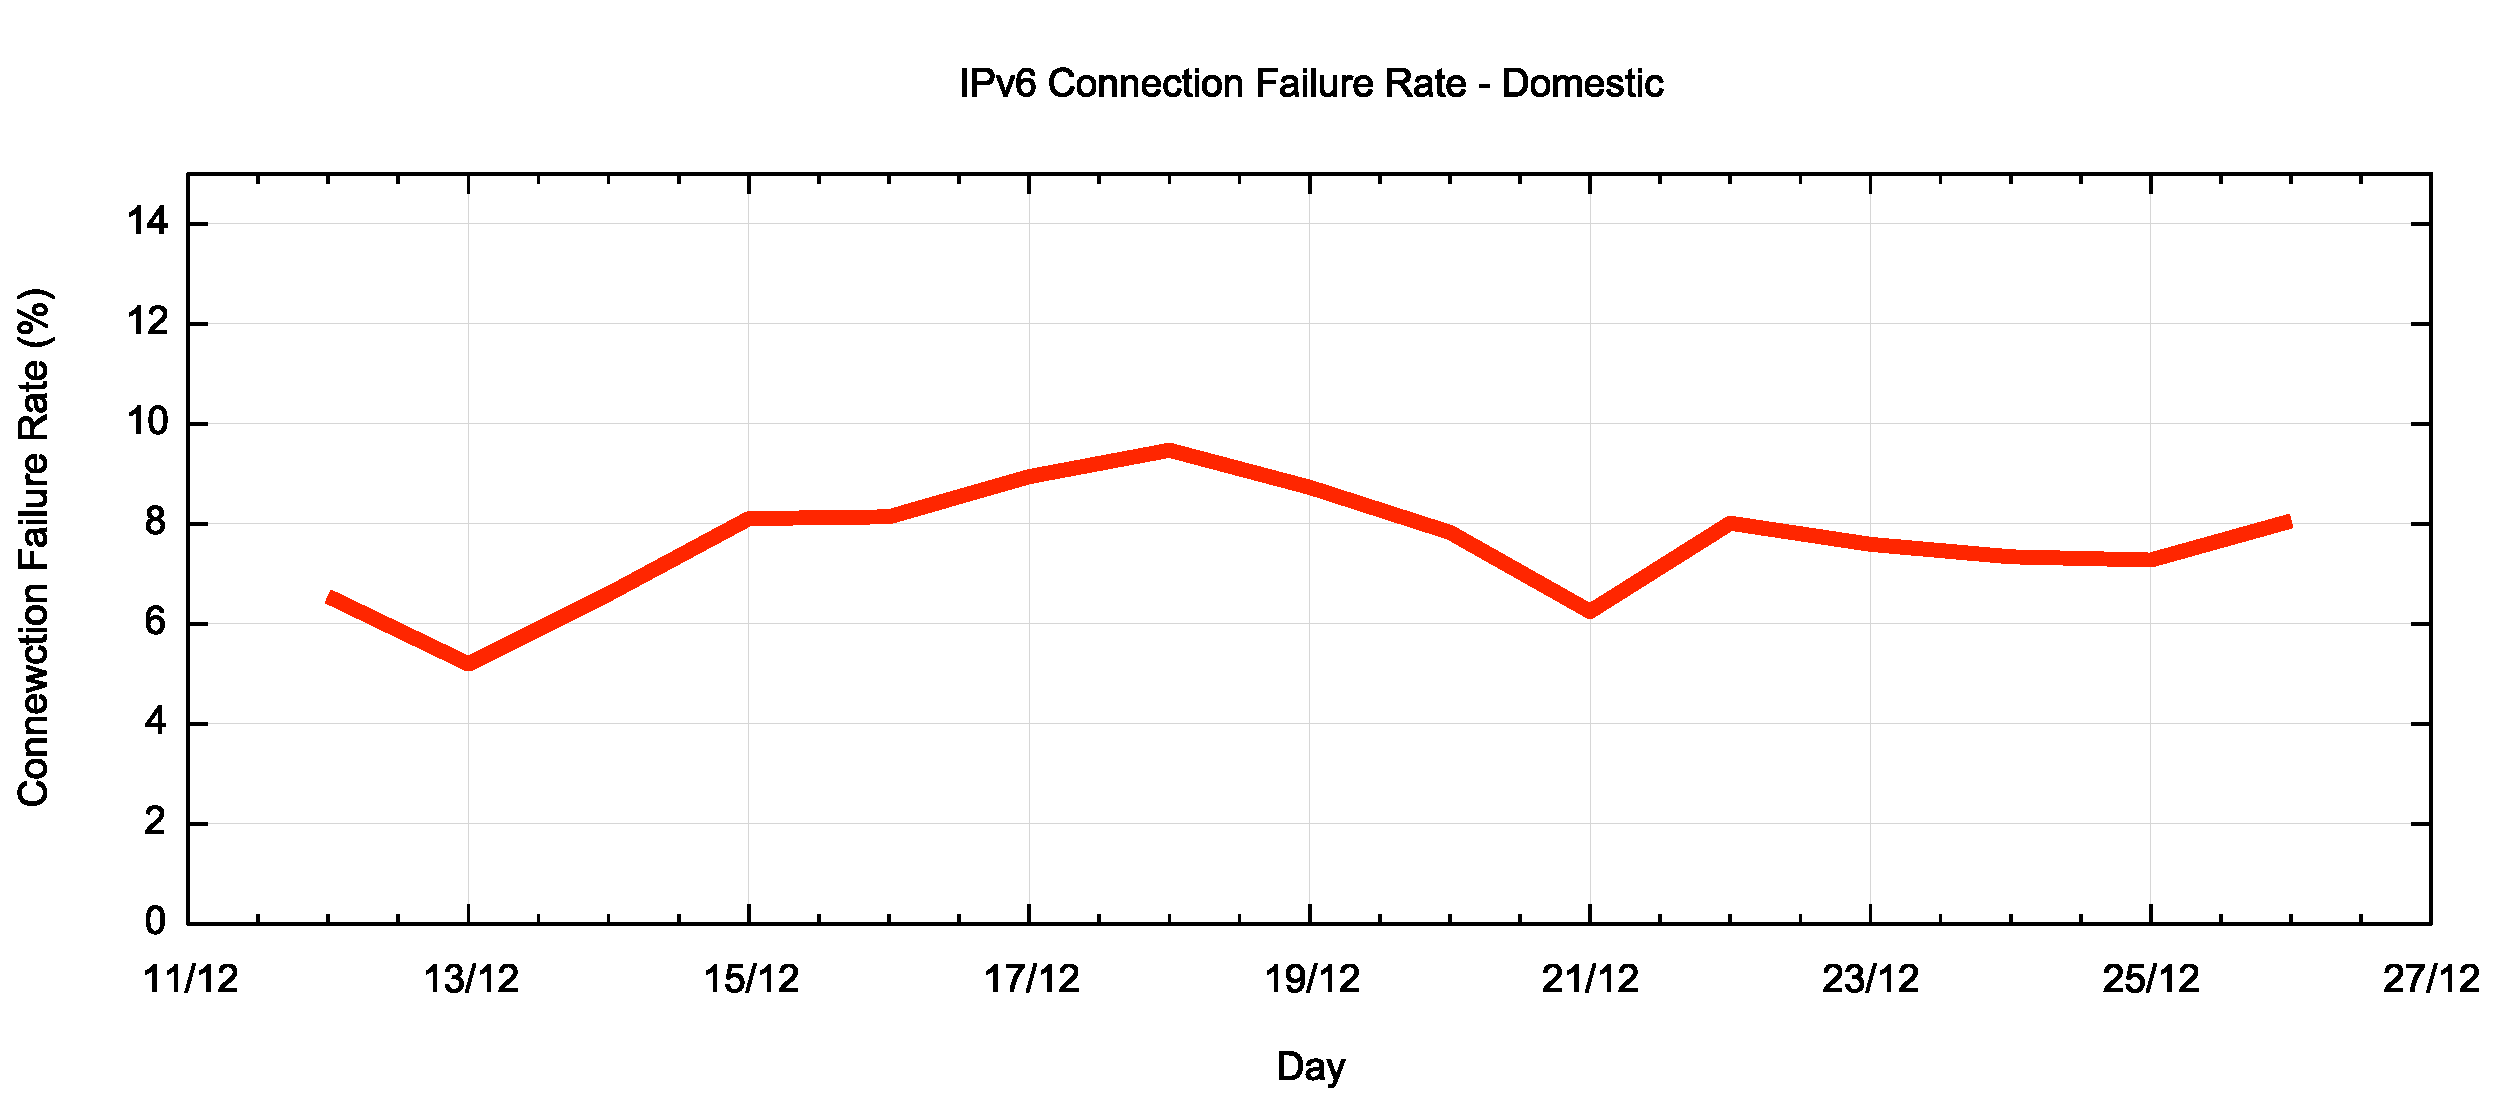
Figure 19 – IPv6 Connection Failure rate for China domestic IPv6 service
Unexpectedly, the connection failure rate is higher in this situation, and some 8% of IPv6 connection attempts to the domestic server are incomplete. There is no ready explanation for this higher connection failure rate.
The internal IPv6 routing in China appears to be well managed, and the average difference in round trip times shows that that IPv4 and IPv6 appear to be handled in much the same manner (Figure 20).
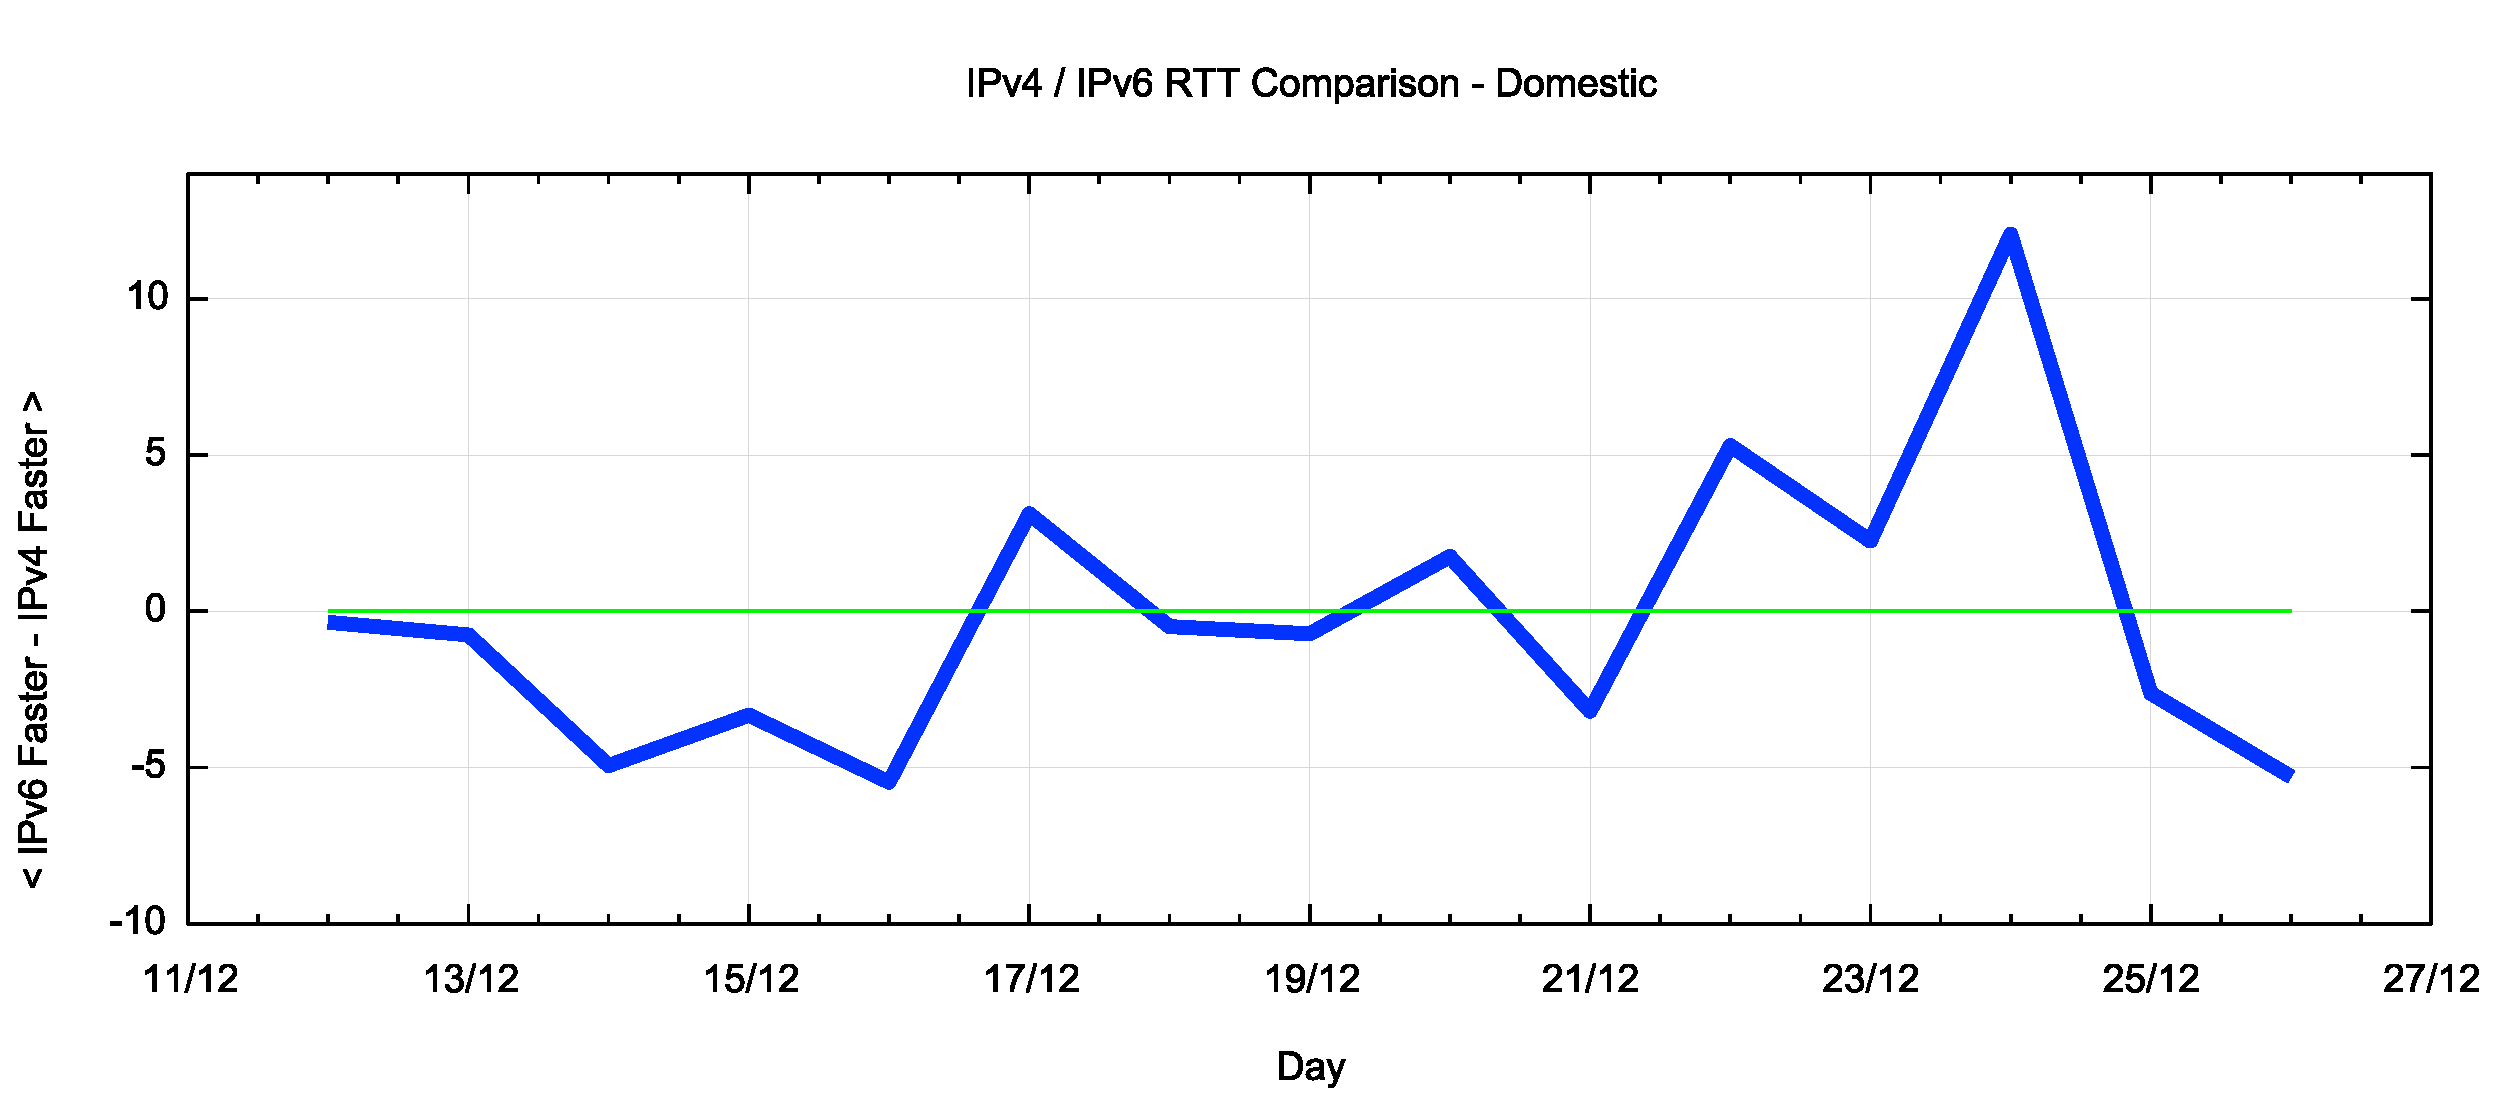
Figure 20 – RTT comparison between IPv6 and IPv4 for China for Domestic services
The high level of day to day variation in this average figure points to some level of fluctuation in these measurements, due perhaps in part to routing variations and in part to the variation in distributions of ad placement from day to day. We can look at by splitting out these measurements by network (Figure 21).
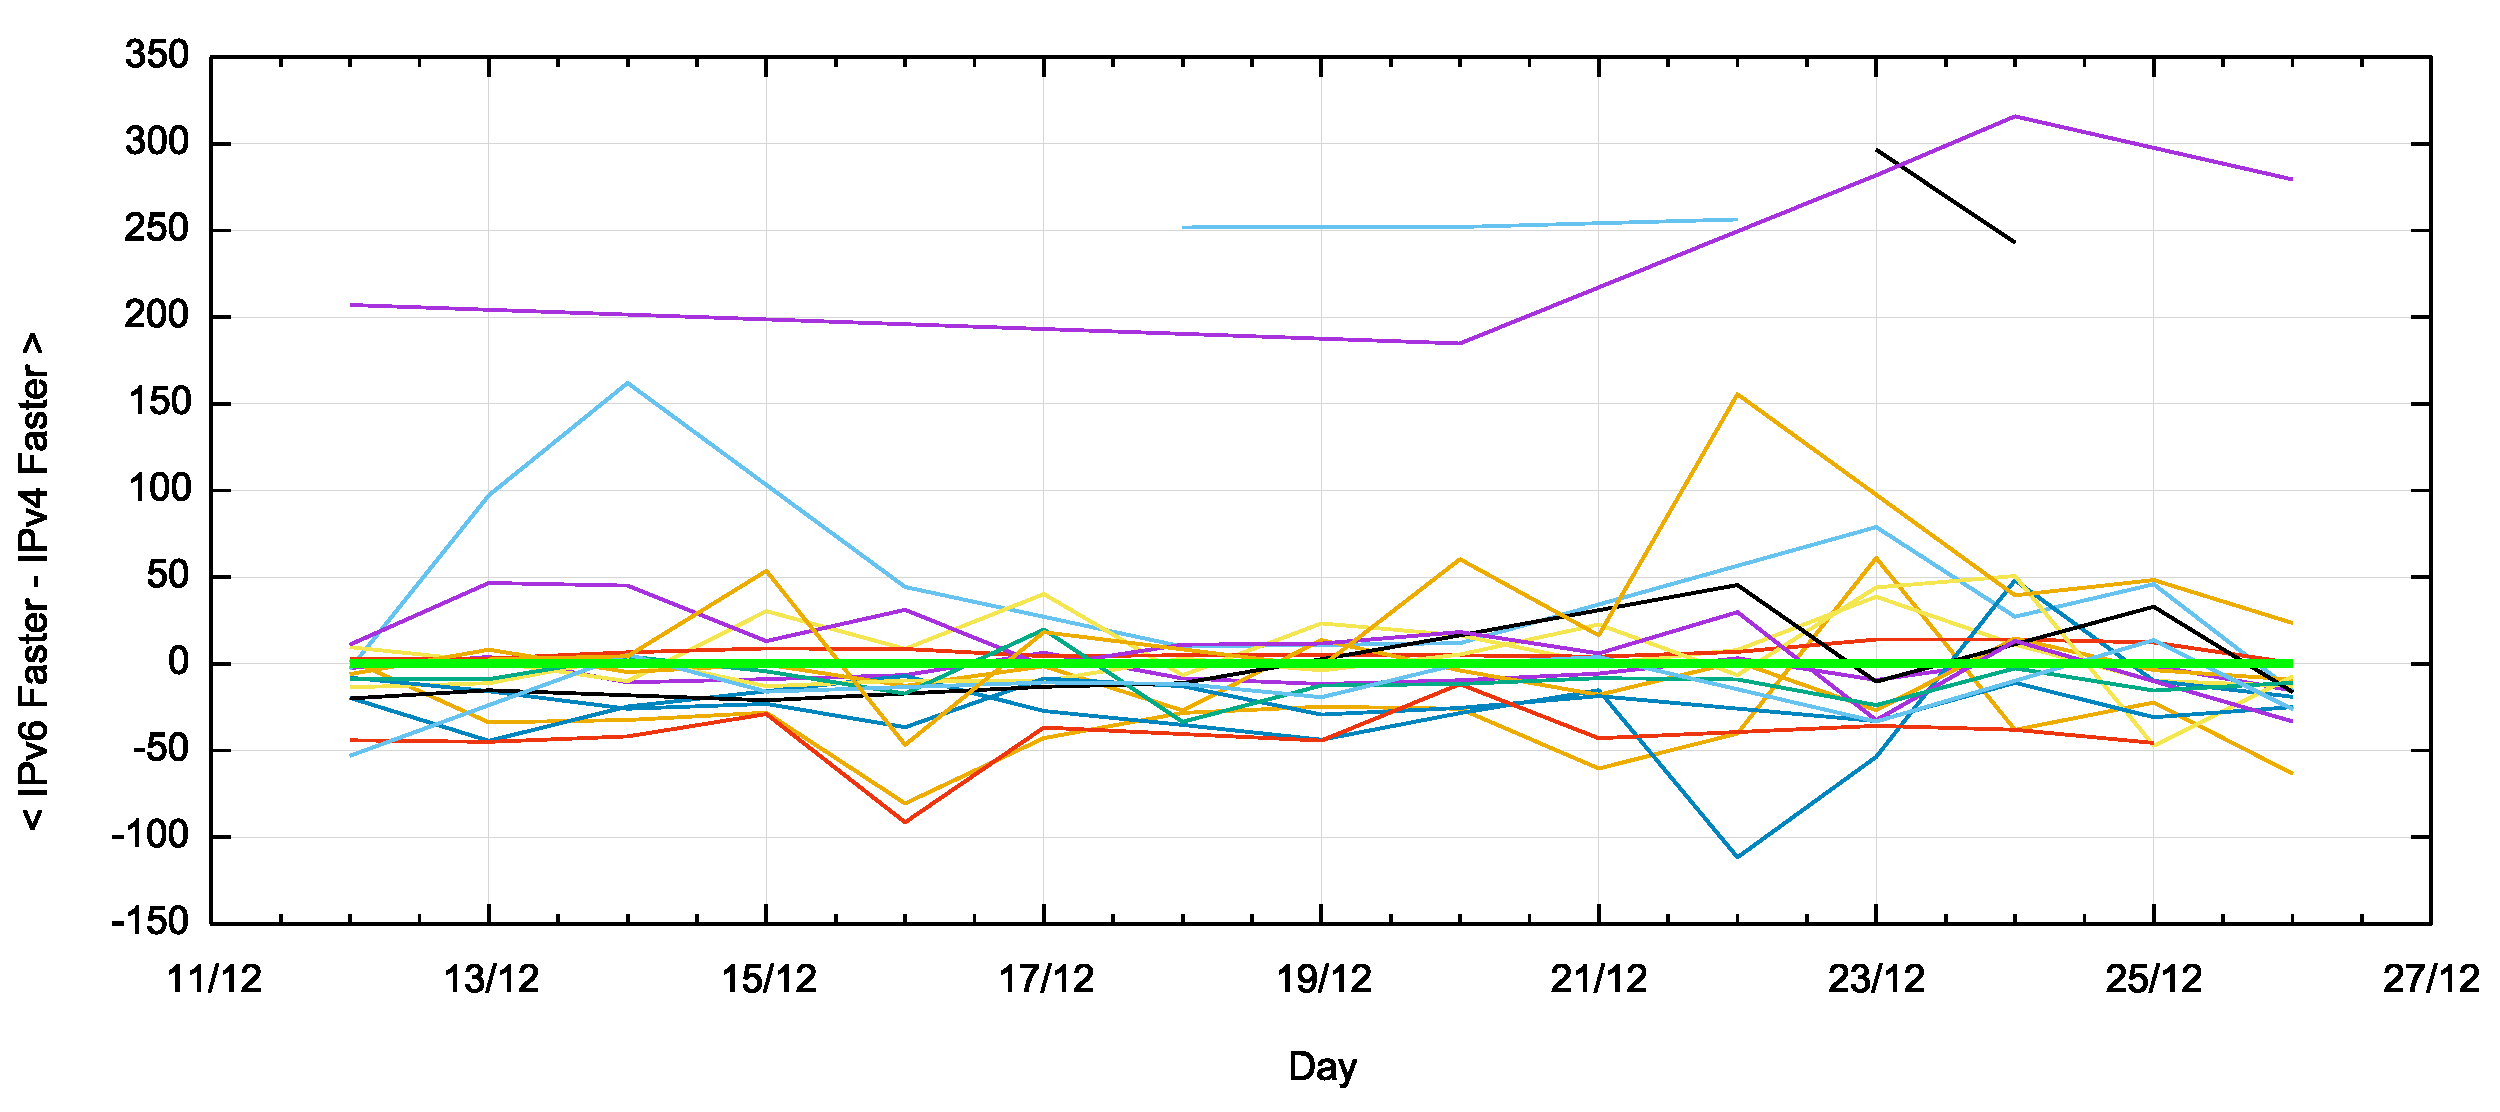
Figure 21 – RTT comparison between IPv6 and IPv4 for China for Domestic services, per AS
There are three networks that appear to be using some long external path to reach a Chinese domestic server over IPv6. In many other cases IPv6 appears to offer slightly better RTT performance.
Conclusion
In the last couple of months, we have seen evidence that points to large scale deployment of IPv6 services in China. This is most evident in the regional networks of China Mobile and in ChinaNet.
The IPv6 data published by Google and Facebook appears to see only a small part of the Chinese IP infrastructure and that may well be clouded by the use of VPNs to access these services. The picture from Akamai is consistent with what we are seeing with the APNIC ad-based measurement program. There has been a large-scale shift in China with IPv6 and starting in November there are very visible signs of movement in a number of these very large service networks.
If one was to look to China to be the last piece in a critical mass of IPv6 deployment that will propel the Internet’s migration over the coming years, then the picture is looking very encouraging.
Thanks
I would like to acknowledge with gratitude the generous assistance of the good folk at CERNET in assisting with the domestic server part of this measurement project, and also acknowledge and thank Google for their continuing generous support of the APNIC measurement program.