There are a number of parts to the current framework that we’re using to improve routing security on the Internet. Prefix holders should generate validly signed Route Origination Attestations (ROAs) and have them published, Network operators should maintain a current local cache of these signed objects and use then to filter routing updates, preferably discarding those routes that are invalid according to the route validation procedures.
Measuring Route Filtering
In 2020 APNIC Labs set up a measurement system for the validators. What we were trying to provide was a detailed view of where invalid routes were being propagated, and also take a longitudinal view of how things are changing over time. The report is at https://stats.labs.apnic.net/rpki and the description of the measurement is at https://www.potaroo.net/ispcol/2020-06/rov.html.
I’d like to update this description with some work we’ve done on this measurement platform in recent months.
The measurement is undertaken by referring a user to retrieve a URL where the only route to the associated IP address is by using a routing entry that is invalid. The URL also uses a uniquely generated DNS name to ensure that there is no web proxy that would distort this measurement.
The issue with this form of route filtering is that there is a strong “downstream” effect of the measurement. A network that drops invalids effectively provides that service to all single-homed downstream networks. If we used a single point of access and directed all users to this access point, then we have the issue of inferred measurement distortion. If, for example, the upstream ISP of the access point performed dropping of invalid routes then we would obtain a result that ROV filtering was being used across the entire Internet, which of course is entirely incorrect.
For example, in the configuration shown in Figure 1, if network E, located close to the source of the ROV-invalid server has client networks A through D that use network E to access the server instance, then all of these networks will appear to be performing drop invalid, because the common access network E is performing drop invalid.
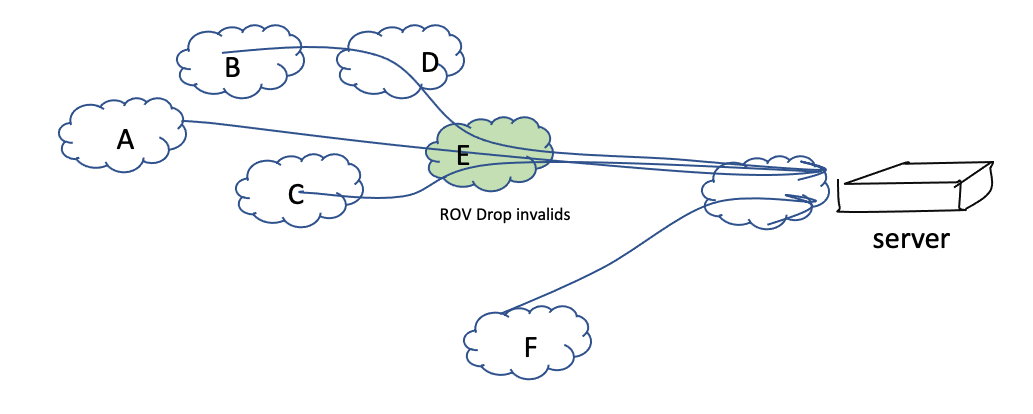
Figure 1 – Example of transitive Drop Invalid
One way to counter this effect is to use an anycast network and advertise the same route from a diverse set of locations. That way even if one or more of the anycast sources are not visible due to third party drop invalid effects, as long as there is one anycast instance that is still visible then the network will still exhibit reachability to the ROV-invalid route, and therefore is shown to be not dropping invalid routes.
We started this measurement by using a simple form of anycast, using the hosting services of three geographically diverse points (US, Germany and Singapore). In this case a network is judged to be dropping invalid routes if their users cannot reach any of these anycast measurement points. We then added a couple of additional points that used a different provider, so that there were a number of diverse networks paths to reach this measurement. This worked for a while, then once more we noticed that the anycast set was not sufficiently diverse. This behaviour is shown in the ROV filtering measurement for South America (Figure 2).
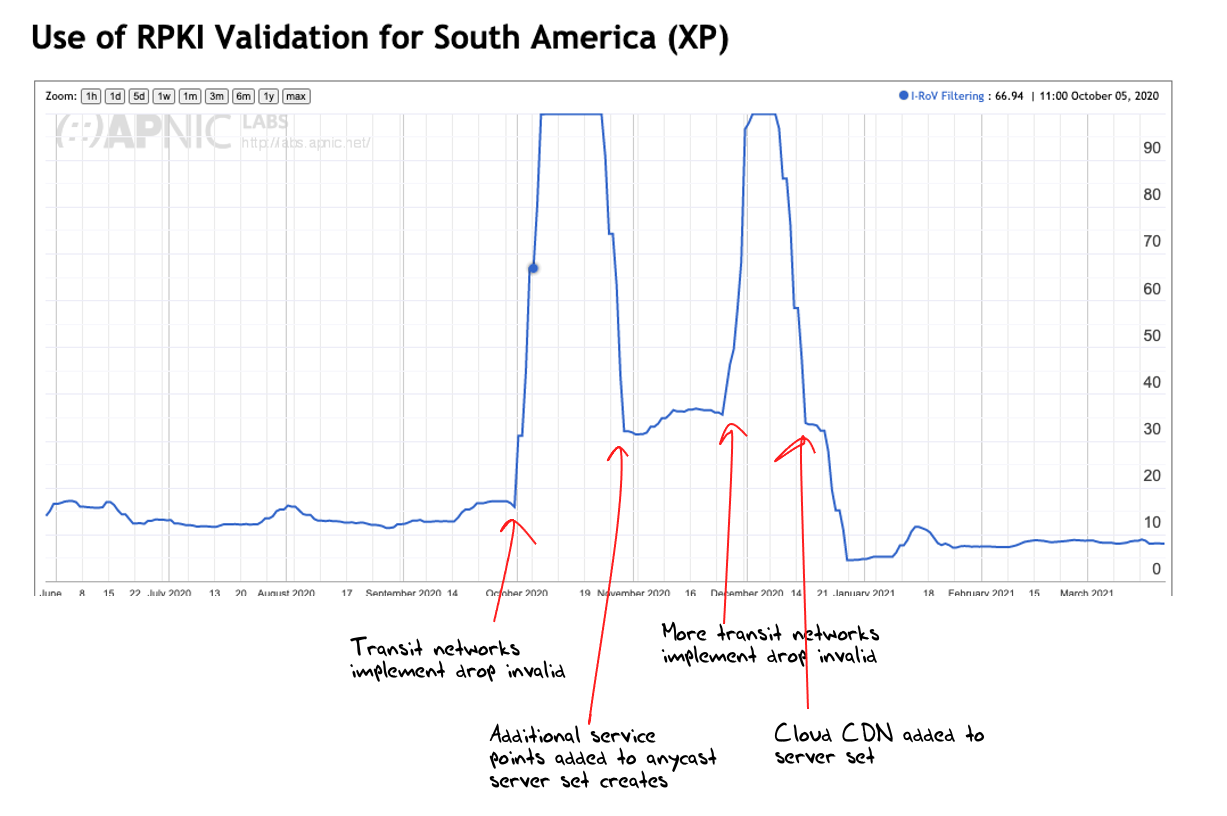
Figure 2 – RPKI Filtered outcomes corresponding to anycast configuration for South America
(https://stats.labs.apnic.net/rpki/XP)
We now use two sets of tests to measure RPKI drop invalid ROV filtering.
The first is as described in the earlier article, where a single prefix is advertised in a relatively small anycast network and the ROA is changed 6 times per week, causing the ROV-validity status of the advertised route to change between valid and invalid states, in 24 hour and 36 hour intervals across each week.
The second test is a more conventional test where we use a target that is always announced behind a ROV-invalid route, and a control is used that is always ROV-valid, where we use the services provided by a large CDN network to create a large anycast network for both the valid and invalid routes.
The results of this measurement are shown in Figure 3. Currently, some 10% of Internet users are behind networks that we observe to be dropping ROV-invalid routes. The geographical distribution of the effects of drop ROV-invalid route filtering is shown in Figure 4. It is evident from this data that relatively few of the larger retail providers are confident in enabling drop-invalid at this point in time.
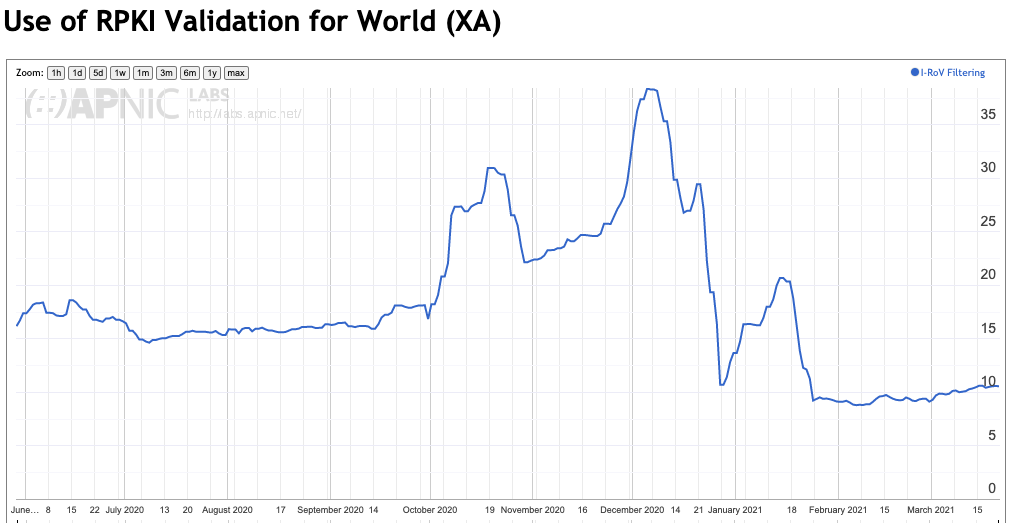
Figure 3 – RPKI Filtered outcomes for the Internet – June 2020 – March 2021
(https://stats.labs.apnic.net/rpki/XA)
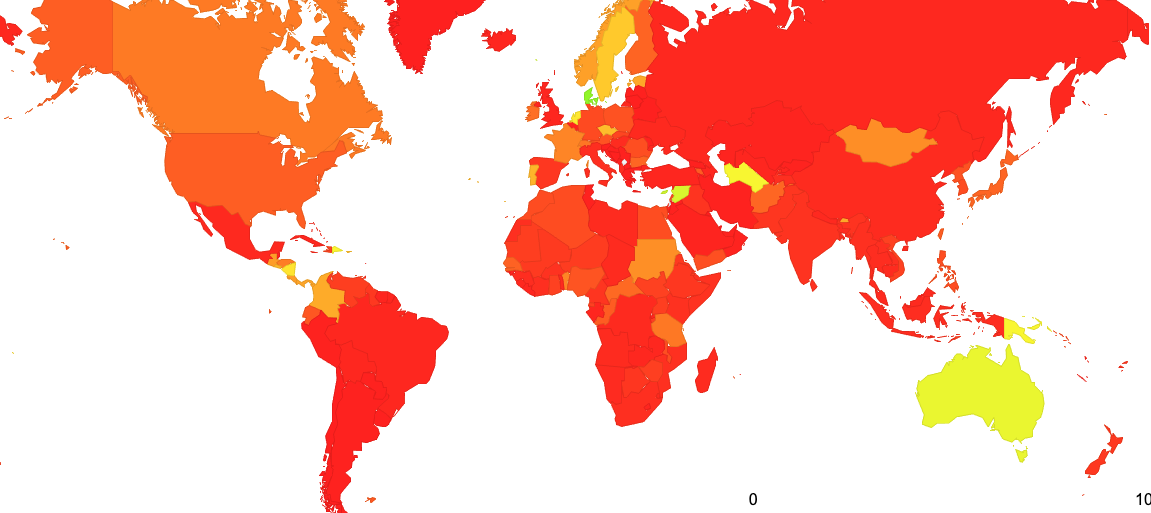
Figure 4 – Distribution of the relative levels of drop-invalid ROV filtering
(https://stats.labs.apnic.net/rpki)
Measuring ROA Generation
Route filtering relies on the production and maintenance of ROAs. I’d like to introduce a second APNIC Labs measurement tool that looks at the routing system and measures the extent to which advertised routes have a matching ROA. The system also measures the instance of routes that have an invalid ROV state.
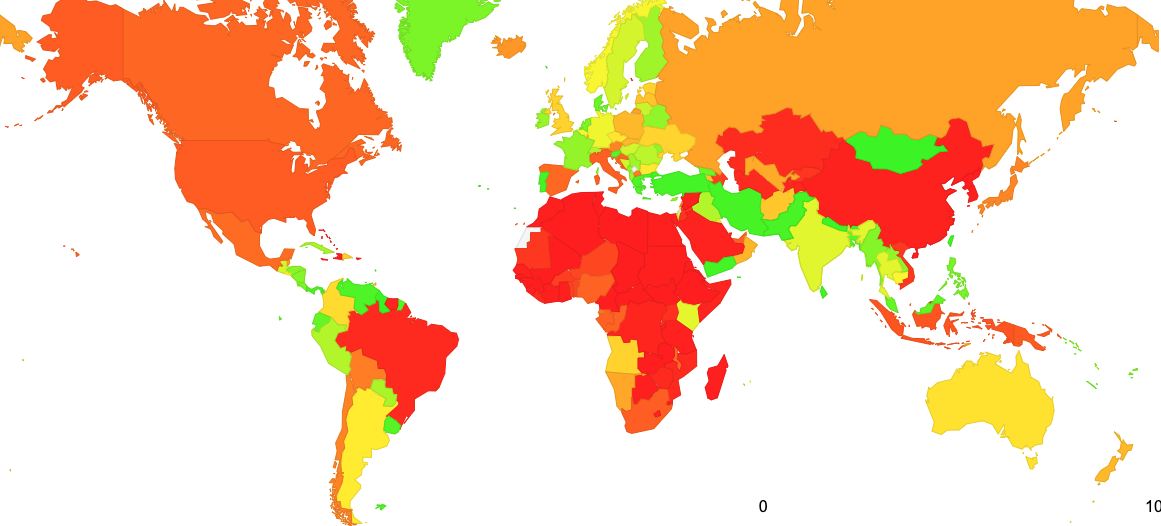
Figure 5 – Distribution of the relative levels of ROA coverage
(https://stats.labs.apnic.net/roas)
There is an interesting discrepancy between the relative levels of the production of ROAs (Figure 5) and the use of ROAS to filter routing advertisements (Figure 4). Across the entire routing space, some 27% of the advertised address span in IPv4 is validated by a ROA, and some 37% of the advertised address space in IPv6. This is a rise by 50% in IPv4 over the last 12 months, and a rise of 30% in IPv4 over the same period. It appears that the response to ROA generation has been enthusiastic by many network operators. However, the same cannot be said about the level of enthusiasm to perform drop-invalid filtering in their networks. This seems contradictory to me, in that there really is little point to maintain ROA publication unless networks are also willing to perform drop-invalid filtering of routes.
There are some challenges in performing this form of measurement, particularly in finding instances where there are routes that are ROV-invalid. The more networks that perform drop-invalid then the harder it becomes to actually see invalid routes as they won’t be propagated through the routing system. This tool has followed a similar path to that of the access measurement, where we needed to expand our measurement platform to have more vantage points. In the case of the route filtering measurement we’ve moved to a larger anycast server network to improve the measurement. The ROA measurement uses a BGP routing table feed, and we needed to increase the number and diversity of BGP observation points to improve the ability to see ROV-invalid routes. To achieve this, we use the aggregate of the entire RouteViews route collectors (http://www.routeviews.org/routeviews/, and a map of the locations of the individual collectors is published here: http://www.routeviews.org/routeviews/index.php/map/) and the RIS route collectors (https://ris.ripe.net). We then perform the measurement across some 600 distinct routing perspectives simultaneously in order to generate the data set.
There are two parts to this measurement: ROA collection and Route Auditing.
For ROA collection I’ve used the awesome Routinator tool from NLnet Labs to assemble the set of validated ROAs every 6 hours. (https://nlnetlabs.nl/projects/rpki/routinator/) There is not much more to say about this tool. It just works brilliantly!
For Route Auditing I use a custom tool to take a simplified BGP route dump that consists of the address prefix and the Origin AS and implements the route validation process across this prefix set. Every route in a dump report is classified as ROV-Valid if it can find one valid ROA that encompasses this address prefix and the origin AS, or ROV-Invalid if it can only find ROAs that match the prefix but have a mismatch on either the maxlength or originating AS, or is otherwise labelled as ROV-Unknown.
These are the major data components of the APNIC Labs ROA generation reports (https://stats.labs.apnic.net/roas). The report structure follows a drill-down approach used for other infrastructure reports from APNIC Labs (https://stats.labs.apnic.net/), allowing for views at a regional level and individual economies, and down into individual networks.
At the network level for each individual AS the report contains two sections: a table of ROAs that authorise prefixes originated by this AS and a table of the prefixes observed in the routing system that use this AS as the point of origination of the route into the routing system.
The ROA list contains the list of current valid ROAs and the number of observed route announcements that have been validated by each ROA. An example of this report is shown in Figure 6. There is also an option to display historic ROAs, and the report is augmented with the visible dates of these historic ROAs.
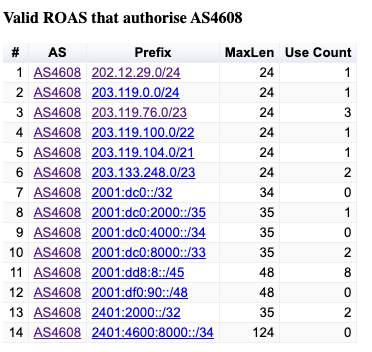
Figure 6 – ROA report for AS4608 (https://stats.labs.apnic.net/roa/AS4608)
This network report also contains a list of the prefixes originated by this AS. An example of this section of the report is shown in Figure 7.

Figure 7 – Prefix report for AS4608 (https://stats.labs.apnic.net/roa/AS4608)
It is worth explaining the intent behind some of these columns.
- The “Span” column is the number of addresses that are “visible” in this advertisement. The number may be smaller than that specified by the mask length of the address prefix because of the presence of more specific routes.
- The “CC” column is the economy code of the geographic location of this address prefix. We use a modified version of the Maxmind data set (https://www.maxmind.com) to map address prefixes to these codes.
- The “Visibility” column gives an indication of the extent to which this prefix is visible in the route sets obtained from RouteViews and RIS. The data collection spans some 600 individual BGP peers and the visibility value is a number between 1 and 10 that indicates the decile of the number of BGP peers who have this route. A visibility value of 1 would correspond to a seen peer count of between 1 and 60 peers, while a value of 10 would be between 590 to 600 peers, or universal visibility. Prefixes that are ROV-Invalid have a visibility value of less than 10 because of the number of BGP peers that either perform drop-invalid directly or are impacted by drop-invalid on the path.
- The “ROV State” column is either “VLD” to indicate that the ROA set was able to validate this route, ”INV” to indicate that no ROA was able to validate this route, but there are other ROAs indicated that this was an invalid route, or “UNK” to indicate no ROAs matched this prefix.
- The “ROAs” column lists the ROA that was used to validate the route, or in the case of an ROV-invalid route, the set of ROAs that generated the invalid state. An example of a report that includes ROV-Invalid routes is shown in Figure 8. There are two causes of invalidity, namely a mismatch of origin AS or a mismatch of the Maxlen ROA value with the prefix length (or both!). The mismatch is highlighted in the report.

Figure 8 – Prefix report for AS24560 (https://stats.labs.apnic.net/roa/AS24560)
It is possible to display a report of all observed prefixes since the start of 2019 for each AS, which includes the last seen ROV validation state and the dates when the prefix was observed.
The final report is a report for an individual address prefix, showing the announcement and ROV validation state for an individual prefix, using the same prefix report format as the network report. An example is shown in Figure 9).
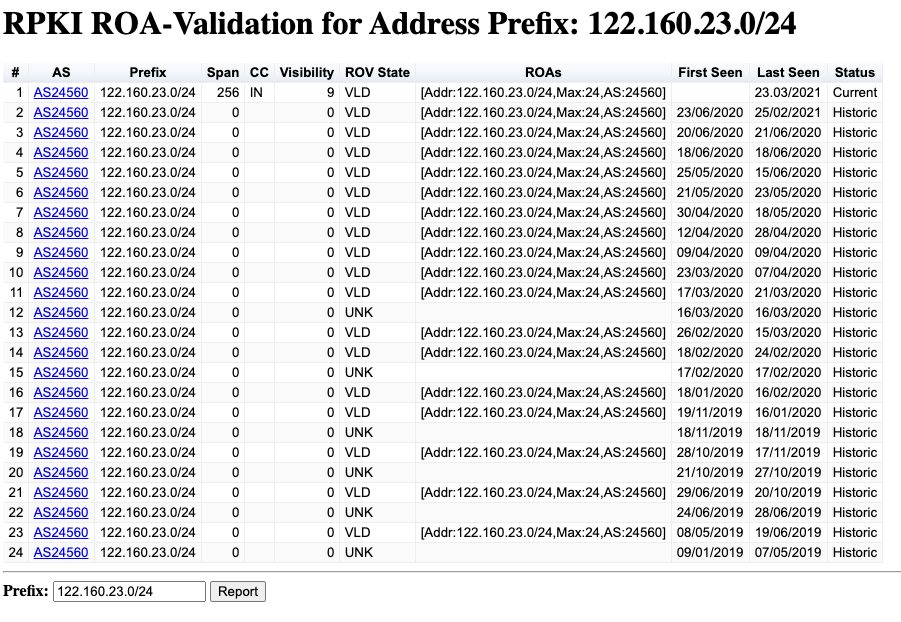
Figure 9 – Prefix report for 122.160.23.0/24 (https://stats.labs.apnic.net/roas/pfx?p=122.160.23.0/24)
There are some aspects of this measurement approach that should be noted here.
Firstly, this analysis uses one BGP “snapshot” per day. It does not track the BGP update data sets. BGP updated would be a significantly larger data set, and it’s unclear if the update view would shed more light on the ROV-validity state of a prefix. It’s more likely that it would illustrate that BGP is a very chatty protocol and much of the updates are related to the efforts of BGP speakers to converge to a stable state rather than underlying issues with either the inter-AS topology or the addition of ROV filters to BGP. That implies that these reports do not show a real time status of a prefix. The report lags behind real time by a minimum of a few hours and up to 1 day.
Secondly, this measurement approach will be less effective in finding instances of prefixes that are ROV-Invalid over time. The more network providers adopt drop ROV-Invalid routing policies the fewer the number of BGP speakers who will “see” these ROV-Invalid routes at all. This leads to the observation that the higher the level of ROA generation and the higher the level of drop-invalid route filers the harder it will be to observe the effectiveness of this framework to detect and filter out various forms of route leaks and hijacks.
There is an odd contradiction at the heart of this observation: The more we adopt this ROA and ROV validation framework, the harder it becomes to justify the that the efforts undertaken by network operators in running this system result in clearly visible improvements in routing security!
However, I suspect that such a state is some time away, and while we are getting better in operating this ROA system, there are still an annoying number of ROV-Invalid routes that appear to be related to operational management of ROAs rather than BGP incidents, deliberate or otherwise (Figure 10).
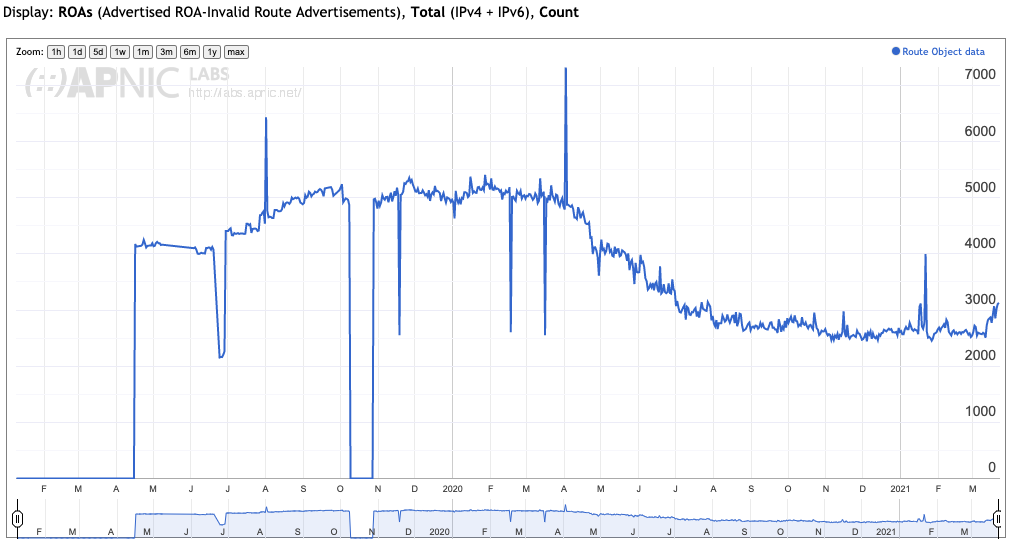
Figure 10 – ROV-Invalid Routes
(https://stats.labs.apnic.net/roa/XA?o=cXAl1r0vttrdpxi&t=ROAs&x=Invalid&v=Total&d=Count)
Hopefully this ROA reporting tool, and others like it will assist operators to see the effects of their efforts to add ROV validation to their part of the Internet’s routing system.
If you are looking for other reporting and analysis tools, as well as resources and other projects related to RPKI and route validation you might want to check out the list maintained by NLnet Lab’s Alex Band at https://rpki.readthedocs.io/en/latest/rpki/resources.html.