Time for another annual roundup from the world of IP addresses. What happened in 2014 and what is likely to happen in 2015? This is an update to the reports prepared at the same time in previous years, so lets see what has changed in the past 12 months in addressing the Internet, and look at how IP address allocation information can inform us of the changing nature of the network itself.
The Internet is inexorably changing, and the predominate theme of today’s network is the dramatic uptake of the mobile Internet. Whether it’s an Apple iPhone6, or a Samsung Galaxy, a Moto X, a Nokia Lumina, or any one of a myriad of other smart phones or tablets, mobile devices have transformed the Internet, and the sheer volume of deployment of these devices was the dominant factor in the growth of the Internet in 2014, as it was in the previous year. But it’s not just mobile devices, as there has also been a new wave of household consumer devices, notably including games consoles and televisions, that are also fuelling Internet growth. We’re also seeing the initial consumer offerings in the Internet of Things, with internet-based home lighting systems and other forms of household automation that involve sensors and appliance management, such as energy management, irrigation management and similar.
In October 2014 Gartner released its estimate of the worldwide device sales for PCs, tablets, and mobiles, predicting a total shipment volume of some 2.4 billion units in 2014, compared with 2.3 billion units in 2013. The bulk of these units are mobile phones (some 1.9 billion units), 230 million tablets and 310 million “conventional†PCs. Unsurprisingly, the PC market is declining, as consumers switch to use tablets and other mobile devices. Within this market segment it’s now a Unix (specifically Android) world, with some 1.2 billion units shipped with Android in 2014, compared with an estimated 330 million Windows devices, and 260 million IOS/Mac OS Apple devices.
And then there is the all the embedded devices that collectively have been labelled “The Internet of Thingsâ€. Gartner have projected that this world of chattering silicon would get to 25 billion devices by 2020. Cisco upped the ante with their prediction of 50 billion such connected things by 2020, and Morgan Stanley went further with a prediction of 75 billion devices connected to the Internet in that time. Other reports have placed this number as high as 100 billion. The extent of the current levels of unbounded technical euphoria in this space project economic values of this activity in units of trillions of dollars by 2020. But it’s challenging to place these projected numbers into an analytical framework that can place these numbers into a firm foundation based on recent data.
The large scale deployment exercised for residential broadband has achieved market saturation in many of the more developed parts of the world where the GDP per capita exceeds some $20,000. Where the GDP per capita is lower the levels of broadband penetration are also lower, perhaps because of the higher rural populations and the basic issues of affordability.
When you put together the mobile and wired numbers together, and look at the population Internet users, the numbers driving growth are still dramatic. The estimated total number of Internet users worldwide grew from 2.7 billion at the start of the year to 3.0 billion by the end of the year, a growth of some 300 million users through 2014. And of course there is also the estimate of how many devices are connected to today’s Internet. One source of this measurement is Cisco, who estimate that in January 2015 there are some 14 billion “people processes, data and things connected to the Internetâ€. Gartner look to a more modest count of some 4 billion connected devices at the end of 2014.
Where are these devices? How is the Internet changing as a result of this activity? Let’s use the lens of address allocation records to see what the address allocation records can tell us as to how the Internet fared in 2014.
IPv4 in 2014
As measured by the allocations of public address space in the IPv4 network, the pace of growth of the Internet slowed down substantially in 2014. The allocation of 65 million addresses in 2013 on top of a base of 3,472 million addresses that were already allocated at the start of the year represents a growth rate of 1.9% for the year. This is approximately one quarter of the growth in 2010 (the last full year before the onset of address exhaustion), and represents the lowest relative growth rate we’ve seen in recent years.
This low total is predominately due to the exhaustion of available IPv4 address space in the regions served by APNIC (Asia Pacific) and the RIPE NCC (Europe and the Middle East) in previous years, and that of LACNIC in June 2014. The two RIRs with remaining address pools (AFRINIC and ARIN), together serve approximately 1.5 billion of the world’s 7.2 billion population, so on a pro-rata basis based on population counts the 2014 allocation level of 38.5 million addresses by these two RIRs is approximately equivalent to a global allocation total of some 184 million addresses. This points to an observation that where there are available addresses, the address allocation rate is operating at levels that are appreciably lower than the peak global level of 2010. ARIN’s address allocation rate in 2014 was les than half of its 2008 peak of 57 million addresses. The North American community has been careful so far to avoid any form of last minute panic on the residual pools of IPv4 addresses, as evidenced by these ARIN numbers for 2014.
| 2005 | 2006 | 2007 | 2008 | 2009 | 2010 | 2011 | 2012 | 2013 | 2014 | |
| Allocated IPv4 Addresses (Millions) | 174.4 | 168.1 | 203.9 | 203.3 | 189.4 | 248.8 | 201.0 | 114.9 | 65.1 | 63.9 |
| Relative Annual Growth | 8.0% | 7.7% | 8.8% | 8.0% | 6.9% | 8.4% | 6.3% | 3.4% | 1.9% | 1.8% |
Table 1 – IPv4 Allocated addresses by year
| RIR \ YEAR | 2005 | 2006 | 2007 | 2008 | 2009 | 2010 | 2011 | 2012 | 2013 | 2014 |
|---|---|---|---|---|---|---|---|---|---|---|
| APNIC | 53.6 | 51.4 | 69.6 | 87.8 | 86.9 | 120.2 | 105.2 | 1.0 | 1.3 | 3.7 |
| RIPE NCC | 61.2 | 55.0 | 60.7 | 44.0 | 43.4 | 56.0 | 43.1 | 40.0 | 2.0 | 2.5 |
| ARIN | 47.2 | 46.5 | 53.0 | 57.1 | 41.1 | 45.2 | 23.5 | 45.0 | 26.5 | 26.0 |
| LACNIC | 10.4 | 10.7 | 14.2 | 12.0 | 10.5 | 13.0 | 24.4 | 21.0 | 28.5 | 19.1 |
| AFRINIC | 0.9 | 2.6 | 5.5 | 1.6 | 5.9 | 8.5 | 9.2 | 7.9 | 6.8 | 12.5 |
Table 2 – IPv4 Allocated addresses (millions) – Distribution by RIR
In 2014 APNIC allocated 3.7 million IPv4 addresses, close to triple the 1.3 million addresses allocated in 2013. APNIC effectively exhausted its general use pool of addresses in April 2011, and since then the registry has been operating under the terms of a “last /8” policy that limits each entity to at most 1,024 addresses drawn from this “last chance” pool. APNIC recorded some 4,028 individual address allocations in 2013, with an average allocation size of 937 addresses per allocation. As compared to the previous two years operating under this final /8 policy, relatively more allocations are being undertaken at the maximum size of 1,024 addresses, and the number of allocations has more than doubled from 1,543 in 2013 to 4,028 in 2014. This may indicate that the “afterlife” of IPv4 continues and the levels of held space by ISPs immediately prior to the 2011 exhaustion event are depleting, and the demand on the small residual address pool held by APNIC is increasing. At this rate of consumption the remaining address pool in APNIC has 3.5 years to go, and will be fully depleted in mid 2018.
The RIPE NCC exhausted its general use pool of addresses in mid-September 2012. The RIPE NCC allocated some 2.5 million addresses in 2013, and recorded 12,495 allocations. The average allocation size was 1,018 addresses per allocation, which is comparable to the 2013 figures for this registry. At this allocation rate, the remaining pool of IP addresses will last for a further 6.5 years, or until mid 2021.
LACNIC exhausted its general use pool of IPv4 addresses in June 2014, leaving some 4 million addresses in its residual address pool. Prior to exhaustion LACNIC allocated 18.4 million addresses in 937 transactions, or an average of 20,000 addresses per allocation, Post exhaustion LACNIC has allocated 680,000 addresses in 685 transactions, or some 988 addresses per allocation. At this rate LACNIC’s remaining 3.3 million addresses will last a further 2.5 years, or until mid 2017.
But what of the other regions? In the case of ARIN the total allocated address count has been consistent with the 2013 level and approximately half that of the 2012 levels. In 2013 the largest allocation was for a /11 (some 2M addresses). In 2014 the largest single allocation was in April, when 104.64.0.0/10 (some 4M addresses) was allocated to Akamai Technologies. The next 8 largest allocations were each for 1 million addresses (each allocation was a /12). Together these 9 allocations (out of a total of 2,473 allocations in 2014) accounted for 12.5 million addresses, or almost one half of the total addresses allocated by ARIN in 2014.
AFRINIC address consumption rate almost doubled in 2014 from its 2013 level, and the 12.5 million addresses allocated in 2014 is the highest address consumption level for AFRINIC to date.
Which countries received the largest pool of IPv4 addresses in 2014?
| Rank | 2009 | 2010 | 2011 | 2012 | 2013 | 2014 | ||||||
|---|---|---|---|---|---|---|---|---|---|---|---|---|
| 1 | China | 50.67 | China | 45.2 | China | 53.07 | USA | 28.2 | USA | 25.0 | USA | 24.5 |
| 2 | USA | 38.55 | USA | 42.32 | USA | 21.21 | Canada | 16.7 | Brazil | 17.4 | Brazil | 10.9 |
| 3 | Japan | 11.04 | Rep.Korea | 25.73 | Japan | 16.91 | Brazil | 8.4 | Colombia | 3.8 | Morocco | 2.6 |
| 4 | Rep.Korea | 10.95 | Japan | 10.02 | Rep.Korea | 7.68 | Russia | 5.3 | Argentina | 1.6 | Colombia | 2.1 |
| 5 | Russia | 5.46 | Australia | 9.63 | Indonesia | 7.09 | Iran | 4.5 | Egypt | 1.6 | South Africa | 1.7 |
| 6 | Brazil | 4.19 | India | 9.43 | Brazil | 6.29 | Germany | 3.4 | Canada | 1.4 | Egypt | 1.6 |
| 7 | UK | 4.19 | UK | 8.13 | India | 6.01 | South Africa | 3.4 | Nigeria | 1.2 | China | 1.5 |
| 8 | Italy | 4.16 | Germany | 6.97 | France | 5.39 | Italy | 3.3 | Chile | 1.1 | Canada | 1.5 |
| 9 | France | 3.85 | Russia | 6.46 | Russia | 5.02 | Colombia | 2.6 | Mexico | 1.1 | Kenya | 21.4 |
| 10 | Germany | 3.6 | Brazil | 6.29 | Germany | 4.92 | Romania | 2.6 | Seychelles | 1.0 | Mexico | 1.1 |
Table 3 – IPv4 Allocated addresses – Top 10 Economies
With the exhaustion of IPv4 addresses from APNIC and the RIPE NCC regions, Korea, Japan and India no longer are in the top 10 countries for IPv4 address allocations, nor are Russia, Germany, Italy and Romania. Instead, we see countries in the Americas and Africa take their place, but with relatively smaller total allocations compared to previous years.
IPv4 Address Distribution
Another way to look at the address distribution is in terms of “skew”. If the Internet is populated by a largely homogenous population of service providers then the distribution of address allocations would be relatively uniform, such that the group of largest allocations would not be vastly larger than the group of smallest allocations. On the other hand , if the service provider population is skewed such that there is a small number of very large providers that service the bulk of the user population, then we would expect to see the bulk of addresses being allocated to a small number of providers. One way to look at the level of skew is to use a cumulative distribution plot, comparing the number of allocations to the amount of address space, shown below.
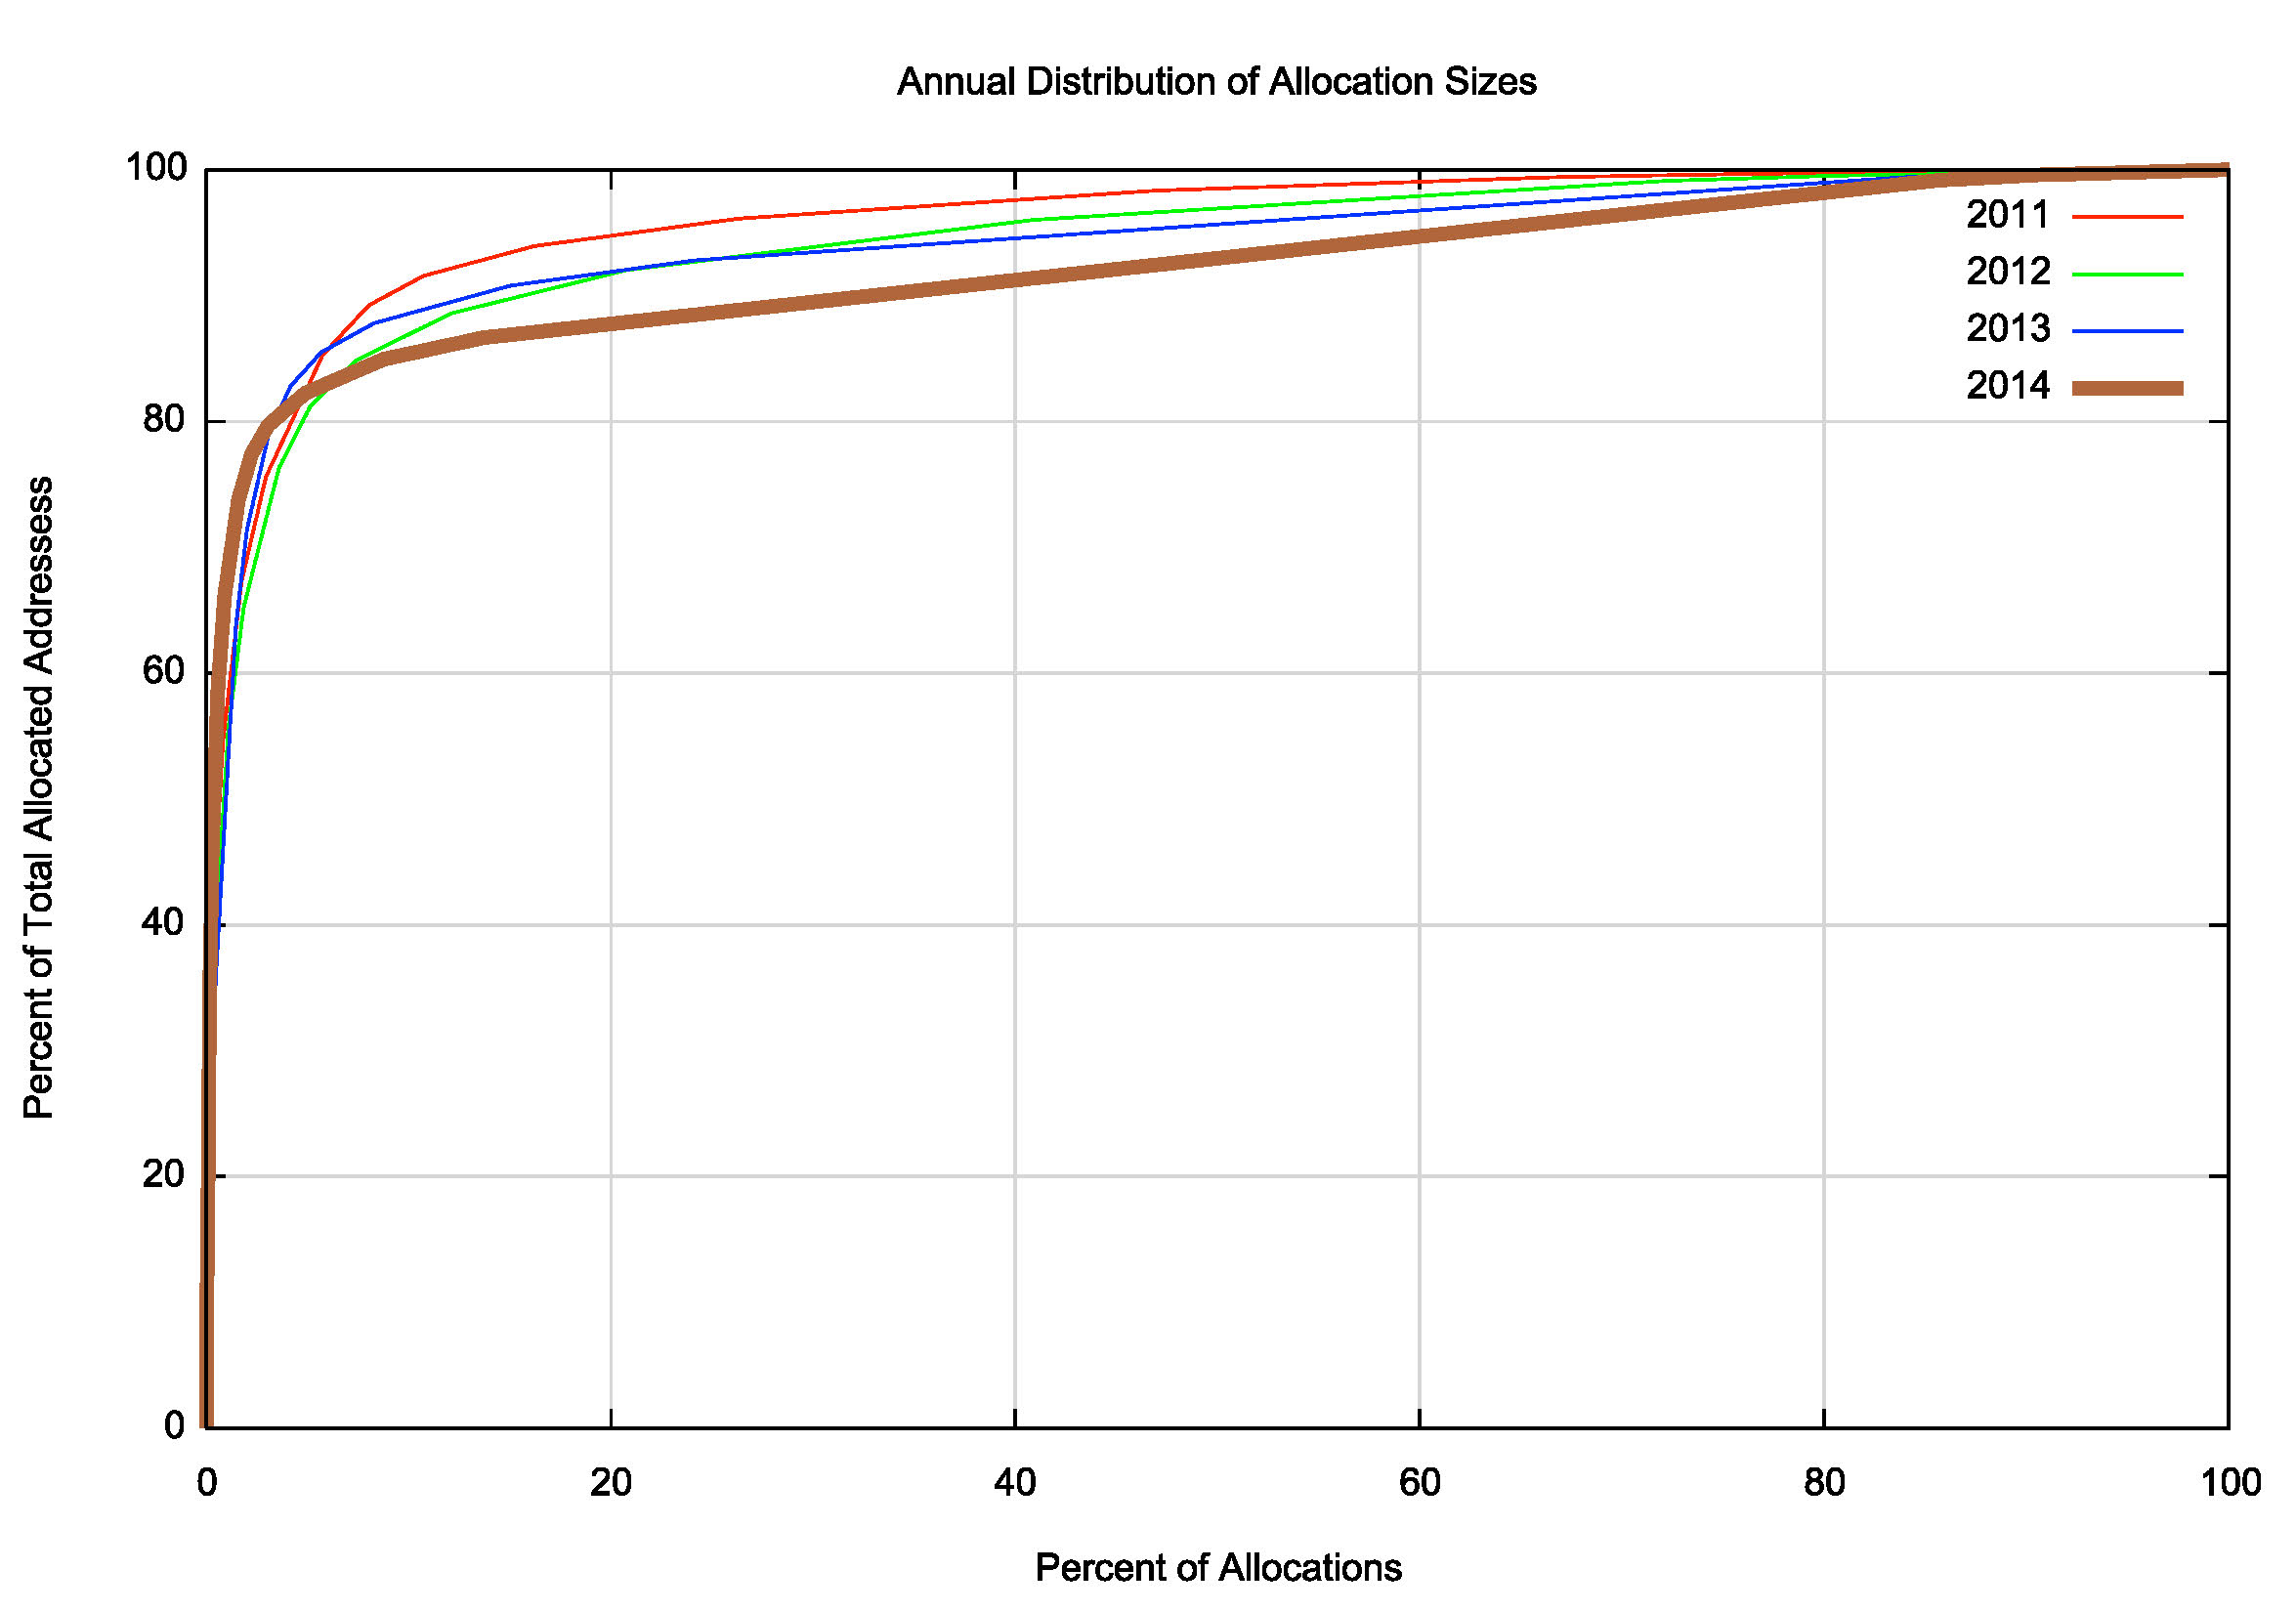
Figure 1 – IPv4 Allocation Distribution CDF 2011 – 2014
Figure 1 shows the address distribution for the years 2011 through to 2014. The shift over this period shows a relatively steady level in the proportion of address space being allocated to the larger providers. The largest 10% of allocations in 2011 received, 91.1% of the total allocated address space, which fell to 87.0% in 2012, and rose to 88.5% in 2013, and was at 85.3% in 2014. In 2011 one half of all addresses were allocated to 70 entities, while in 2012 80 entities consumed one half of all addresses, and in 2013 68 entities. In 2014 one half of the assigned address space was assigned to 39 entities (Figure 2).
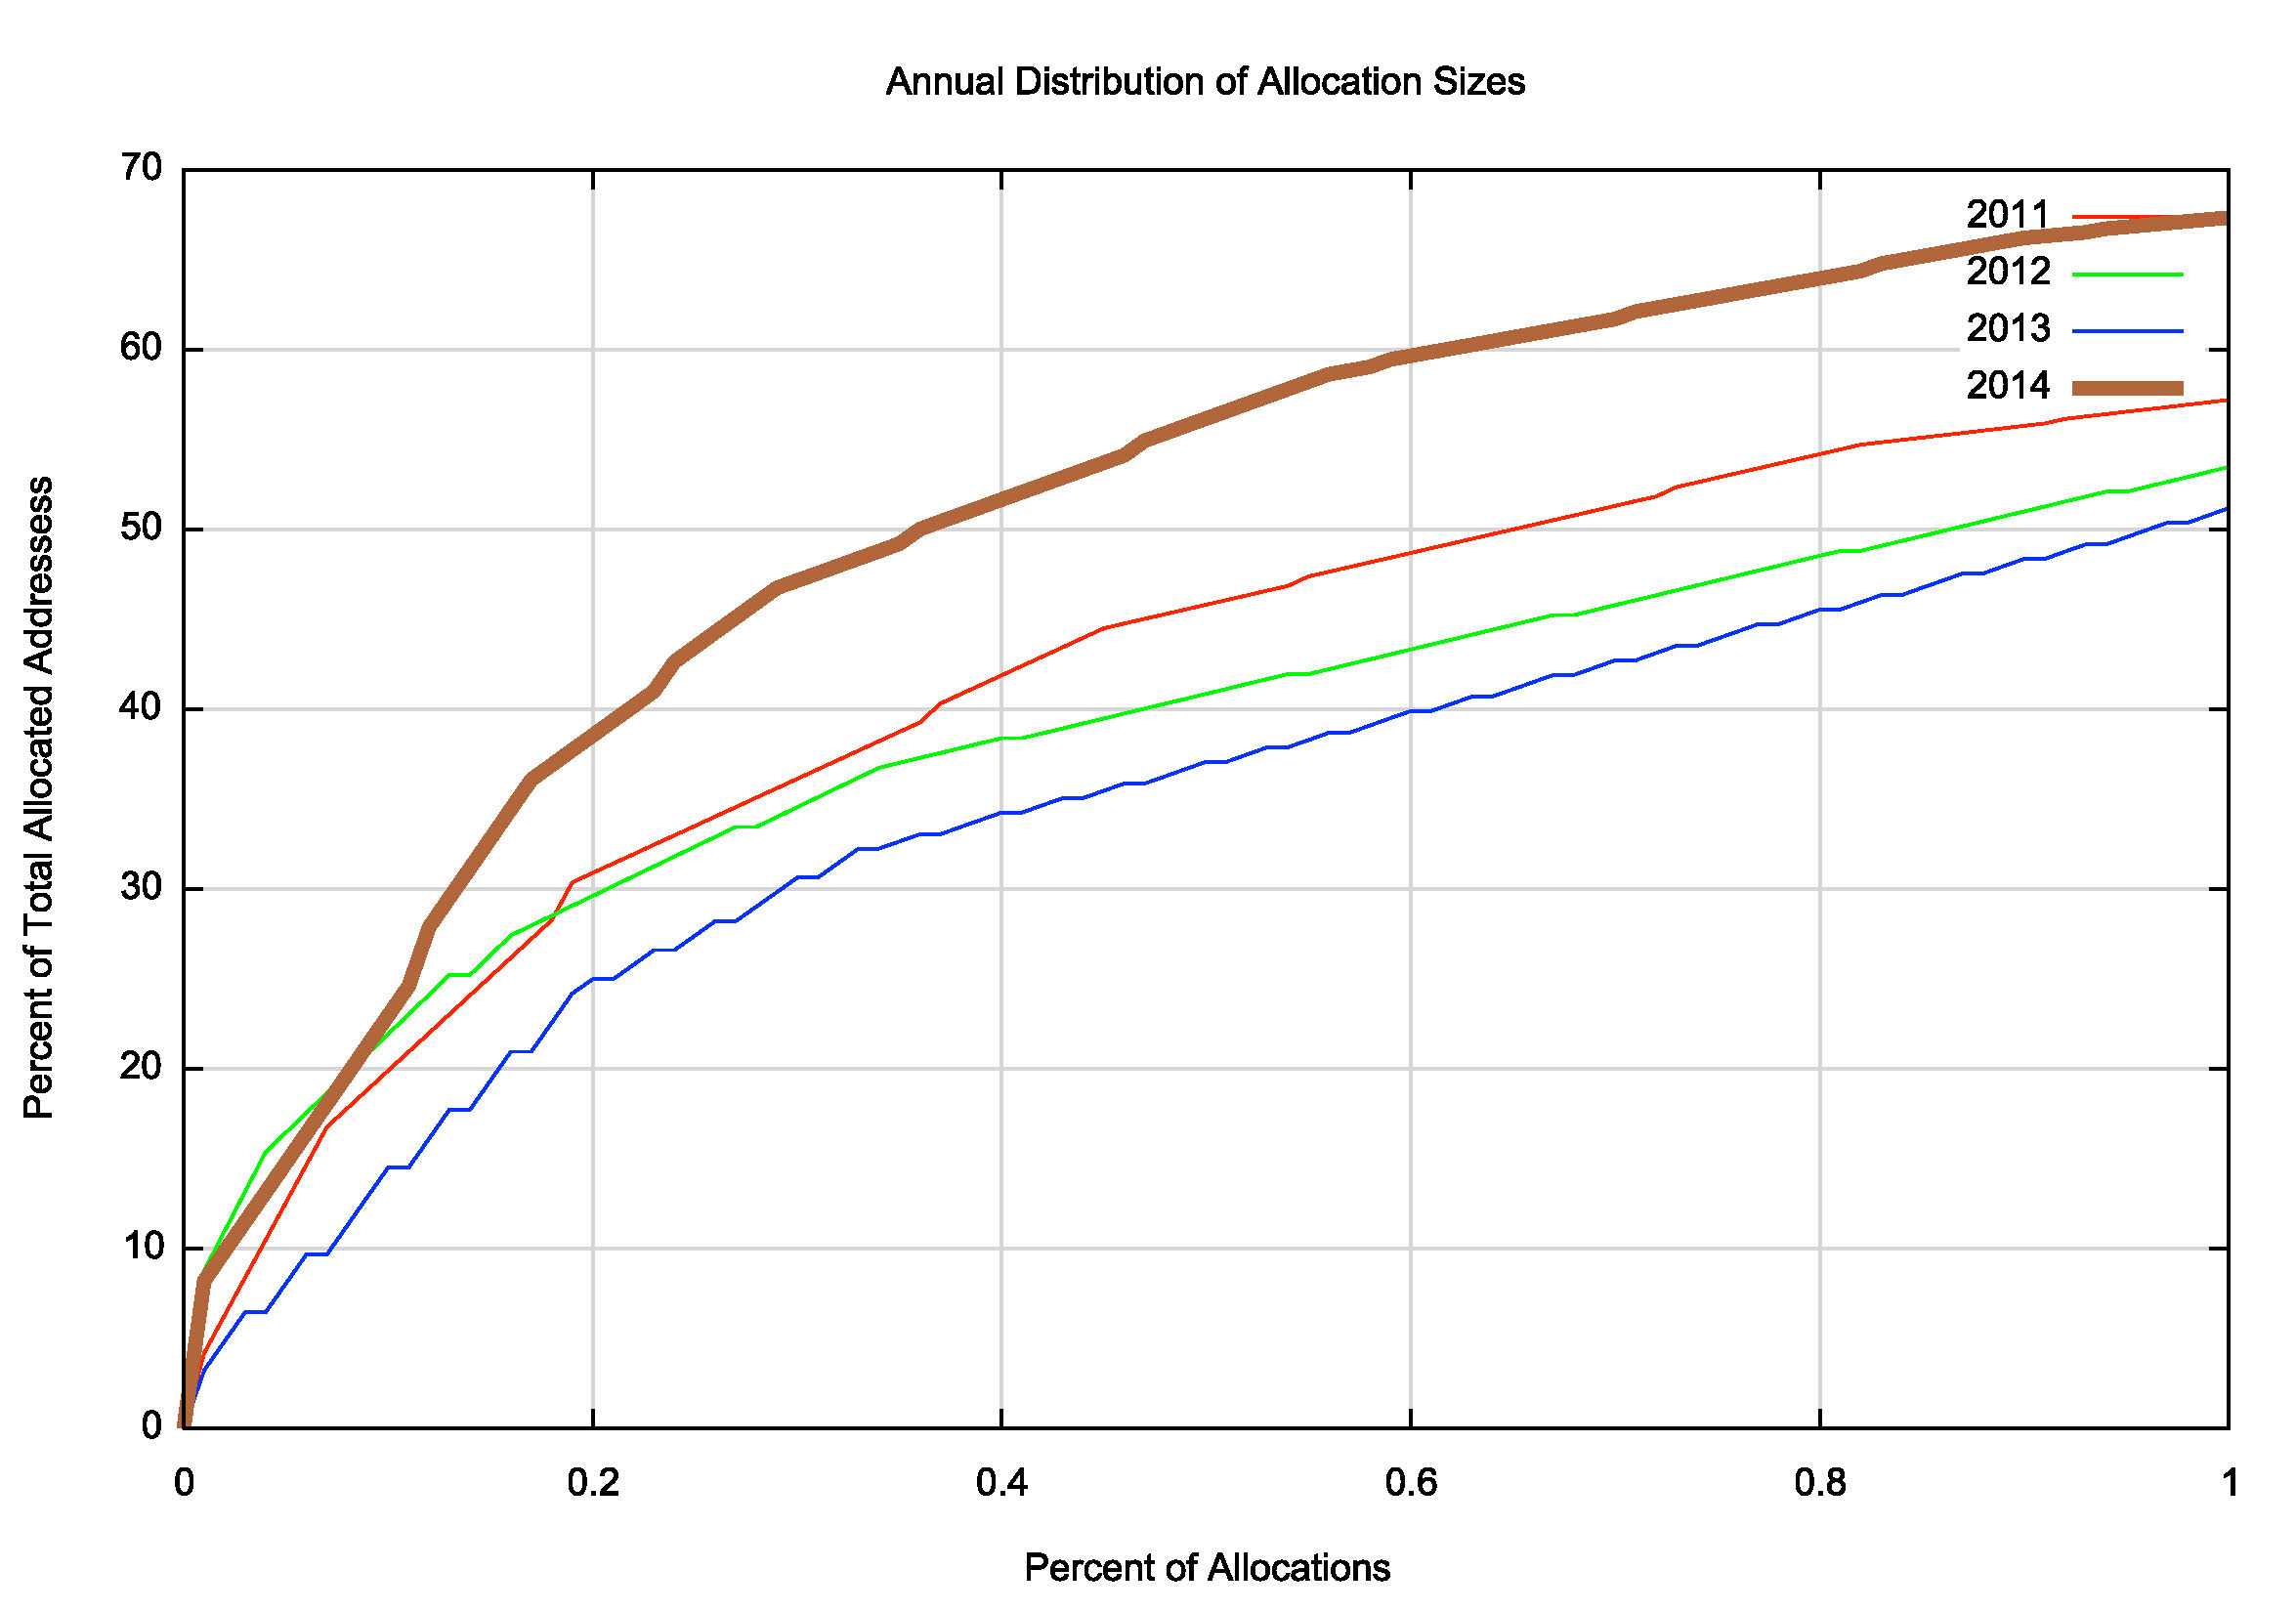
Figure 2 – IPv4 Allocation Distribution CDF 2011 – 2014 – Largest 1%
Who received the largest of these allocations in 2014? The following table lists those organisations who were allocated more than 1 million IPv4 addresses in 2014.
| Rank | Economy | Organization | Addresses (M) |
|---|---|---|---|
| 1 | United States | Akamai Technologies | 4.2 |
| 2 | United States | AT&T Internet Services | 4.2 |
| 3 | Brazil | Telefonica Brazil | 2.8 |
| 4 | United States | Amazon | 2.6 |
| 5 | Brazil | Tim Celular S.A. | 2.4 |
| 6 | Egypt | Mobinil | 1.6 |
| 7 | United States | Charter COmmunications | 1.4 |
| 8 | Brazil | Telemar Norte Leste S.A. | 1.3 |
| 9 | Morocco | Maroc Telecom | 1.0 |
| 10 | South Africa | Cell C | 1.0 |
| 11 | Mauritius | Seacom | 1.0 |
| 12 | Morocco | Wana | 1.0 |
| 13 | Kenya | Safaricom | 1.0 |
| 14 | United States | Cloud Flare | 1.0 |
| 15 | Colombia | Comcel | 1.0 |
| 16 | United States | Microsoft | 1.0 |
| 17 | South Africa | Cloud Innovation | 1.0 |
| 18 | Brazil | Grupa Seguranta Virtua | 1.0 |
| Total | 31.1 |
Table 4 – IPv4 Allocated Addresses – Top 14 allocations for 2013
This “heavy tail” distribution of the largest allocations has not always been the case. In looking at the distribution of IPv4 allocations over the past decade the following table shows the percentage of address space that were allocated to the 1% largest individual allocations and the lower half of the individual allocations.
| IPv4 Allocations | 2001 | 2002 | 2003 | 2004 | 2005 | 2006 | 2007 | 2008 | 2009 | 2010 | 2011 | 2012 | 2013 | 2014 |
|---|---|---|---|---|---|---|---|---|---|---|---|---|---|---|
| Top 1% | 30% | 39% | 38% | 38% | 51% | 45% | 51% | 47% | 50% | 49% | 60% | 63% | 51% | 67% |
| Lower 50% | 5% | 5% | 4% | 3% | 1% | 2% | 1% | 1% | 1% | 1% | 1% | 2% | 4% | 7% |
Table 5 – IPv4 Allocated addresses
What appears to have happened across the period 2000 – 2005 was a marked phase of aggregation in this industry, where the economies of scale in a mass market for Internet services started to exercise significant influence over the deployment of services on the Internet. This picture has remained relatively consistent since 2005, and the largest 100 Internet enterprises across the world appear to undertake at least one half of the volume of deployment of new Internet services. To the extent that the Internet on the 1990’s was a poster child of a strongly competitive environment and highly diverse supply industry in the communications sector, the 2000’s has seen the Internet progress into an environment which is dominated by economies of scale and large scale supplier enterprises. A marketplace that is strongly influenced by a small number of larger enterprises is often not as agile in areas of technical and service innovation, and competitive pressures are not as strong a factor when one or two providers assume a dominant market position.
The distribution of addresses in the IPv4 Internet paints a picture of an industry that has now completed a process of aggregation, and the pressures that will lead to further evolution of the Internet in the coming years will probably be different to those that drove the Internet of some years ago. This concentration of resources into a small number of carriage and service providers was initially evident in the so-called developed economies, but, as the 2014 numbers suggest, we are now seeing a similar concentration of providers appear in other parts of the world. The widespread use of mobile devices has managed to side step the capital and logistical barriers of installing a wired infrastructure as a precursor to a providing Internet access, so we are seeing various mobile providers in many parts of the world experiencing a rapid expansion in its customer base, with a corresponding demand on IP addresses.
IPv4 Address Exhaustion
The Internet continues to rely very heavily on IPv4, and the consumption of a further 64 million addresses in 2014 leaves 86 million addresses in the pool of unallocated addresses, or a total of some 16 months if we were able to access these addresses at the same rate as we have been to date. However this is not going to be the case.
As at the end of 2014 the total of allocated and assigned addresses was 3,592,775,096 (or the equivalent of 214.14 /8s). The RIRs had some 87,296,336 address (5.20/8s) marked as “available†and 17,437,432 addresses (1.04 /8s) marked as “reservedâ€. The IANA is holding 4,749,568 (0.28 /8s) in its global pool, and there are 592,708,864 (35.33 /8s) marked by the IETF as reserved for various purposes.
Assuming that the process of exhaustion will consume both the available and RIR-reserved pools as well as the IANA pool, then the total addresses left at the start of 2014 were 164,945,832. How long will these addresses last?
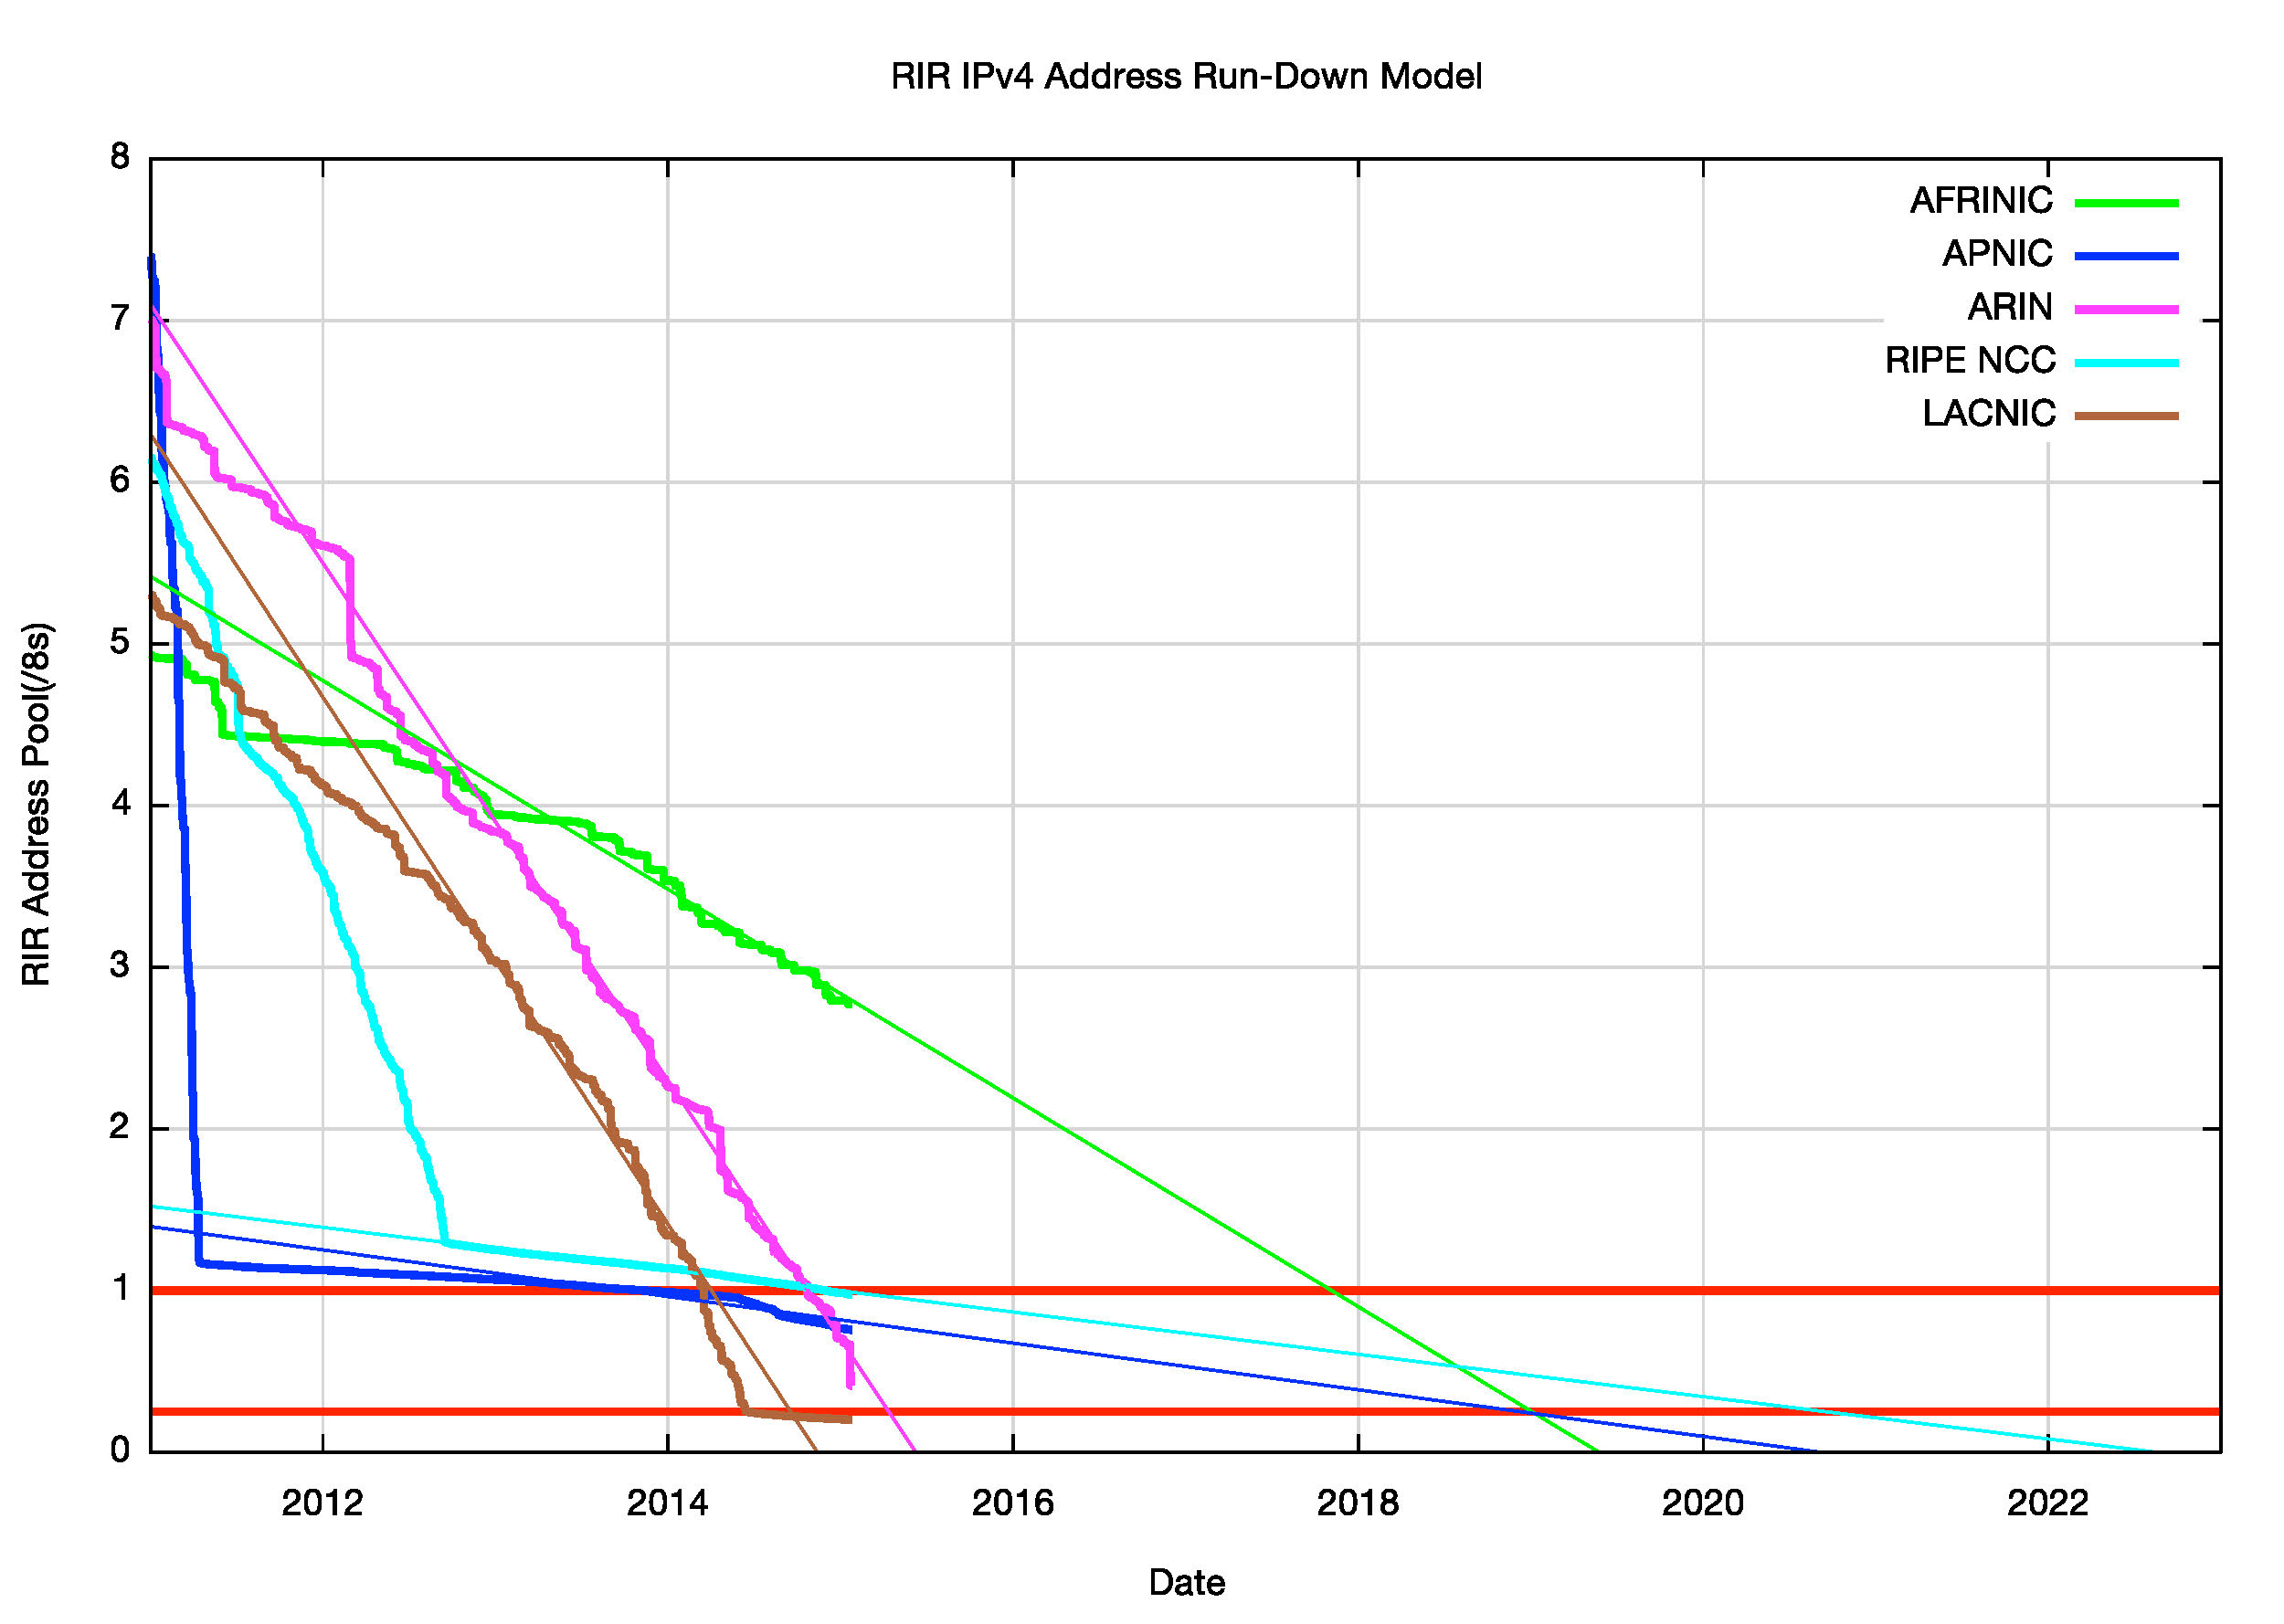
Figure 3 – RIR Address Exhaustion Model
Figure 3 shows the fit of models of address consumption on each of the RIR’s recent assignments. These figures indicate that ARIN has just a small number of months remaining before the registry exhausts its respective remaining address pool. A more detailed analysis of the situation taking into account the dispersal of the remaining IANA-held addresses leads to a current prediction of exhaustion for ARIN in late April 2015. At the current rates of address allocation the AFRINIC registry will not exhaust its address pool in 2019.
IPv4 Address Transfers
In recent years a number of RIRs (the RIPE NCC, ARIN and APNIC) have included the registration of IPv4 transfers between address holders, as a means of allowing secondary re-distribution of addresses as an alternative to return to the registry. This has been in response to the issues raised by address exhaustion, and the underlying thinking as to encourage the reuse of otherwise idle or inefficiently used address blocks through the incentives provided by a market for addresses.
The numbers of registered transfers in the past three years is shown in Table 6.
| Receiving RIR | 2012 | 2013 | 2014 |
|---|---|---|---|
| ARIN | 28 | 19 | 42 |
| APNIC | 148 | 152 | 340 |
| RIPE NCC | 9 | 154 | 919 |
| Total | 185 | 325 | 1,301 |
Table 6 – IPv4 Address Transfers per year
Obviously, the level of activity in registering the movement of addresses has increased significantly in 2014. A slightly different view is that of the volume of addresses transferred in this matter, per year.
| Receiving RIR | 2012 | 2013 | 2014 |
|---|---|---|---|
| ARIN | 4,862,720 | 3,902,720 | 2,910,208 |
| APNIC | 1,775,104 | 1,743,872 | 3,712,000 |
| RIPE NCC | 63,488 | 1,810,432 | 9,353,728 |
| Total | 6,701,312 | 7,457,024 | 15,975,936 |
Table 7 – Volume of Transferred IPv4 Addresses per year
The total volume of addresses transferred in this way has doubled in 2014. In the case of the RIPE NCC, some 2.5M addresses were assigned from the remaining pool of IPv4 address pools, while some 9.3 million addresses where moved in the registry due to transfers. In APNIC the volume of transferred addresses was much the same as the volume of assigned addresses in 2014. It appears that a certain part of the industry has turned to the market in addresses to meet its immediate requirements. However, the total volume of addresses reassigned in this manner, some 16 million, is far less than the underlying pre-exhaustion address demand levels. It appears that the address supply hiatus has firstly caused a slowdown in the growth of the Internet, which is an expected outcome in these circumstances, and secondly turned many providers to turn to use of address sharing technologies, and in particular Carrier Grade NAT on the access side and server pooling on the content side as a means of increasing the level of sharing of addresses.
How “old†are these transferred addresses? Is the address transfer market reaching back into the early so-called “legacy†allocations and assignments and reviving otherwise unused addresses and put them back into current use? A look at the relative age distribution of registered address transfers shows that the market has had some success in this area, and in 2014 one half of the addresses transferred in this manner were initially registered in 2009 or earlier (i.e. were initially registered 5 or more years previously) but the bulk of the addresses transferred were initially registered within the last 10 years (Figure 4). So the data appears to indicate that the address transfer market is reaching back further into the older records for unused addresses over time.
However, there are a couple of questions that are raised by this data.
The first is the high proportion of transferred addresses that were initially registered in the same year as the transfer. This appears to be anomalous, and there is a questions as to how each RIR treats the registry date when processing an address transfer. While APNIC appears to leave the registry date as the original date when processing a transfer, it appears that ARIN update the date field to reflect the date of the transfer. So the date field requires further detailed investigation to improve this data.
The second question is whether all of the address transfers are duly recorded in the registry system as an address transfer. This question is raised because of a simple examination of the routing system, looking at the relative age of addresses that are announced through each year. Figure 5 shows the results of a simple analysis of the addresses present in the routing table at the end of the year that were not present in the same table at the start of the year. While this is admittedly a very simple technique, it does show that in 2014 some 20% of the address advertisements of addresses that were present at the end of 2014, but not at the start of the year have a registration date of 1994 or earlier (i.e. 20 years old or older.
It appears that the routing data and the registry transfer data are pointing in slightly directions about the distribution of address transfers, so a more thorough analysis of address transfers from both the perspective of the registry system and the routing system is called for, to see if these questions can be answered in a satisfactory manner.
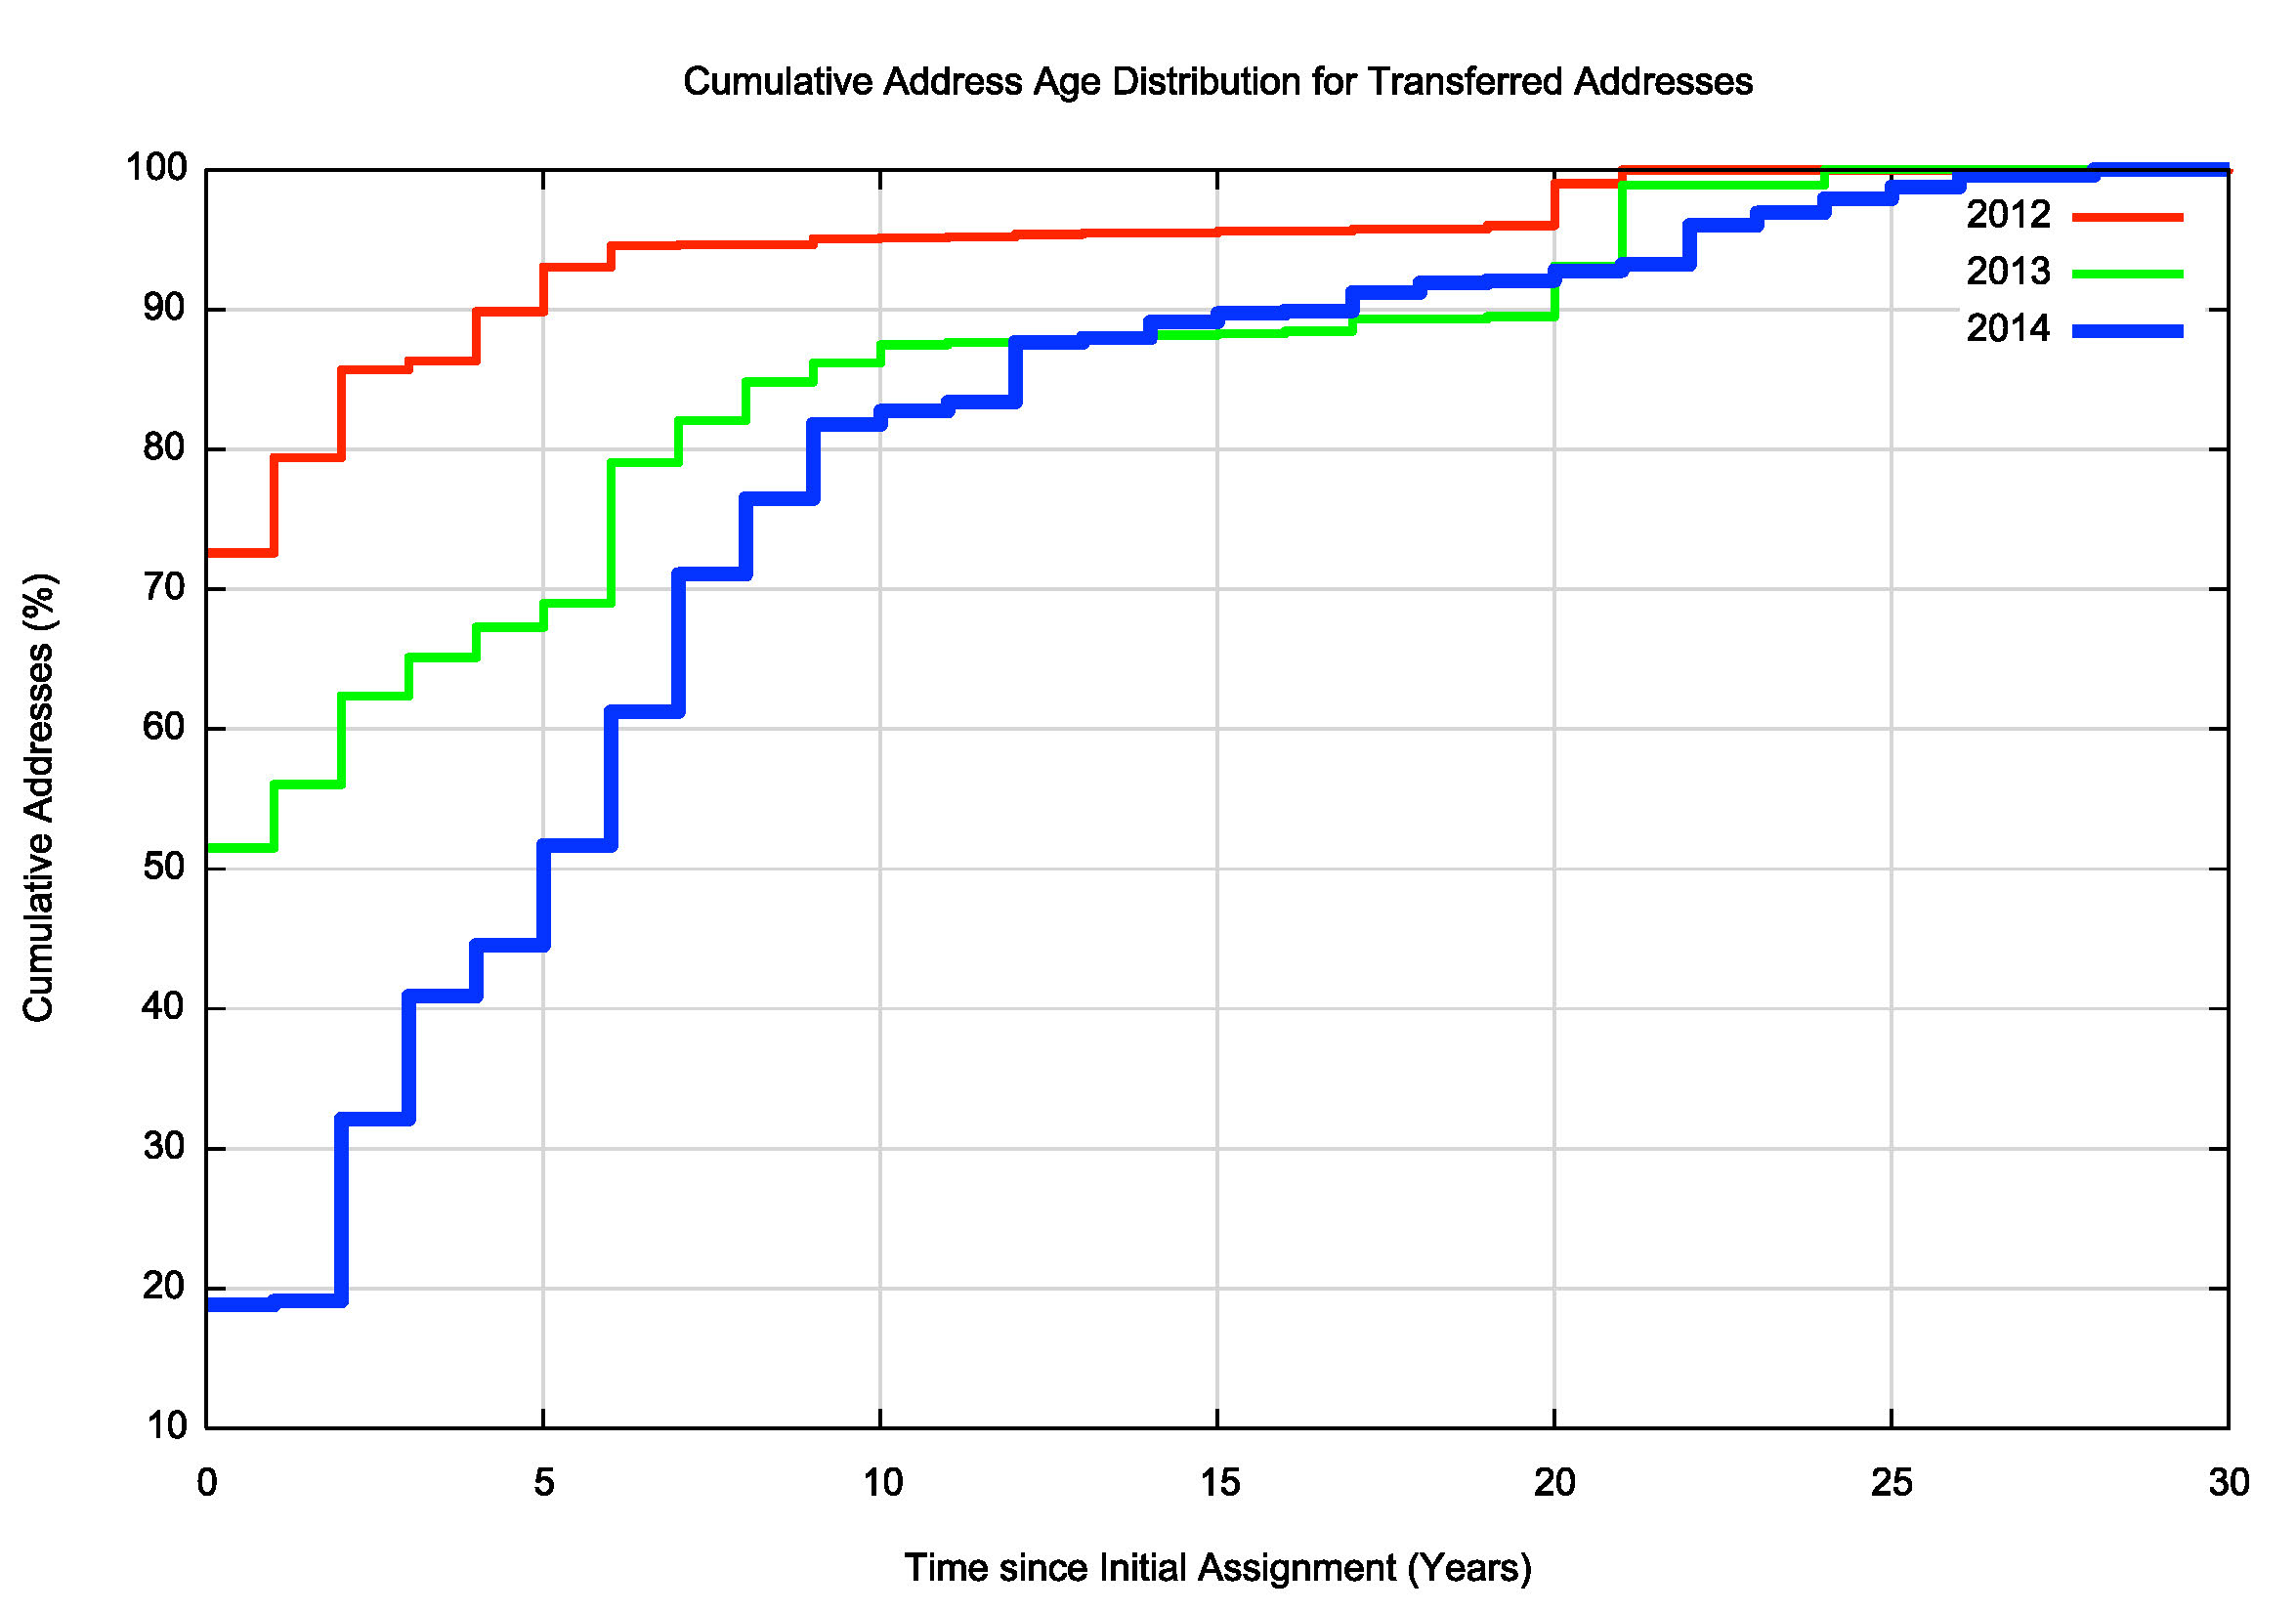
Figure 4 – Cumulative Age Distribution of Registered Address Transfers per year
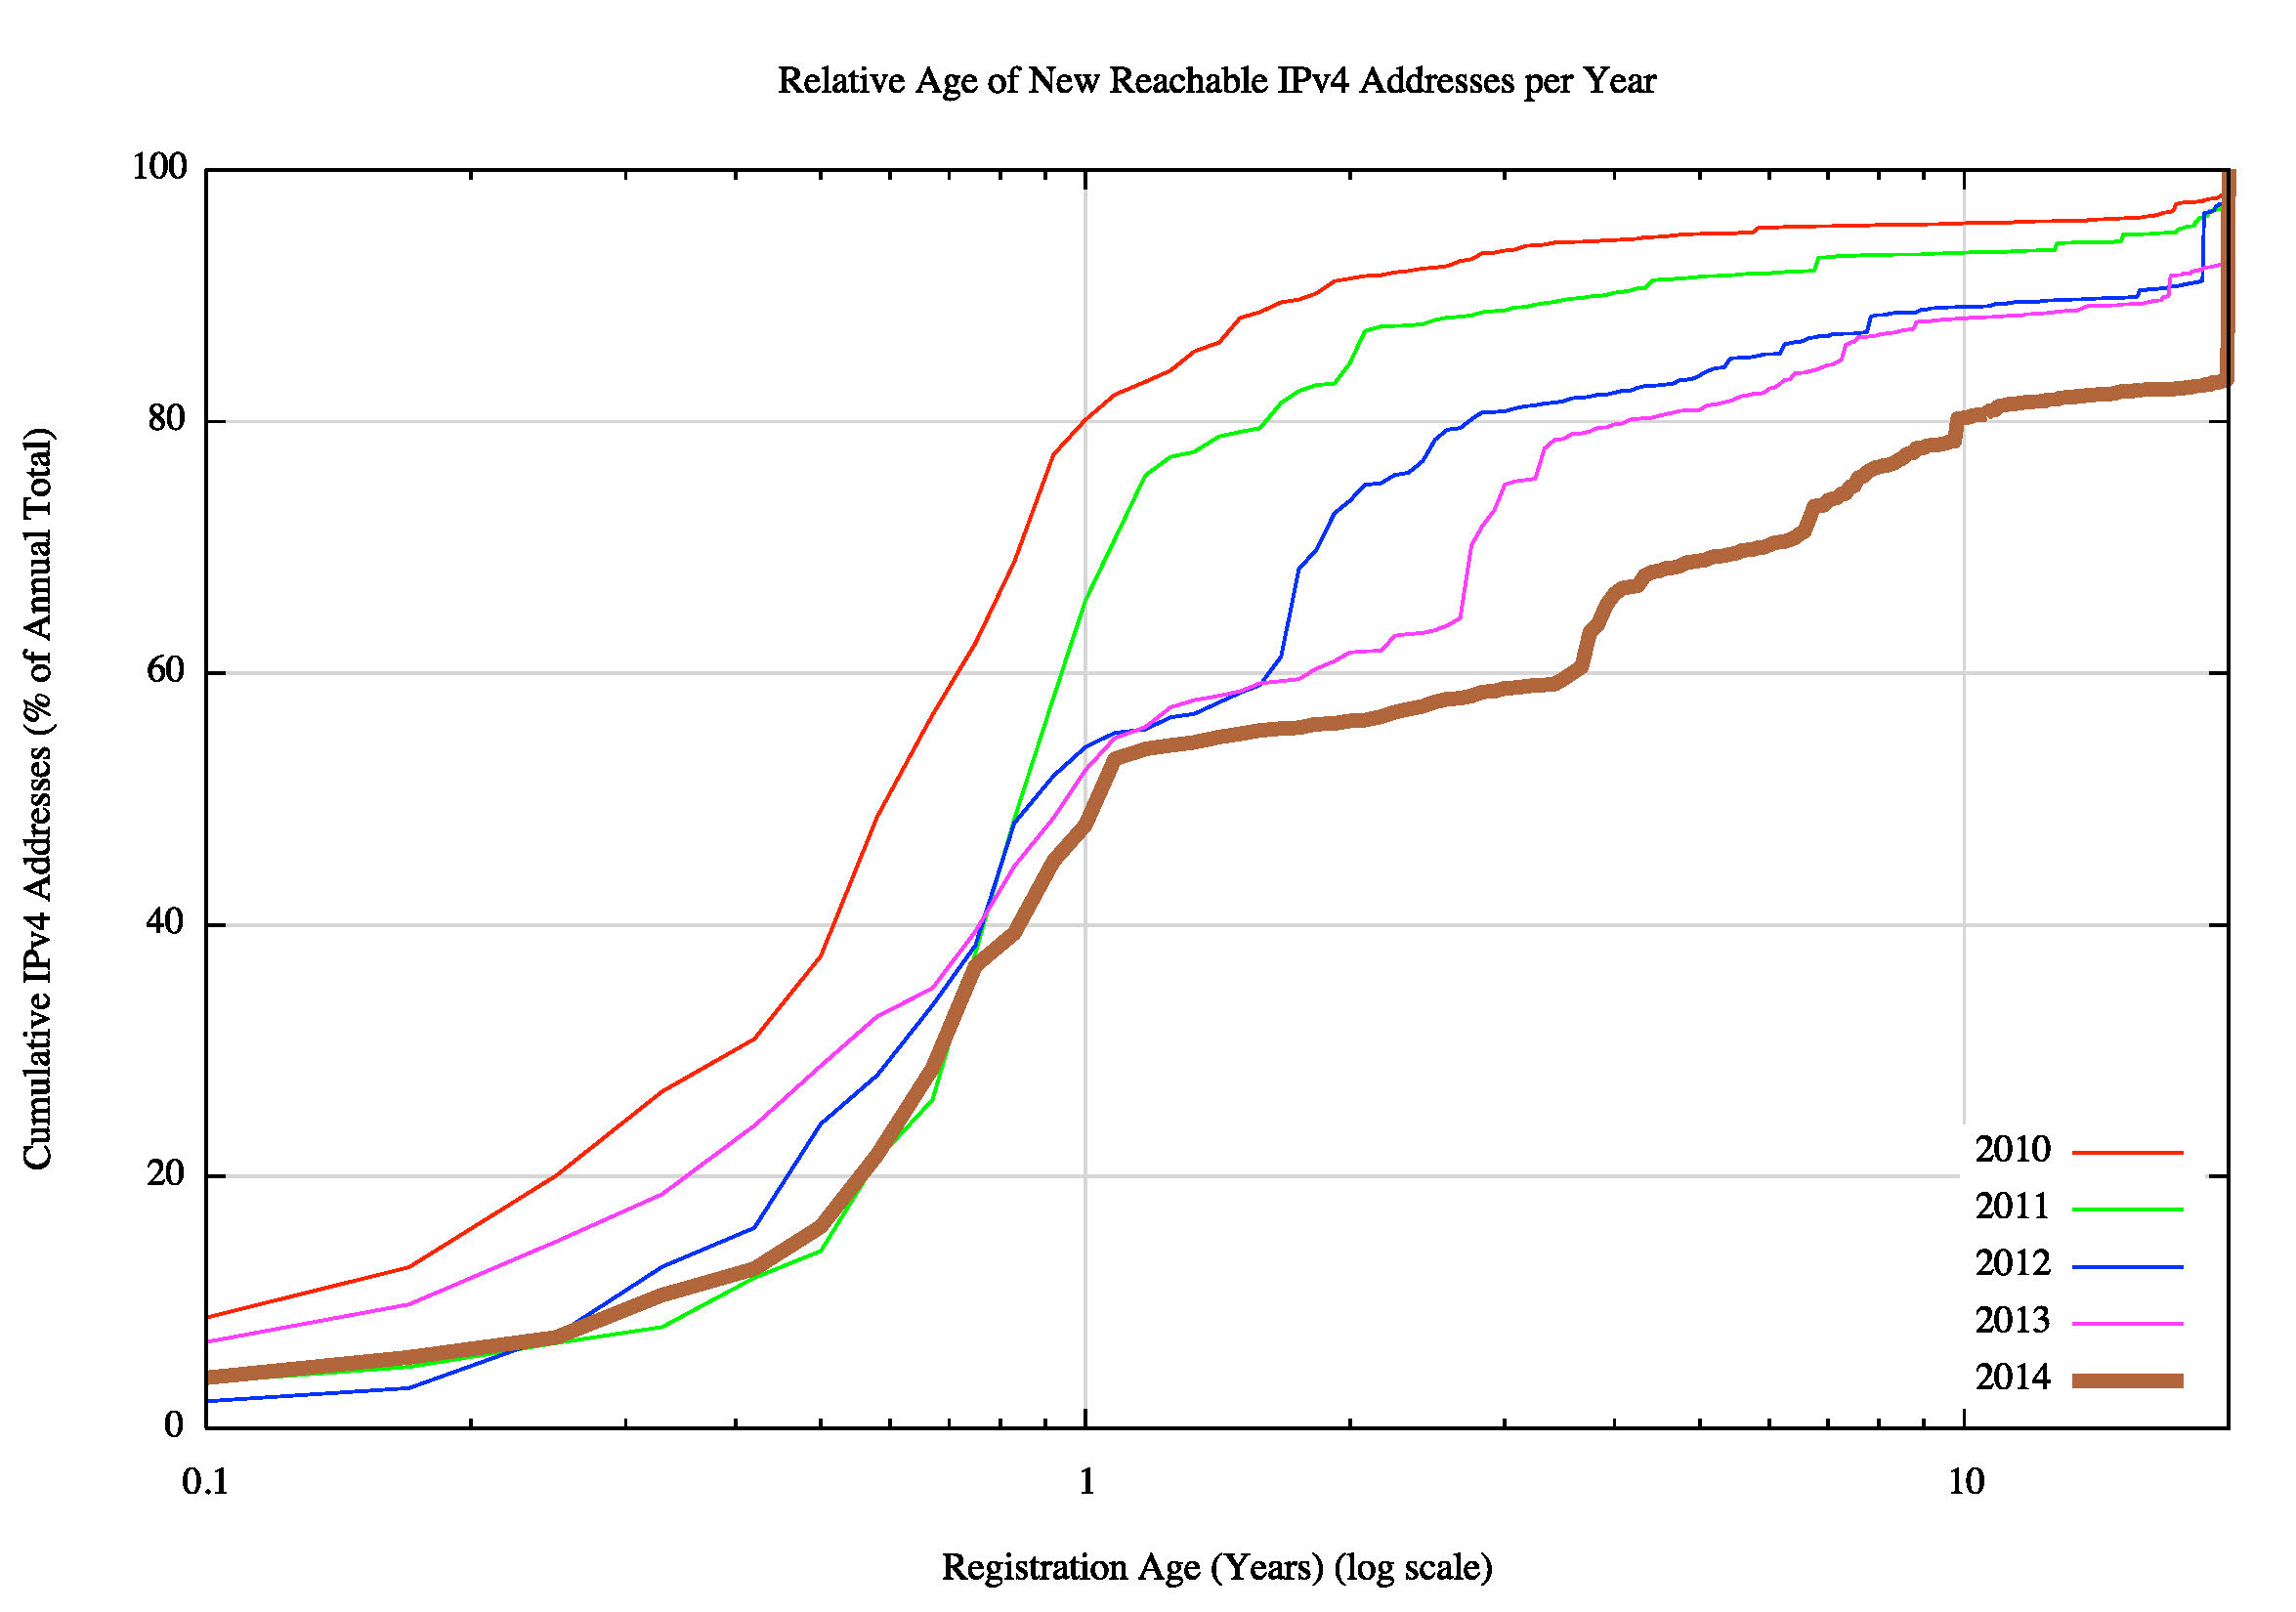
Figure 5 – Cumulative Age Distribution of Announced Addresses per year
IPv6 in 2014
These days the story of IPv4 address allocations is only half of the story, and to complete the picture its also necessary to look at how IPv6 has fared over 2014. IPv6 uses a somewhat different address allocation methodology than IPv4, and it is a matter of choice for a service provider as to how large an IPv6 address prefix is assigned to each customer. The original recommendations published by the IAB and IESG in 2001 (RFC3177) envisaged the general use of a /48 as an end site prefix. Subsequent consideration of long term address conservation saw a more flexible approach being taken with the choice of the end site prefix size being left to the service provider, and today’s IPv6 environment has some providers using a /60 end site allocation unit, many use a /56, and other providers use a /48. This variation makes a comparison of the count of allocated IPv6 addresses somewhat misleading, as an ISP using /48’s for end sites will require 256 times more address space to accommodate the same customer base as a provider who uses a /56 end site prefix, and 65,000 times more address space than an ISP using a /60 end site allocation.
So for IPv6 let’s use both the number of discrete IPv6 allocations and the total amount of space that was allocated to see how IPv6 fared in 2011.
Comparing 2012 to 2013 the number of individual allocations of IPv6 address space has risen by some 20%, from 3,304 to 4,018 allocations. While this is now more than half the number of allocations of IPv4 addresses, IPv6 still has further ground to cover to attain parity in terms of deployment with IPv4.
| Allocations | 2005 | 2006 | 2007 | 2008 | 2009 | 2010 | 2011 | 2012 | 2013 | 2014 |
|---|---|---|---|---|---|---|---|---|---|---|
| IPv6 | 240 | 234 | 475 | 860 | 1,236 | 2,436 | 3,587 | 3,304 | 4,018 | 4,528 |
| IPv4 | 4,774 | 5,646 | 6,312 | 6,969 | 6,701 | 7,758 | 10,061 | 8,619 | 7,110 | 10,853 |
Table 8 – Number of individual Address Allocations, 2005 – 2012
The amount of IPv6 address space distributed in 2013 had risen by some 40% over 2012 levels, but in 2014 the total volume of allocated addresses fell by the same amount, back to the same total volume of addresses as in 2012. The number of allocations increased, however, indicating that 2014 there were no anomalous extremely large allocations of IPv6 address space through this last year
| Addresses | 2005 | 2006 | 2007 | 2008 | 2009 | 2010 | 2011 | 2012 | 2013 | 2014 |
|---|---|---|---|---|---|---|---|---|---|---|
| IPv6 (/32s) | 26,991 | 9,792 | 6,678 | 80,996 | 1,064 | 5,835 | 15,018 | 17,756 | 24,107 | 17,784 |
| IPv4 (/32s)(M) | 174.4 | 168.1 | 203.9 | 203.3 | 189.4 | 248.8 | 201.0 | 114.9 | 65.1 | 63.9 |
Table 9 – Volume of Address Allocations, 2005 – 2012
Regionally, 2014 has been a mixed year for IPv6. For the LACNIC, serving Latin America and the Caribbean, there was a significant growth in the number of IPv6 allocations over the past year. But the other four registries saw a level of allocation activity in 2014 that was either slightly higher (in the case of the RIPE NCC) or slightly lower (in the other cases) than the 2013 activity levels.
| Allocations | 2005 | 2006 | 2007 | 2008 | 2009 | 2010 | 2011 | 2012 | 2013 | 2014 |
|---|---|---|---|---|---|---|---|---|---|---|
| RIPE NCC | 93 | 89 | 158 | 427 | 622 | 1,042 | 1,647 | 1,756 | 2,149 | 2,218 |
| ARIN | 59 | 69 | 210 | 227 | 378 | 623 | 1,038 | 611 | 560 | 512 |
| APNIC | 54 | 43 | 63 | 161 | 190 | 666 | 641 | 599 | 540 | 528 |
| LACNIC | 31 | 16 | 25 | 29 | 33 | 50 | 132 | 253 | 696 | 1,208 |
| AFRINIC | 3 | 17 | 19 | 16 | 13 | 55 | 129 | 83 | 73 | 62 |
| 240 | 234 | 475 | 860 | 1,236 | 2,436 | 3,587 | 3.302 | 4,018 | 4,528 |
Table 10 – IPv6 allocations by RIR
The assignment data tells a slightly different story. Table 11 shows the number of allocated IPv6 /32’s per year and dividing addresses by allocations gives the average IPv6 allocation size in each region (Table 12). The volume of addresses assigned by LACNIC and the RIPE NCC increased in 2014 over the 2013 levels but declined significantly in ARIN, and APNIC. The average address block being allocated in ARIN remains significantly larger than any of the other RIR.
| IPv6 Addresses (/32s) | 2005 | 2006 | 2007 | 2008 | 2009 | 2010 | 2011 | 2012 | 2013 | 2013 | 2014 |
|---|---|---|---|---|---|---|---|---|---|---|---|
| RIPE NCC | 17,495 | 6,481 | 1,251 | 606 | 602 | 1,867 | 2,425 | 3,729 | 6,390 | 8,565 | |
| ARIN | 57 | 52 | 137 | 14,488 | 249 | 579 | 2,280 | 1,675 | 12,580 | 5,232 | |
| APNIC | 9,373 | 3,226 | 5,237 | 141 | 174 | 3,239 | 9,506 | 3,807 | 4,662 | 2,663 | |
| LACNIC | 53 | 16 | 39 | 65,749 | 30 | 46 | 652 | 4,325 | 608 | 1,363 | |
| AFRINIC | 3 | 17 | 14 | 12 | 9 | 104 | 155 | 4,203 | 67 | 51 | |
| 26,981 | 9,792 | 6,678 | 80,996 | 1,064 | 5,835 | 15,018 | 17,739 | 24,107 | 17,784 |
Table 11 – IPv6 address allocation volumes by RIR
| Average IPv6 Allocation | 2005 | 2006 | 2007 | 2008 | 2009 | 2010 | 2011 | 2012 | 2013 | 2014 |
|---|---|---|---|---|---|---|---|---|---|---|
| RIPE NCC | 188.12 | 72.82 | 7.92 | 1.42 | 0.97 | 1.79 | 1.47 | 2.12 | 2.97 | 3.86 |
| ARIN | 0.97 | 0.75 | 0.65 | 63.82 | 0.66 | 0.93 | 2.20 | 2.74 | 22.46 | 10.22 |
| APNIC | 173.57 | 75.02 | 83.13 | 0.88 | 0.92 | 4.86 | 14.83 | 6.36 | 8.63 | 5.04 |
| LACNIC | 1.71 | 1.00 | 1.56 | 2,267.21 | 0.91 | 0.92 | 4.94 | 17.09 | 0.87 | 1.13 |
| AFRINIC | 1.00 | 1.00 | 0.74 | 0.75 | 0.69 | 1.89 | 1.20 | 50.64 | 0.92 | 0.82 |
| 112.42 | 41.85 | 14.06 | 94.18 | 0.86 | 2.40 | 4.19 | 5.37 | 6.05 | 3.93 |
Table 12 – Average IPv6 address allocation size by RIR
| Rank | 2009 | 2010 | 2011 | 2012 | 2013 | 2014 | ||||||
|---|---|---|---|---|---|---|---|---|---|---|---|---|
| 1 | United States | 349 | United States | 556 | United States | 924 | United States | 549 | United States | 485 | Brazil | 946 |
| 2 | Germany | 86 | Australia | 146 | Australia | 176 | UK | 199 | Brazil | 473 | United States | 457 |
| 3 | UK | 66 | Germany | 124 | Germany | 160 | Germany | 187 | UK | 248 | UK | 239 |
| 4 | Netherlands | 56 | UK | 106 | UK | 150 | Russia | 186 | Russia | 246 | Germany | 215 |
| 5 | Australia | 53 | Russia | 102 | Russia | 147 | Netherlands | 124 | Germany | 195 | Russia | 201 |
| 6 | Russia | 46 | Netherlands | 86 | France | 110 | Australia | 113 | Netherlands | 134 | Netherlands | 181 |
| 7 | Japan | 32 | China | 86 | Canada | 107 | France | 111 | France | 132 | France | 122 |
| 8 | France | 29 | Indonesia | 72 | Netherlands | 107 | Sweden | 90 | Sweden | 112 | Switzerland | 103 |
| 9 | Czech Rep. | 29 | Japan | 62 | Sweden | 96 | Argentina | 78 | Australia | 102 | Italy | 103 |
| 10 | Sweden | 27 | France | 60 | Czech Rep. | 88 | Poland | 77 | Italy | 98 | Australia | 101 |
Table 13 – IPv6 allocations by Economy
Table 13 shows the countries who received the largest number of IPv6 allocations, while Table 14 shows the amount of IPv6 address space assigned on a per economy basis for the past 5 years (using units of /32s). The volume of allocated IPv6 addresses was significantly lower in 2014 in the two largest countries of IPv6 allocations, the United States and China, while the level of activities in the next 8 largest countries was higher in 2014 over that of 2013.
| Rank | 2009 | 2010 | 2011 | 2012 | 2013 | 2014 | ||||||
|---|---|---|---|---|---|---|---|---|---|---|---|---|
| 1 | United States | 225 | Japan | 2,518 | China | 8,997 | Argentina | 4,178 | United States | 12,553 | United States | 4,930 |
| 2 | Germany | 143 | Germany | 600 | United States | 2,205 | Egypt | 4,098 | China | 4,135 | China | 2,127 |
| 3 | UK | 61 | United States | 523 | Spain | 641 | China | 3,136 | UK | 791 | UK | 1,090 |
| 4 | Australia | 45 | China | 339 | UK | 384 | United Sates | 1,346 | Germany | 654 | Brazil | 863 |
| 5 | Netherlands | 44 | Belgium | 270 | Venezuela | 262 | Italy | 635 | Russia | 529 | Germany | 749 |
| 6 | Russia | 43 | France | 181 | Mexico | 261 | Russia | 414 | Netherlands | 488 | Netherlands | 719 |
| 7 | Japan | 33 | Australia | 100 | Netherlands | 229 | Germany | 380 | Brazil | 450 | Russia | 716 |
| 8 | France | 24 | Sweden | 94 | Germany | 187 | UK | 353 | France | 429 | France | 436 |
| 9 | Czech Rep. | 21 | Russia | 94 | Russia | 146 | Canada | 325 | Italy | 339 | Italy | 410 |
| 10 | Sweden | 21 | UK | 94 | Australia | 124 | Japan | 283 | Poland | 275 | Switzerland | 336 |
Table 14 – IPv6 Address Allocation Volumes by Economy
The major IPv6 allocations in 2013 by end entity are shown in Table 15.
| Rank | Country | Organisation | Address Count (/32s) |
|---|---|---|---|
| 1 | United States | Comcast | 4,096 |
| 2 | China | Research Institute of Petroleum Exporation and Development | 2,048 |
| 3 | United States | Amazon | 512 |
| 4 | Jamaica | Flow | 256 |
| 5 | Trinidad | Columbus Communications | 256 |
| 6 | United States | Microsoft | 256 |
| 7 | Iran | Asiatech Data Transfer | 255 |
| 8 | Sweden | Com Hem AB | 16 |
| 9 | United States | Southern New England Telephone Company | 16 |
| 10 | Venezuela | Telefonica Venezuela | 16 |
Table 15 – Largest IPv6 Address Allocations in 2012 by Organisation
Notable here are is the large allocation to Comcast, one of the worlds largest ISPs, in support of their major program of IPv6 deployment across their entire access network. Com Hem has a similar role as a large scale access provider in Sweden, and similar allocations have been made in Venezuela, Jamaica and Trinidad. The allocations to Amazon and Microsoft point to those enterprises looking to support their cloud services with IPv6.
The Outlook for the Internet
The past five years has shown that the Internet is now an integral part of the portfolio of conventional communications sector business activity across the world, and the deployment of internet services and the opening up of markets through deployment of Internet services is subject to the same economic opportunities and constraints as any other business activity. Those economies that were adversely impacted by the global financial situation saw a drop in the expansion of new Internet services and a drop in their demands for IP address allocations across 2009-2011, while other economies that managed to avoid the worst impacts of a financial recession continued to see growth in new Internet markets across those years.
The past five years has been dominated by the mass marketing of mobile internet services, and the growth rates for 2013 and 2014 perhaps might have been the highest so far recorded were it not for the exhaustion of the IPv4 address pool. In address terms this growth in the IPv4 Internet is being masked by the use of Carrier Grade NATs in the mobile service provider environment, so that the resultant demands for public addresses in IPv4 are quite low and the real underlying growth rates in the network are occluded by these NATs.
In theory there is no such requirement for IPv6 to use NATS, and if the mobile world were deploying dual stack ubiquitously then this would be evident in the IPv6 address allocation data. Unfortunately no such very large scale broad scale of deployment of IPv6 was visible in the address statistics for 2014. This points to a mobile Internet whose continued growth in 2014 remains, for the most part, highly reliant on NATs, and this, in turn, points to some longer term elements of concern for the continued ability of the Internet to support further innovation and diversification in its portfolio of applications and services.
Over the coming few months we will witness the final stages of address exhaustion in IPv4 in North America. It would be heartening to think that at the same time we are going to see some further significant moves in the deployment of IPv6, building upon the 2014 initiatives in mass deployment of IPv6 access services by Comcast, AT&T, Deutsche Telecom and Verizon, fuelled by this increasing pressure of address scarcity. However, while there are now visible signs of IPv6 deployment in some of the largest access providers, the momentum has yet to extend to others, and much of the current 3% of Internet users who can use IPv6 do so due to the efforts of just some 25 ISPs around the Internet. This is causing an uncomfortable level of ossification in the lower layers of the infrastructure of the Internet, and this should a concern for us all.
We are witnessing an industry that is no longer using technical innovation, openness and diversification as its primary means of propulsion. The widespread use of NATs in IPv4 limit the technical substrate of the Internet to a very restricted model of simple client/server interactions using TCP and UDP. The use of NATs force the interactions into client-initiated transactions, and the model of an open network with considerable flexibility in the way in which communications take place is no longer being sustained in today’s network. The scarcity of addresses leads to greater levels of uncertainty in the industry and that leads to investor nervousness. So the incumbents entrench their position and innovation and entrepreneurialism are taking a back seat while we sit out this entire IPv4/IPv6 transition mess! Would that there was a way to speed this up and get through this entire process within a few months rather than this protracted agony of ever-stranger and ever more complex ways of trying to keep IPv4 alive while at the same time tying ourselves in convoluted knots over dual stack support.
What is happening is that today’s internet is serviced by a far smaller number of very large players, each of whom appear to be assuming a very strong position within their respective markets. The drivers for such larger players tend towards risk aversion, conservatism and increased levels of control across their scope of operation. The same trends of market aggregation are now appearing in content provision, where a small number of content providers are exerting a dominant position across the entire Internet. The result is what while we have seen a large scale shift of video services onto the Internet, so that now it appears that some three quarters of the volume of traffic on the Internet is made up of streaming video, other aspects of change, notably in the area of consumer products that will make up the Internet of Things are not happening. This particular market relies on high volume production of simple low cost self-managed devices that work reliably in a simple operational model that contains no need for user configuration. The continuing uncertainties over the issue of the Internet’s protocol transition add unwanted uncertainty and complexity to this picture, which appears to form a disincentive for the large scale commitments that are required to achieve the necessary production scales for this activity. So while the predictions for the size and value of this activity continue to paint a bright picture for the future, the extenuated hiatus caused by the sluggish progress of protocol transition is adding some delay into the mix.
The evolving makeup of the Internet industry has quite profound implications in terms of network neutrality, the separation of functions of carriage and service provision, investment profiles and expectations of risk and returns on infrastructure investments, and on the openness of the Internet itself. The focus now is turning to the regulatory agenda, and in some countries, notably in the United States these issues have reached all the way to the Executive. Given the economies of volume in this industry, it was always going to be challenging to sustain an efficient, fully open and competitive industry, but the degree of challenge in this agenda is multiplied many-fold when the underlying platform has run out of the basic currency of IP addresses. The pressures on the larger players within these markets to leverage their incumbency into overarching control gains traction when the stream of new entrants with competitive offerings dries up, and the solutions in such scenarios typically involve some form of public sector intervention directed to restore effective competition and revive the impetus for more efficient and effective offerings in the market. As the Internet continues to evolve, it is no longer the technically innovative challenger to an old and venerable incumbents in the forms of the traditional industries of telephony, print newspapers, television entertainment and social interaction. It is now the established norm. The days when the Internet was touted as a poster child of disruption in a deregulated space are long since over, and these days we appear to be increasingly looking further afield for a regulatory and governance framework that can continue to challenge the increasing complacency of the newly-established incumbents. It is unclear how successful we will be in this search.
But at this point in time we can but wait and see.