How well are we doing with the adoption of Route Origin Validation in the Inter-Domain routing space?
There have been many workshops and training sessions and much in the way of counting the generation of RPKI certificates and Route Origin Attestations in recent months. The data published by the US National Institute of Standards and Technology (NIST) in its RPKI monitor is a good example (https://rpki-monitor.antd.nist.gov). Around 20% of the announced prefix / origin AS pairs have an associated valid ROA. This is a good example of production measurements that track the adoption of technology through the measurement of the infrastructure itself.
However, there is another aspect of the measurement of this technology, and that is as a user measurement. How many users can no longer reach a destination if the only available ROAs mark the destination announcement as invalid? Ideally, if this technology was fully deployed, then the answer to such a question would be “all users”. But what do we mean by fully deployed in the routing system? This might sound like an odd question, but it’s useful to remember that the topology of the interdomain routing system is not a fully interconnected mesh. It is far more like a hierarchical topology where the overall majority of networks are stub networks that have a single connection to an upstream transit network. Using the vantage point of the Route-Views Route Collector (routeviews.org) there are currently some 58,000 such stub networks and 11,000 transit networks on the IPv4 topology and 16,000 stub networks and 4,000 transit networks in IPv6. To prevent users from reaching a destination it is only necessary at a global level to remove the route from the transit networks. This is to some extent a simplification, but it does contain an essential truth, that to remove a route from the Internet at large it is only necessary to remove it from the “default free zone” on the routing system, as well as clearing it out from local peering sessions.
This removal of an invalid route from the default-free zone of the Internet gives us a method to measure the effectiveness of uptake of Invalid ROA filtering through the impact of reachability. In this measurement we have set up an announcement of a route into the default-free zone, and we periodically change the ROV status of the route from valid to invalid and back by revoking the previous ROA and issuing a new ROA at each phase transition.
Phase Changes in ROAs
How long should we maintain a ROA state? Is the scale of this system sensitive to states that last only a few seconds, or does the state need to be held for hours, or even days, in order for all validating entities to detect the ROA change?
We set up a delegated RPKI system for this measurement. Figure 1 shows the average re-query interval for each RPKI client (as determined by a unique IP address) over a 90-day measurement window.
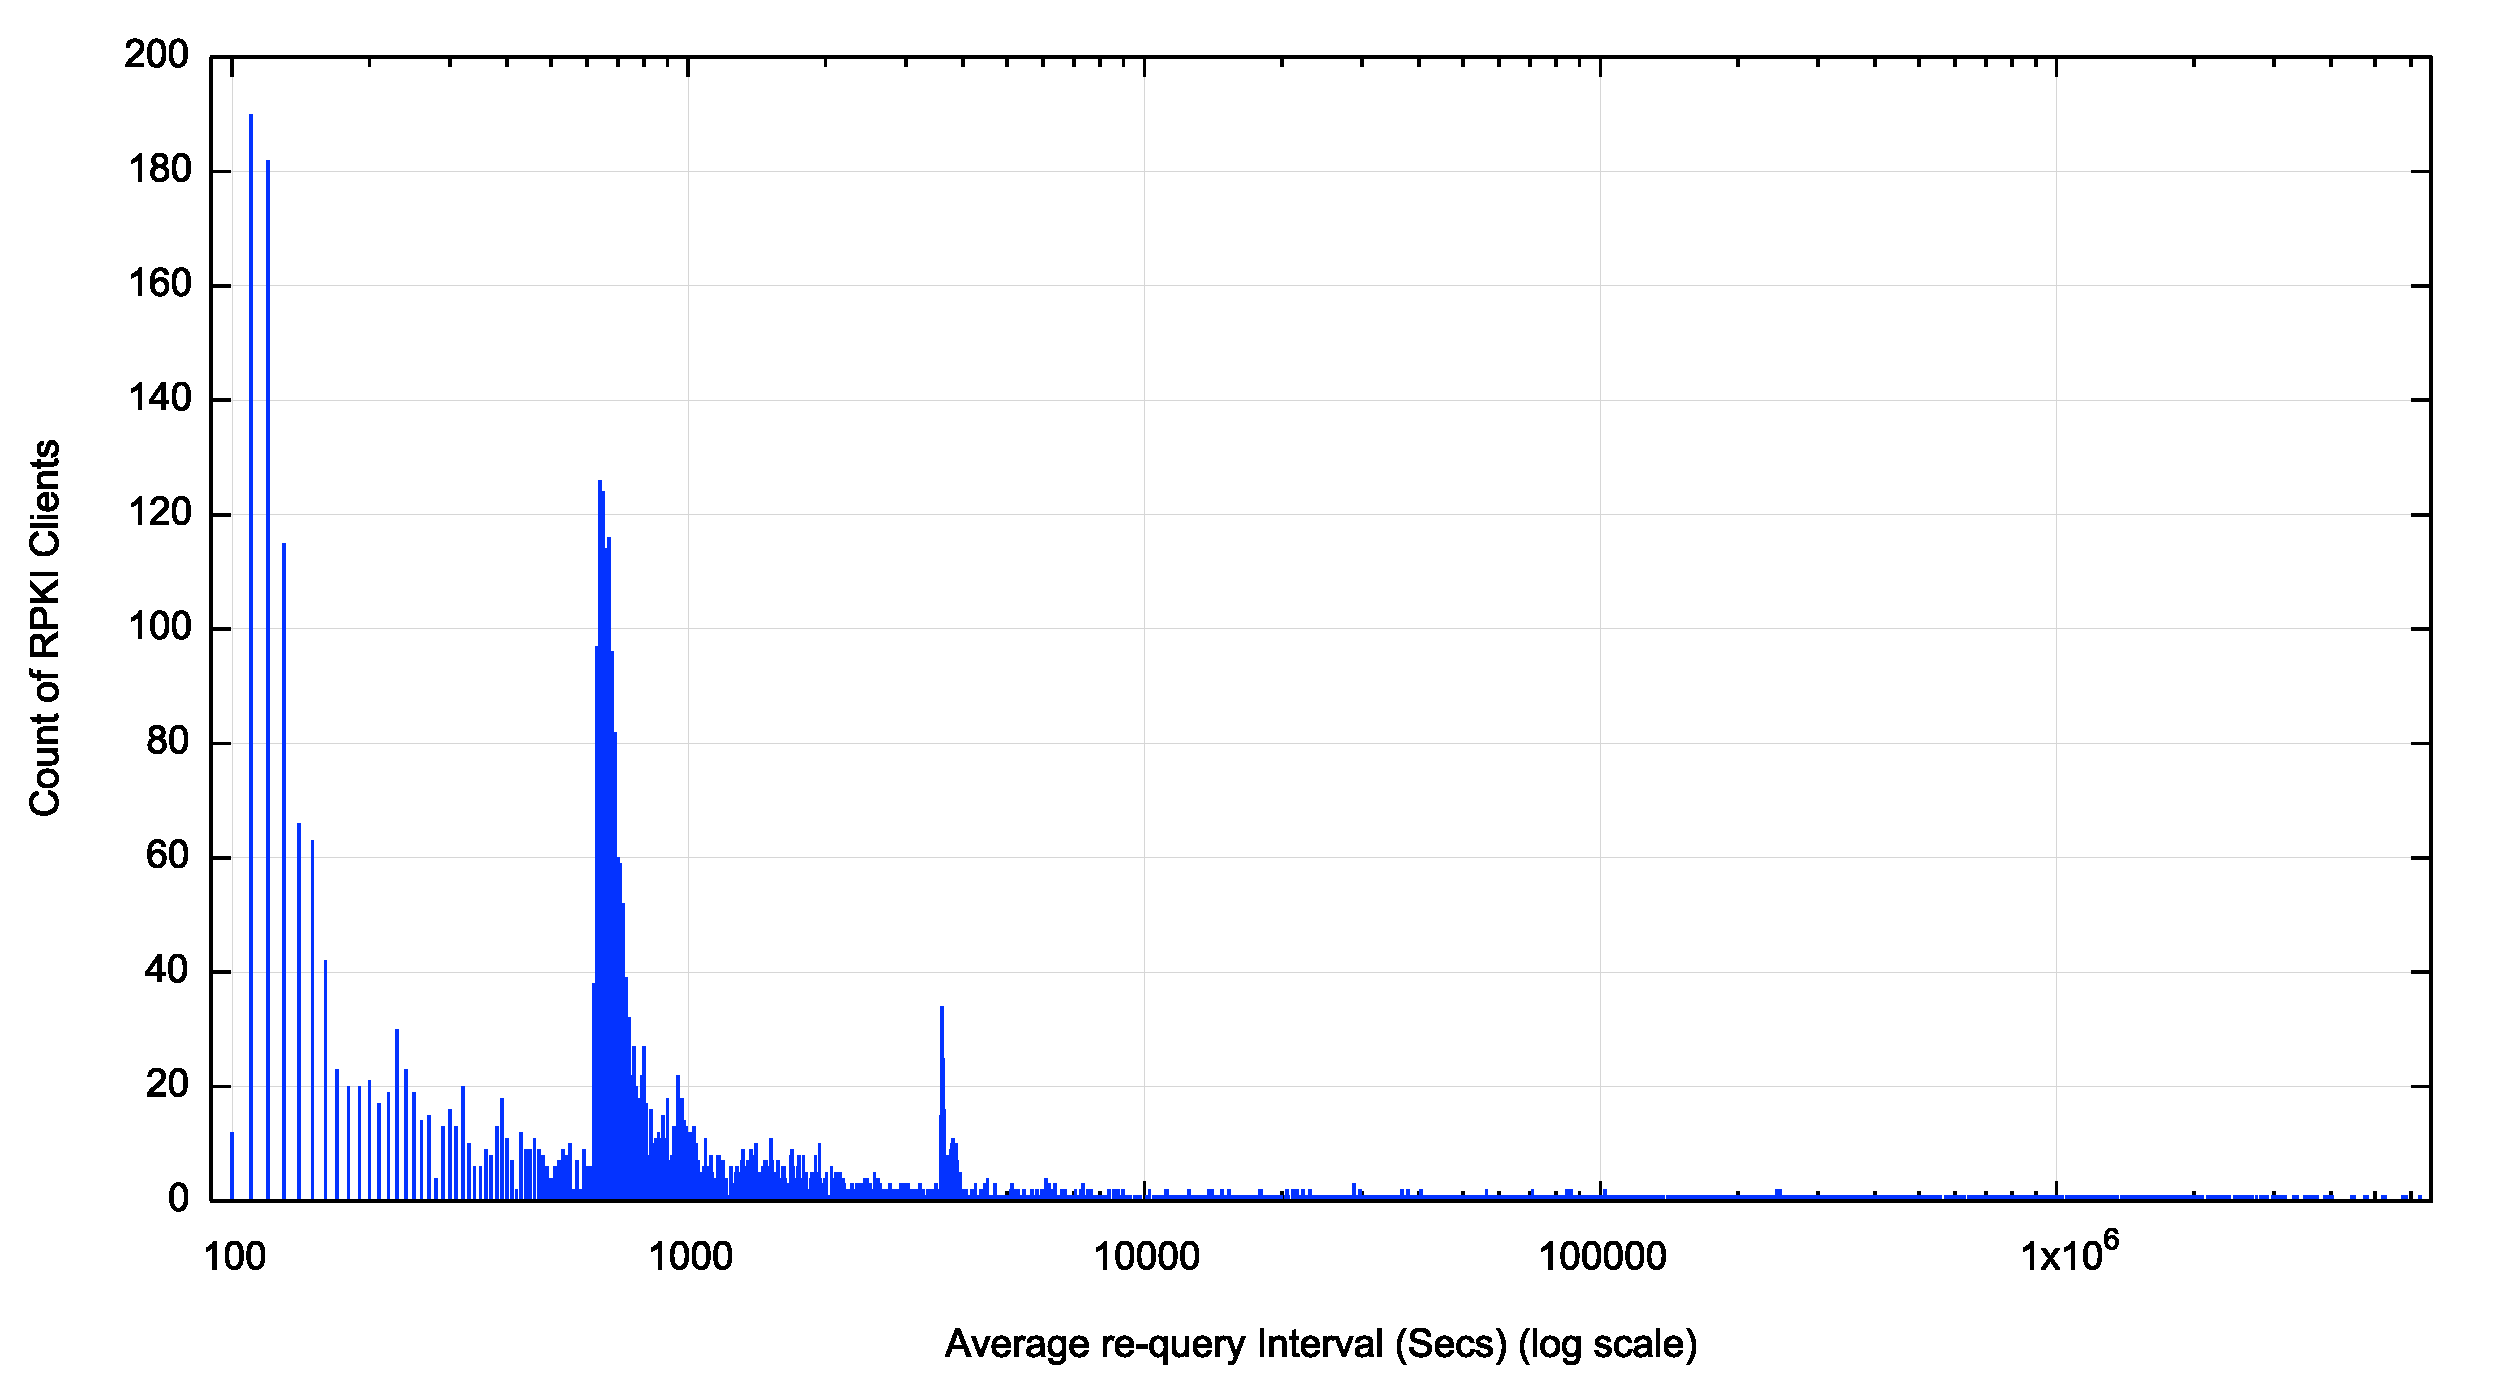
Figure 1 – Average re-query interval per client
There are three peaks in terms of re-query intervals (Figure 2).
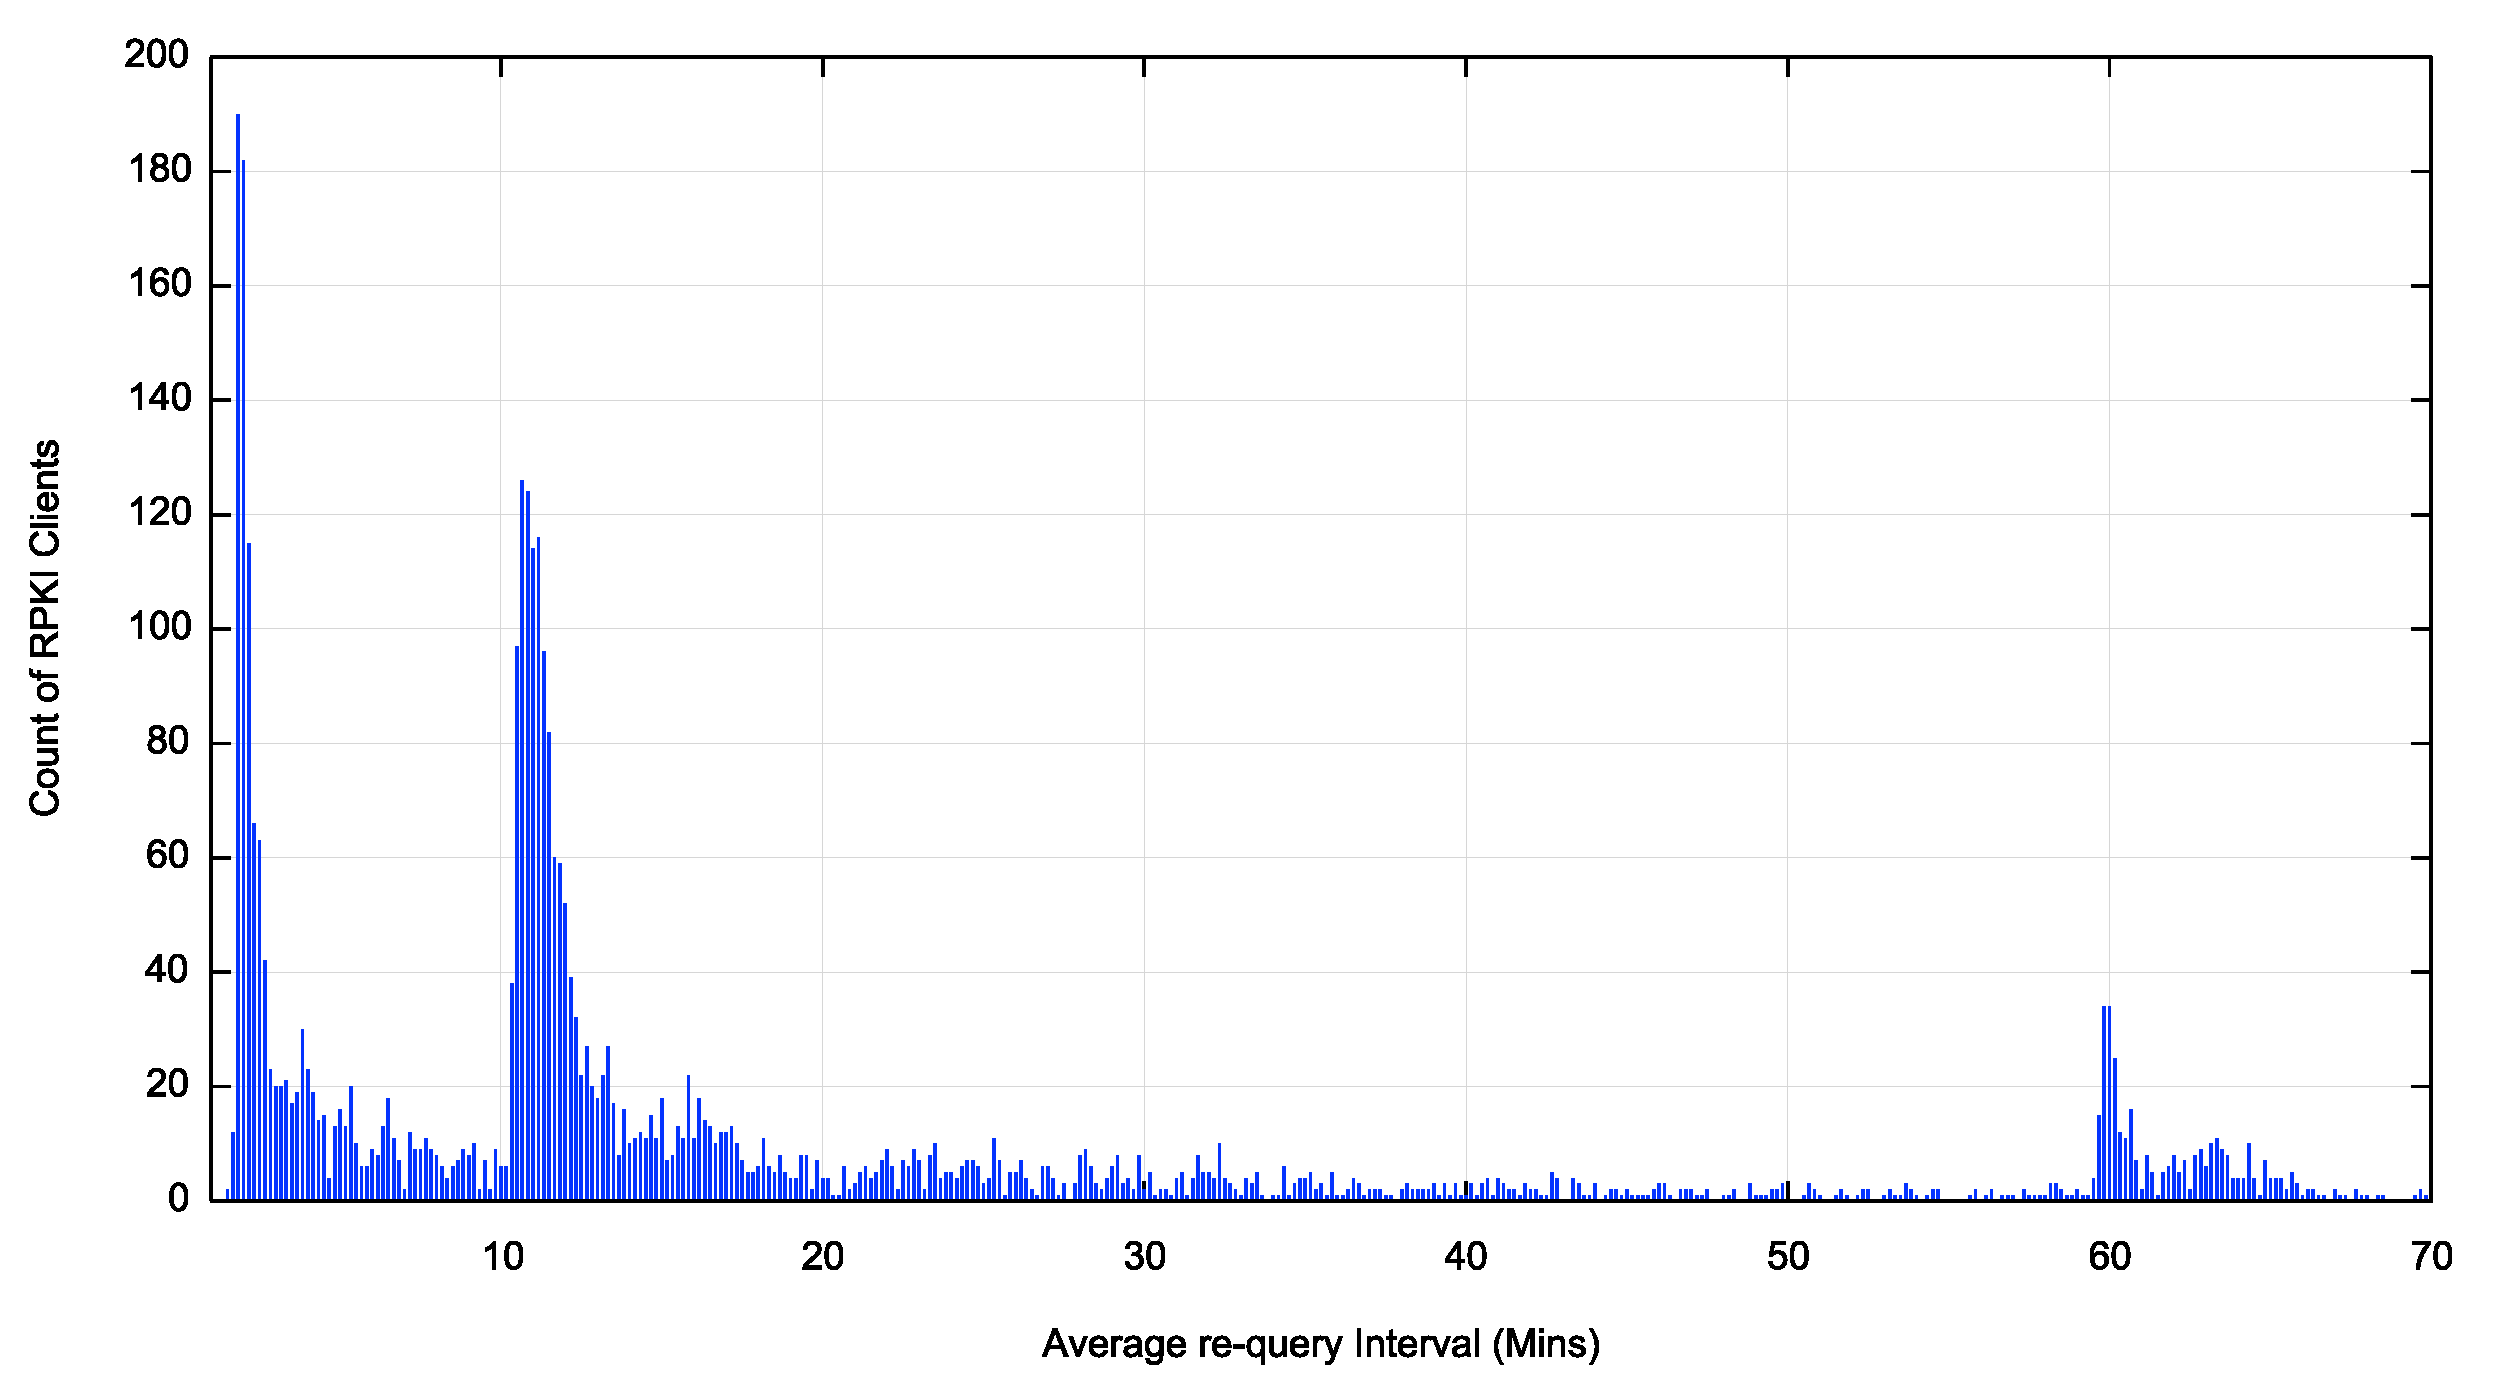
Figure 2 – Average re-query interval per client in the first 70 minutes
We can now identify these peaks as 2 minutes, 10 minutes and one hour re-query intervals. By taking a cumulative distribution we can determine the distribution of clients across re-query intervals. Some 10% of clients have an average re-query interval of 120 seconds or less. This rises to 25% of clients who use an average re-query interval of 630 seconds. Some 66% of clients use an average re-query interval of 60 minutes or less. Some 70% if clients have an average re-query interval of 70 minutes or less. There is no further clustering of re-query intervals for longer periods after 70 minutes.
The implication of these numbers is that if we use a phase change of ROA validity in terms of 12 hours or more, we are confident that at least 90% of all RPKI clients will pick up the state change.
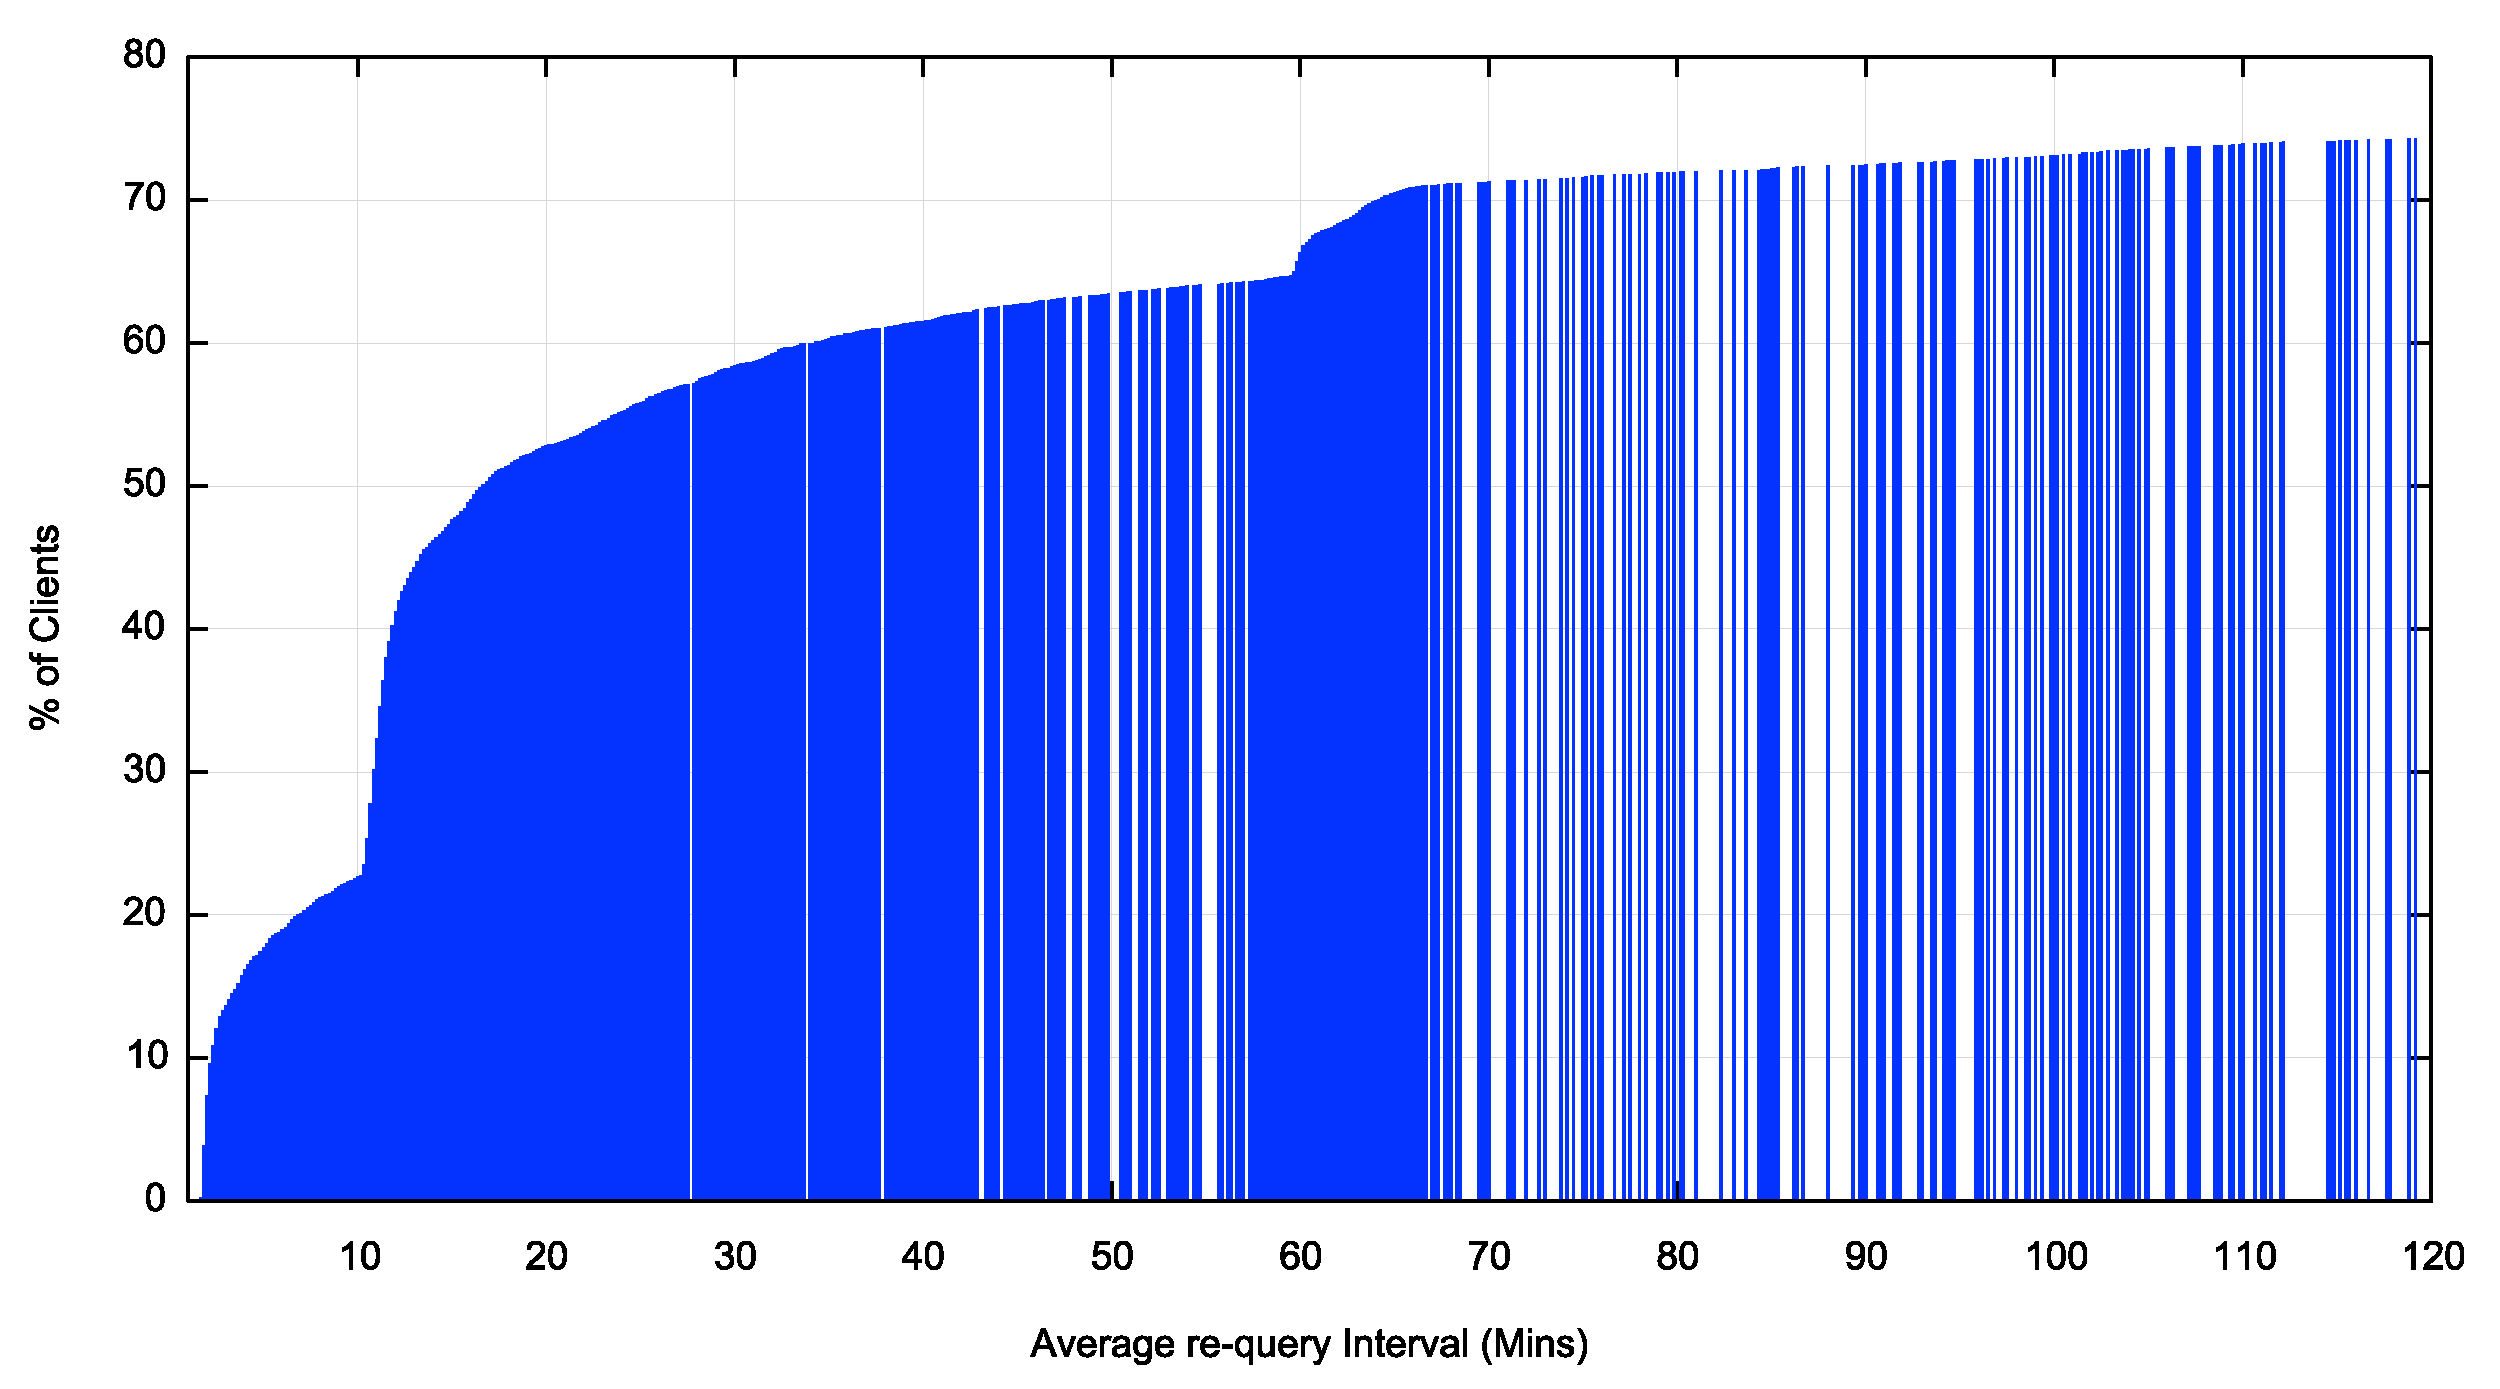
Figure 3 – Cumulative distribution of re-query intervals
There are two worrisome aspects to this re-query data.
The first is that there is no agreement between implementations as to the re-query interval and instead we see clustering around 2 minutes, 10 minutes and 60 minutes for a re-query of the entire distributed RPKI repository state. The interval for this re-query was never specified in the RPKI standard specifications, and, as we keep on seeing where the standard does not specify a behaviour implementors get creative!
Shorter intervals make for a more responsive system on the whole, so an operator could make a change in a ROA and anticipate that it would be picked up quickly. However shorter intervals pose a load on RPKI publishers. Right now, there are some 5,200 RPKI clients using distinct IP addresses. There are some 70,000 active AS networks in the Internet, and if each of these rand their own client, that would pose a load of some 50M query operations per day on each repository publication point. In absolute terms that may not be a crippling load, but it needs to be considered when setting up a publication point.
Longer intervals reduce the query load but make the entire system less response.
A user of the system can really only count on a change being applied across most of the RPKI-aware Internet in periods of slightly over one hour. The clients performing a 120 second re-query operation and even the 600 second re-query clients are in fact uselessly thrashing the system!
We should agree on a single time period and a random “fuzz” factor to make the system a little more predictable in terms of time to see changes apply.
The second aspect is the ‘lag’ in re-query intervals. It seems that it takes more than a second, on average to perform a sweep of the RPKI system today, even though there are very few distinct publication points. If we interpret the time between distinct query events as the idle time between the cessation of the previous sweep and the commencement of the next sweep, then it appears that 12% of clients take an average of up to 10 minutes to complete a single sweep if there are on a 2 minute sweep interval. A similar lag is visible on the 10 minutes re-query interval, where 25% of clients appear to be taking between 10 and 20 minutes to complete a sweep of the RPKI distributed repository.
Wikimedia has a report on the time to perform a sync operation for each RPKI publication point over time, and it’s clear that some publication points are very slow to process (Figure 4).
It’s unclear which way we are heading with RPKI. More smaller distributed publication points means faster processing per publication point, but more to process cumulatively. The alternative, a continuation of hosted publication points means fewer publication points but each of these becomes a potential chokepoint for a client.
It’s hard to say for sure but I suspect that a 2 minute re-query timer is too aggressive, and 60 minutes is too slow. If this scales up in levels of adoption even a 10 minute interval seems like thrashing within the system and a 20 minute re-query interval may represent a reasonable compromise.
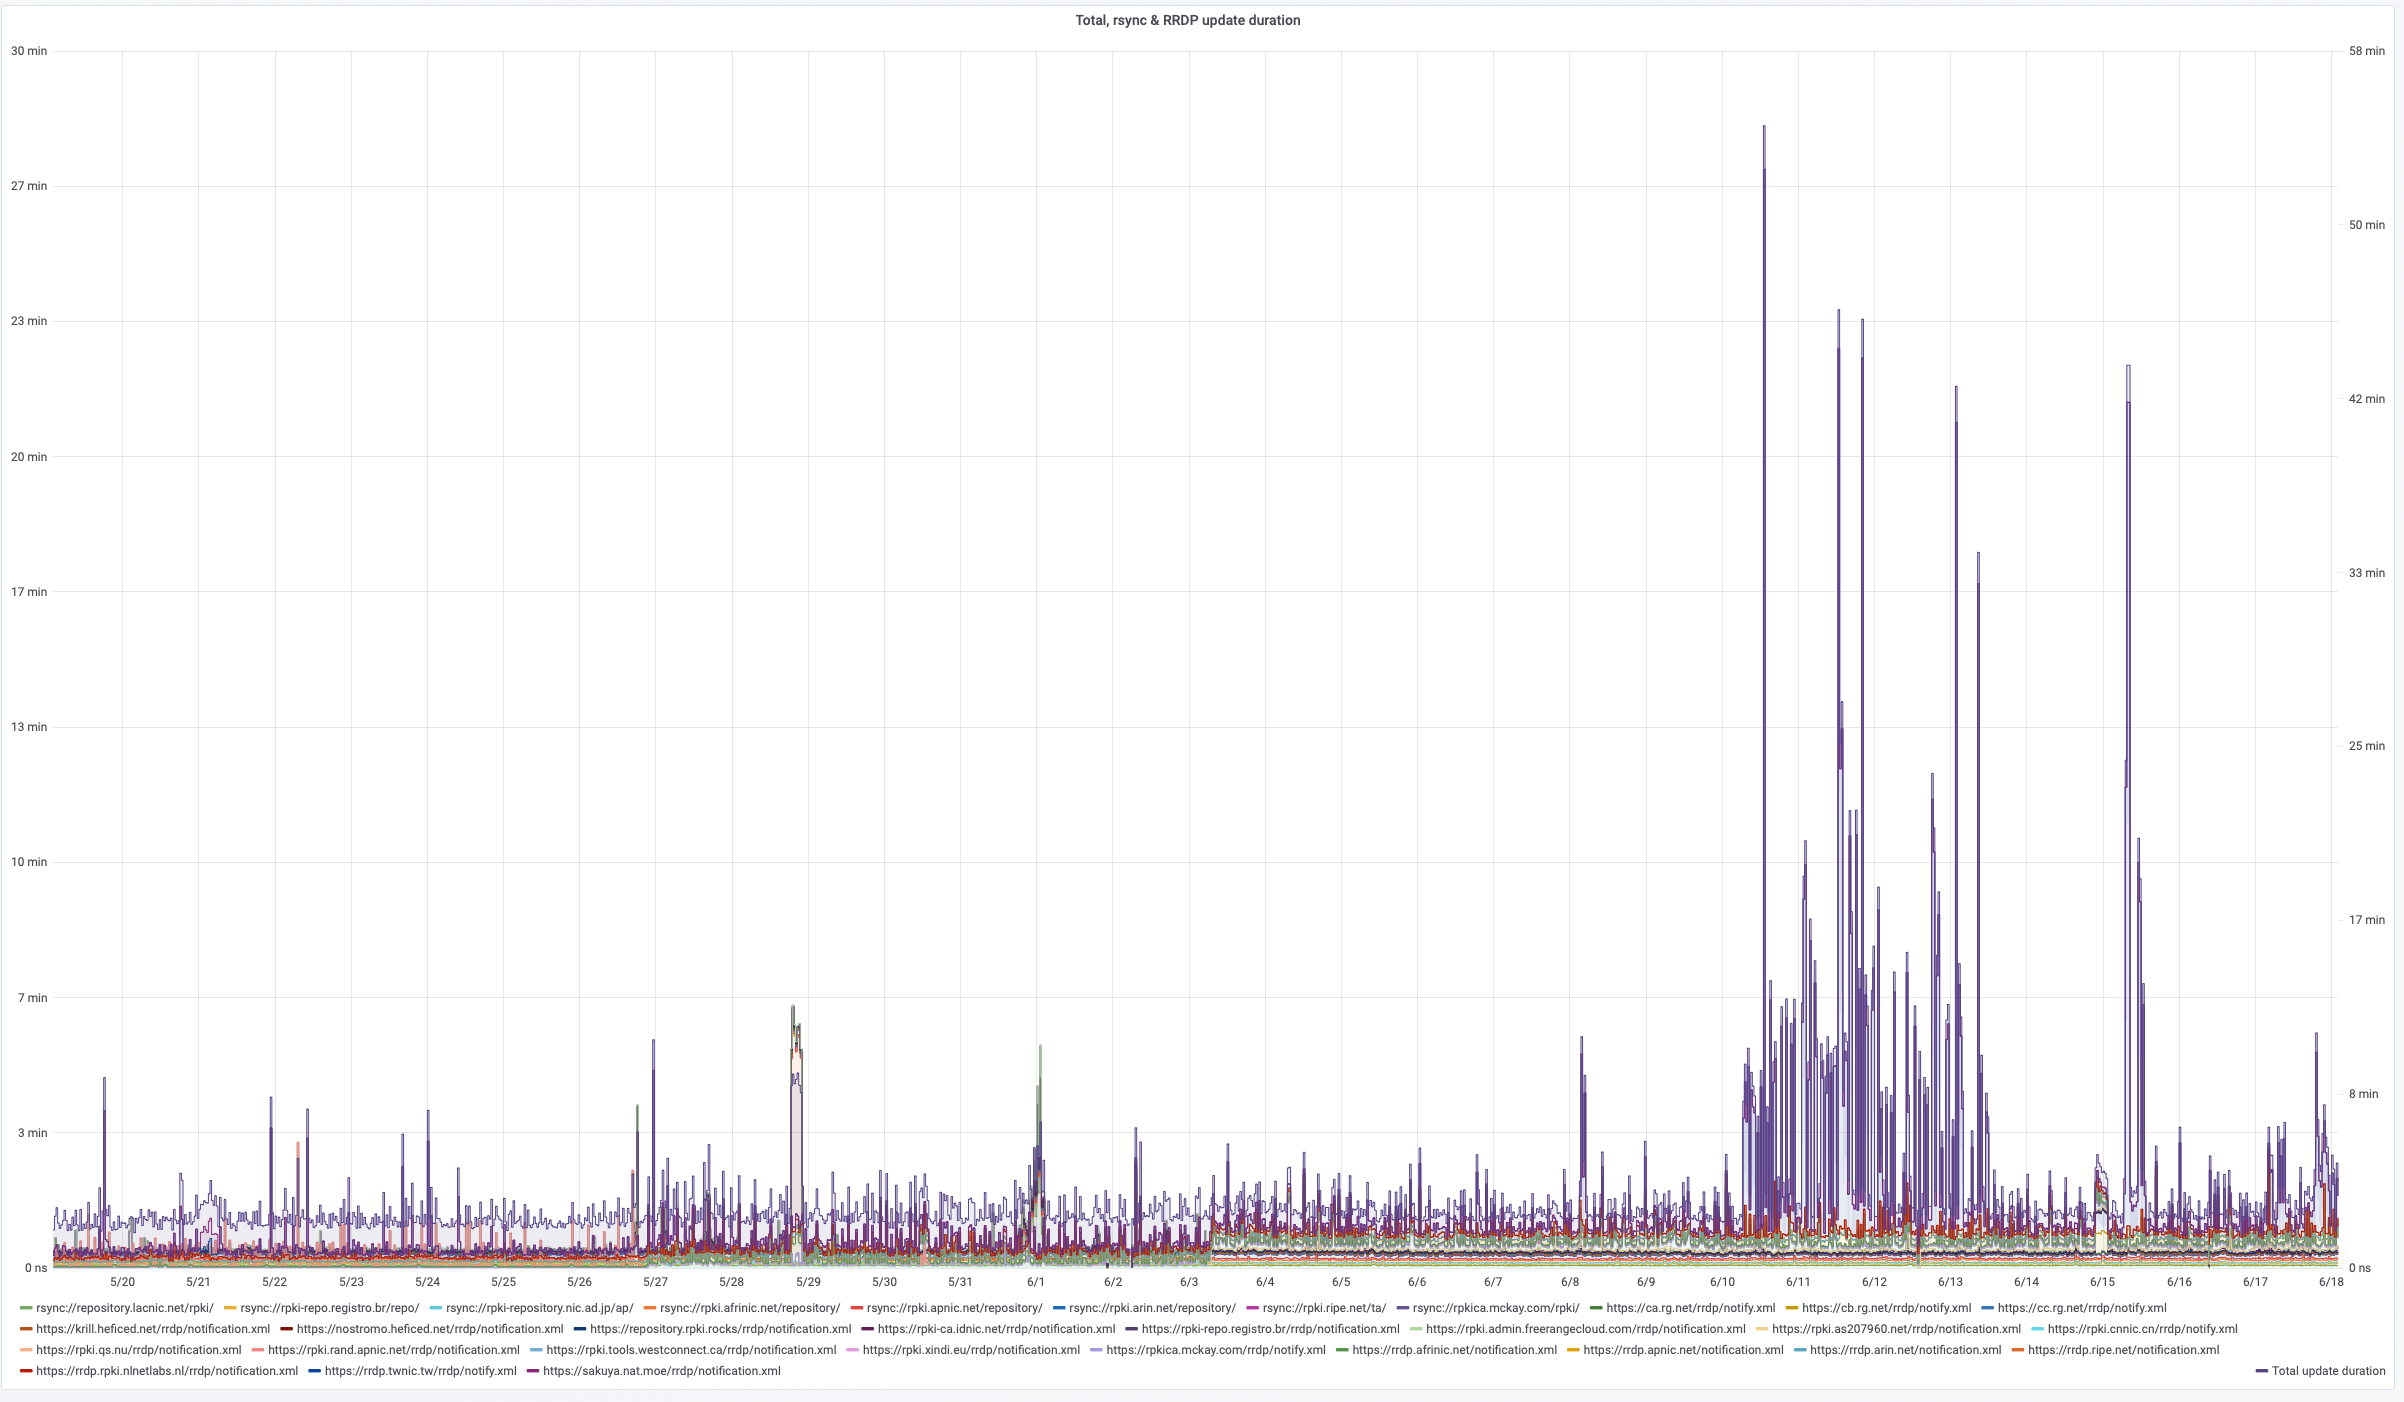
Figure 4 – RSYNC and RRDP scan duration per Publication Point https://grafana.wikimedia.org/d/UwUa77GZk/rpki?panelId=59&fullscreen&orgId=1&from=now-30d&to=now
For the purposes of this measurement exercise we use a mix of 12-hour and 36-hour intervals and flip a route advertisement between ROA validation states of valid and invalid in this period.
The weekly schedule of ROA validity state is shown in Figure 5.

Figure 5 – Weekly Schedule of Route ROV validity
The route has an invalid ROV status for half of each week, spread into two 36-hour intervals and one 12-hour interval.
We can confirm a change of routing state corresponding to this schedule of changing the ROV validity status of this route by looking at any of the BGP update monitors. If a network’s BGP speakers are performing ROV filtering, then when the ROA changes the route to refer to an incorrect Origin AS, then the ropute will then be marked as being invalid. If the network is performing filtering of routes where the route is invalid (as distinct from unknown) then this network will not only withdraw the route from its own network but withdraw any announcements of this route from its routing neighbours. Similarly, when the ROA changes the route validation state back to referring to the actual Origin AS (revoking the previous ROA) the Route Origin Validation state will switch to valid, and if the network had previously filtered the route it will then announce the route both internally and to its routing neighbours. These route changes and their propagation through the eBGP interdomain space should be visible to the route collectors. The route update profile for this prefix as seen by the RIPE ROA collectors is shown in Figure 6, and the routing activity peaks match the scheduled changes of ROA states shown in Figure 5. This BGP monitor data suggests that some networks are performing filtering of invalid routes.
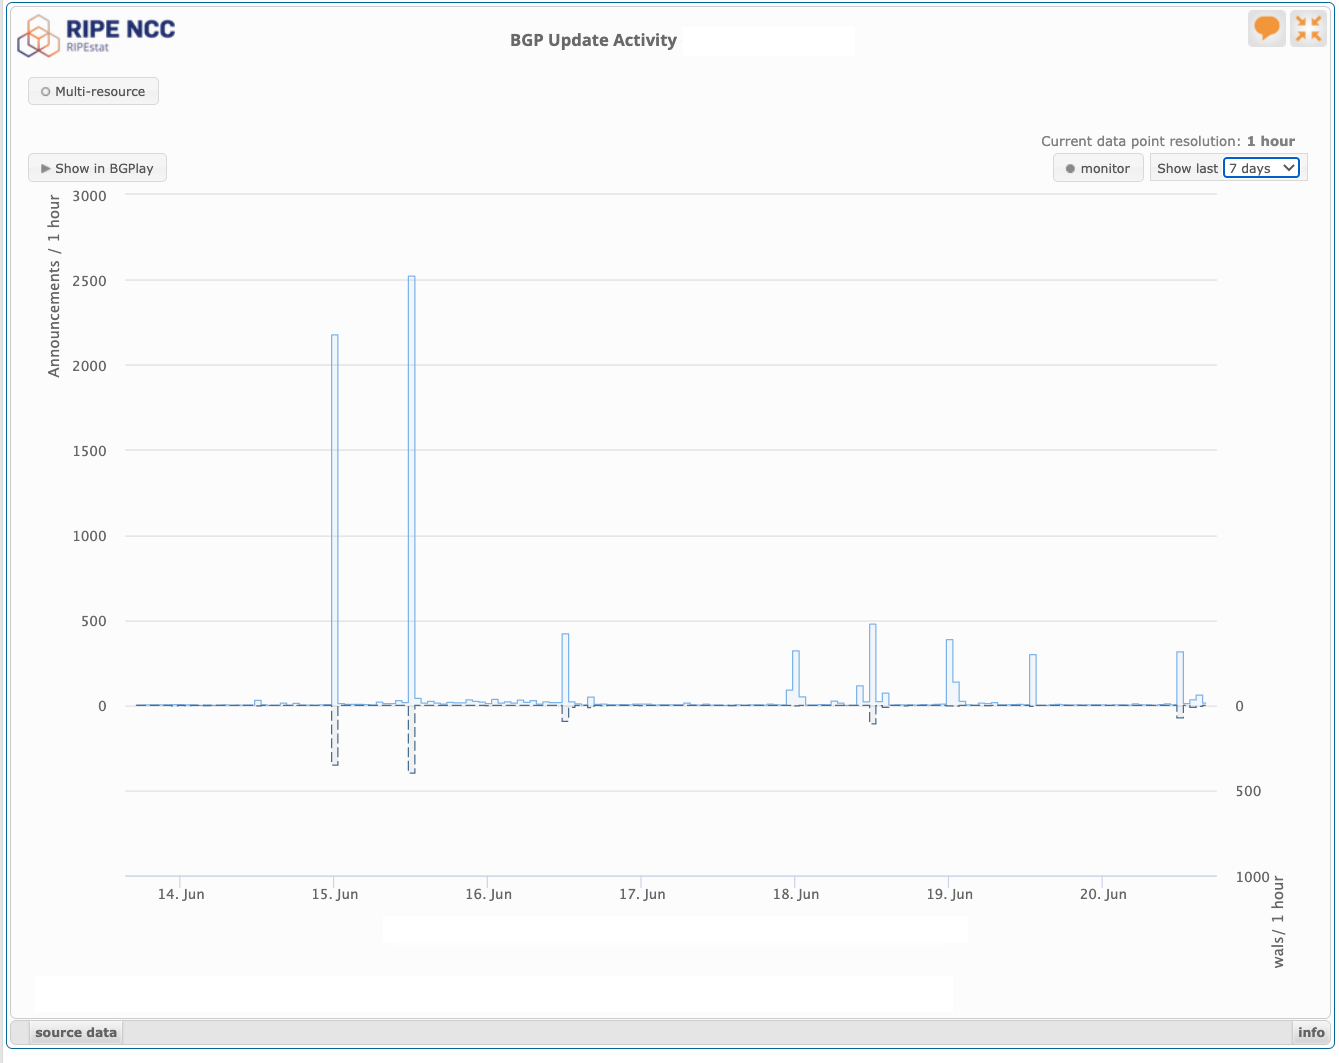
Figure 6 – BGP update activity for the test route as observed by RIPEstsat (https://stat.ripe.net)
We then use the measurement platform to have end user hosts retrieve a web blot from a server that lies behind this route. By measuring the extent to which reachability of the routed address changes between periods when the ROV state is valid and invalid we can measure the extent to which the Internet users are located behind routing systems that filter invalid routes.
It should be noted that being unable to reach a ROV-invalid does not necessarily mean that the local network is performing ROV and filtering invalid routes. It could be the network’s upstream transit provider that is performing this action, or any transit provider on the path between the network where the test user is located and the point of route injection. The results of this test are dependent on the location of the route injection. For example, if the test system sat directly behind a transit provider that performed filtering of invalid routes then it would appear as if the entire Internet was performing filtering of invalid routes! To mitigate this potential measurement bias we are currently using three diverse location to anycast the route origination. This diversity is not only geographic, but diverse in terms of the transit service providers used for the test.
This observation raises the interesting question of what level of deployment is sufficient to consider ROV validation and filtering to be deployed?
This is not a repeat of IPv6 where we are looking for every end host to transition to end stack.
In the IPv4 network there are some 59,000 stub ASes and some 10,000 transit ASes. Of these transit ASes there are some 10 or so that are major global connectors. If just these 10 networks perform ROV-invalid filtering of routes, then we’d see a major impact on end-user reachability. If a further few hundred networks that perform national or regional transit also filtered, then we’d see results that dramatically limit the propagation of invalid routes.
The picture is the same in IPv6, with 16,000 stub ASes and 4,000 transit ASes, and again a very small number of connectivity networks that provide the essential transit service.
The point is that for invalid filtering to be effective it’s not necessary for every network to perform invalid ROV filtering. Maximal impact is achieved when all of the small set of core transit networks perform this filtering. The deployment target for filtering is realistically just a few hundred networks.
The Internet-wide per-second profile of reachability of this prefix for an entire week is shown in Figure 7. The datapoints in green were collected during periods in the week when the route status was valid. Red denotes those periods when the route was invalid.
There is certainly some impact on reachability when the ROV state is invalid. In this experiment the average fetch rate in the time when the route is valid is an average of 95%, while the periods when the route is invalid the reachability levels drop to 80% to 83%. This infers that filtering invalid routes in the Internet currently is effective for some 10% of the total user population.
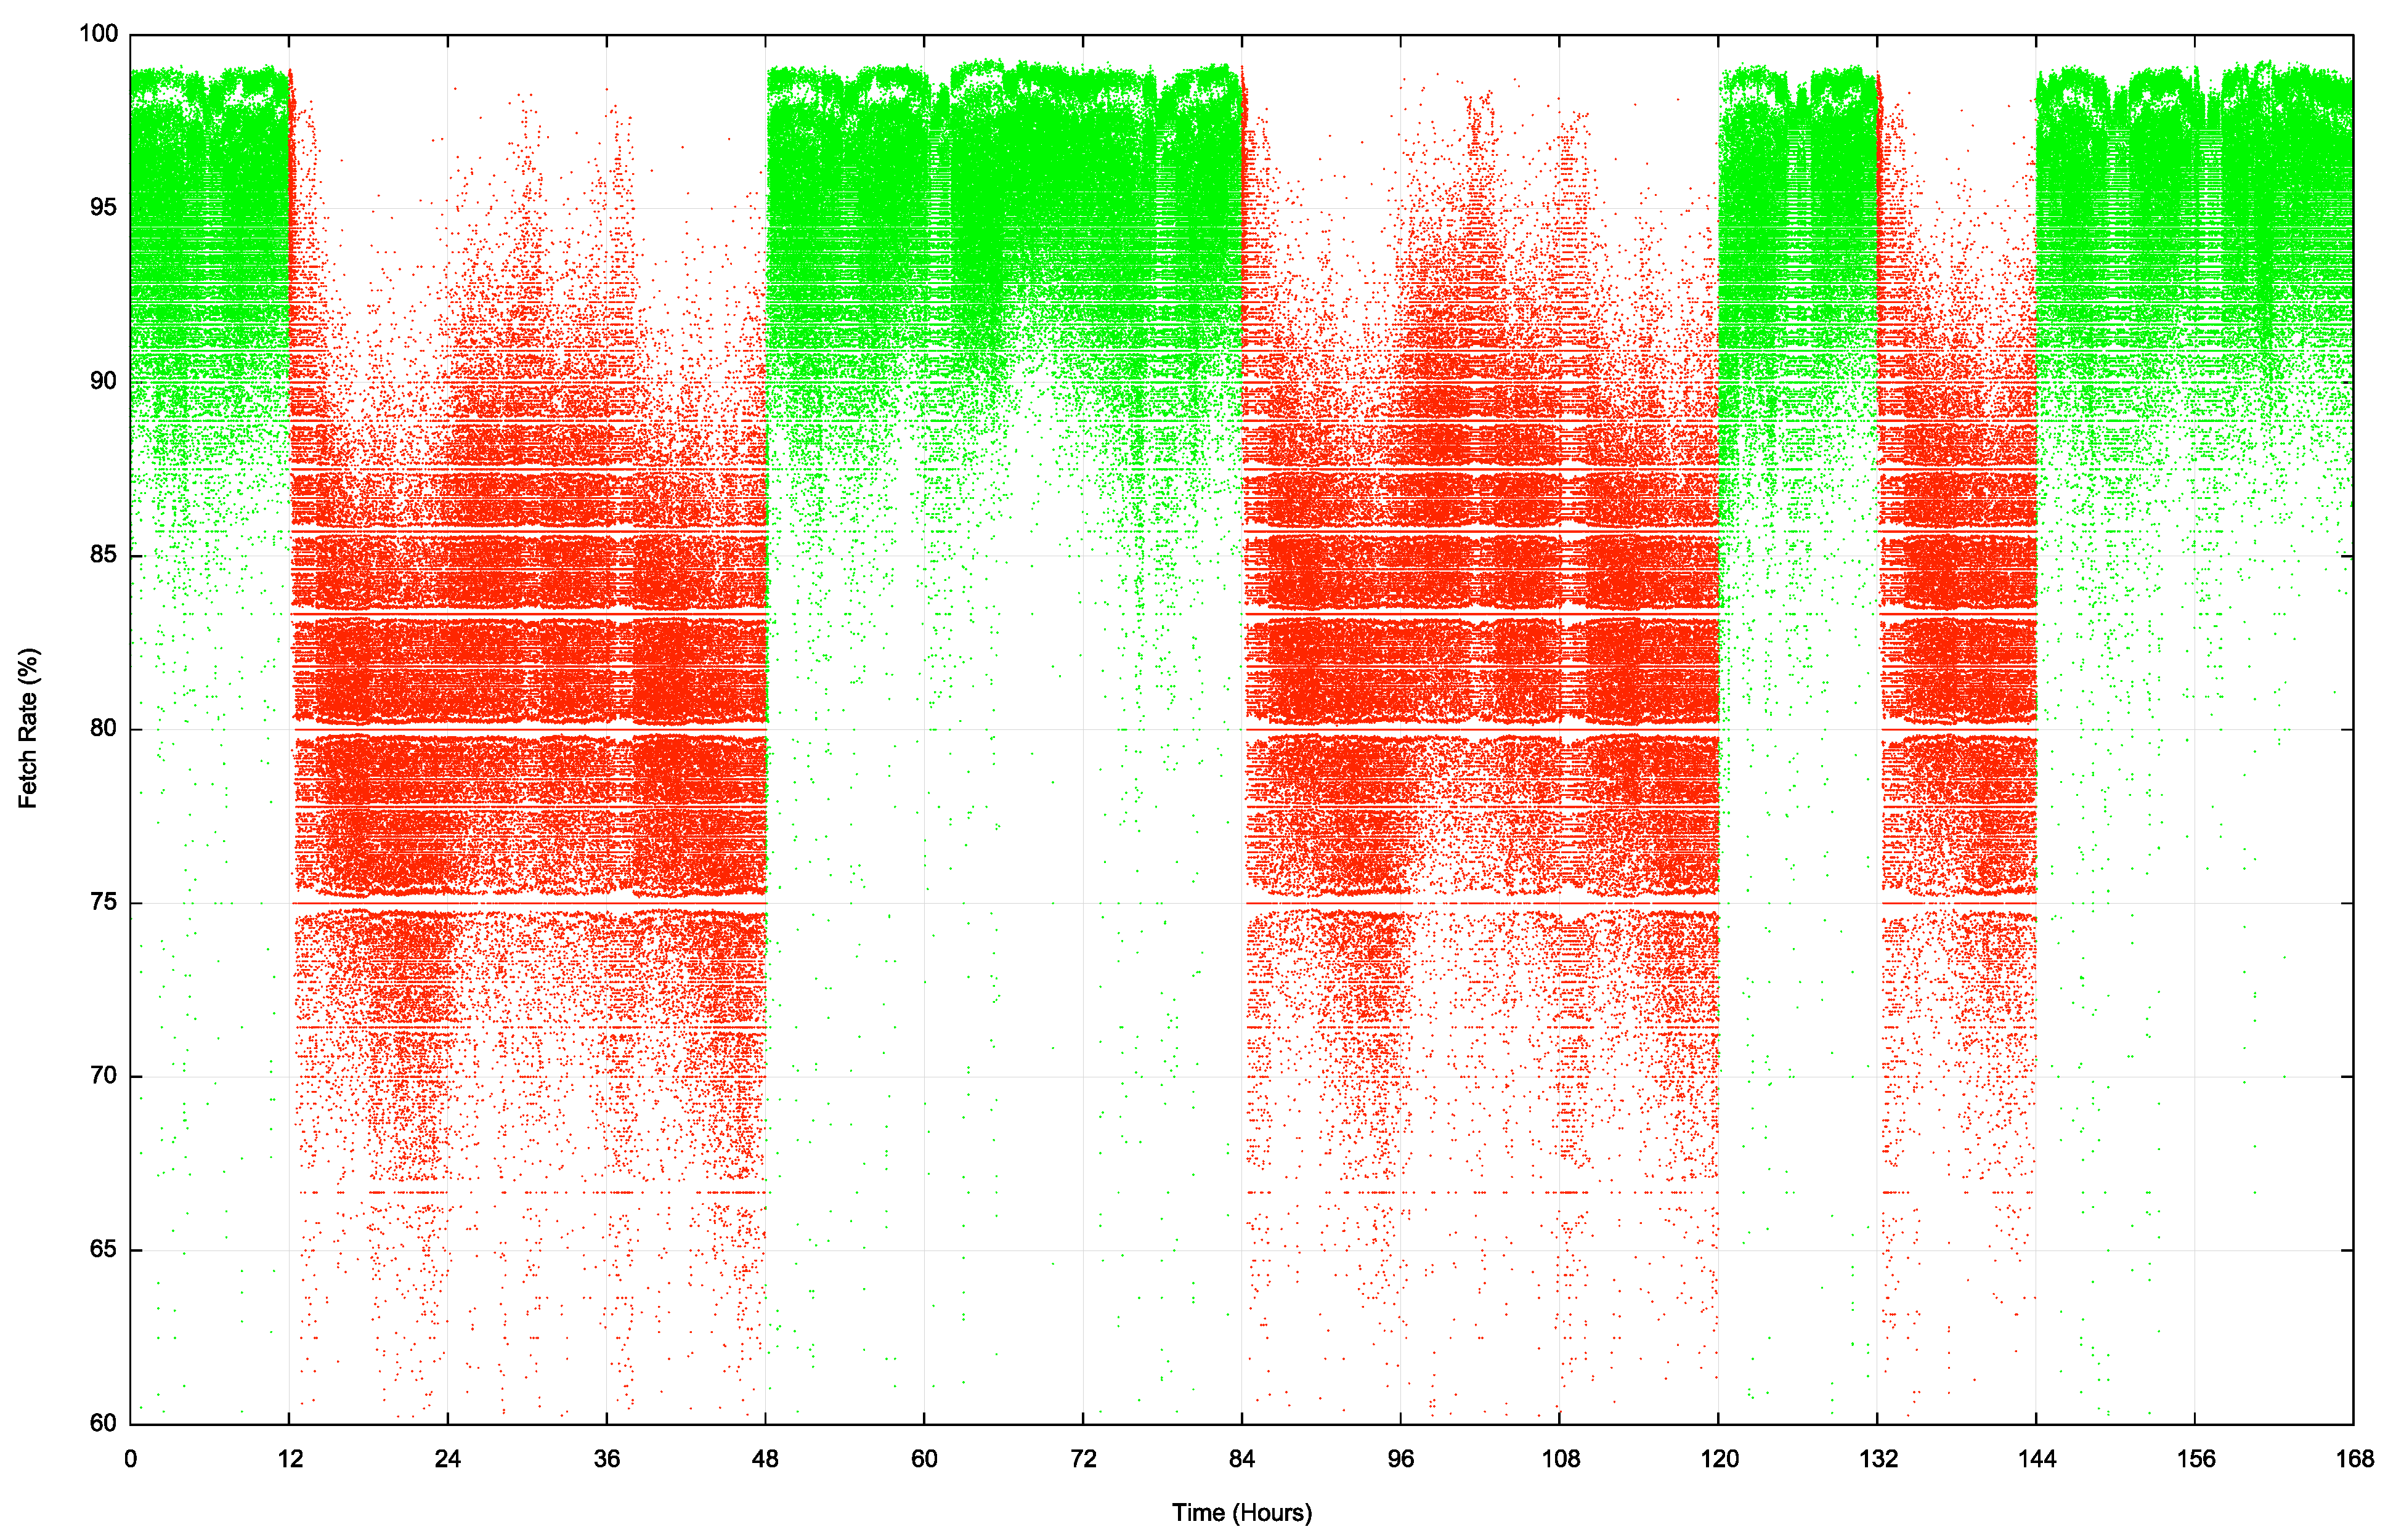
Figure 7 – Reachability of the ROV test address prefix
It is interesting to observe in this data that the fall in reachability levels when the route status changes from valid to invalid is far slower than the corresponding rise in reachability in the transition from invalid to valid.
Figure 8 shows the valid to invalid transition in greater detail. The major transition occurs 30 minutes after the change in ROA status.
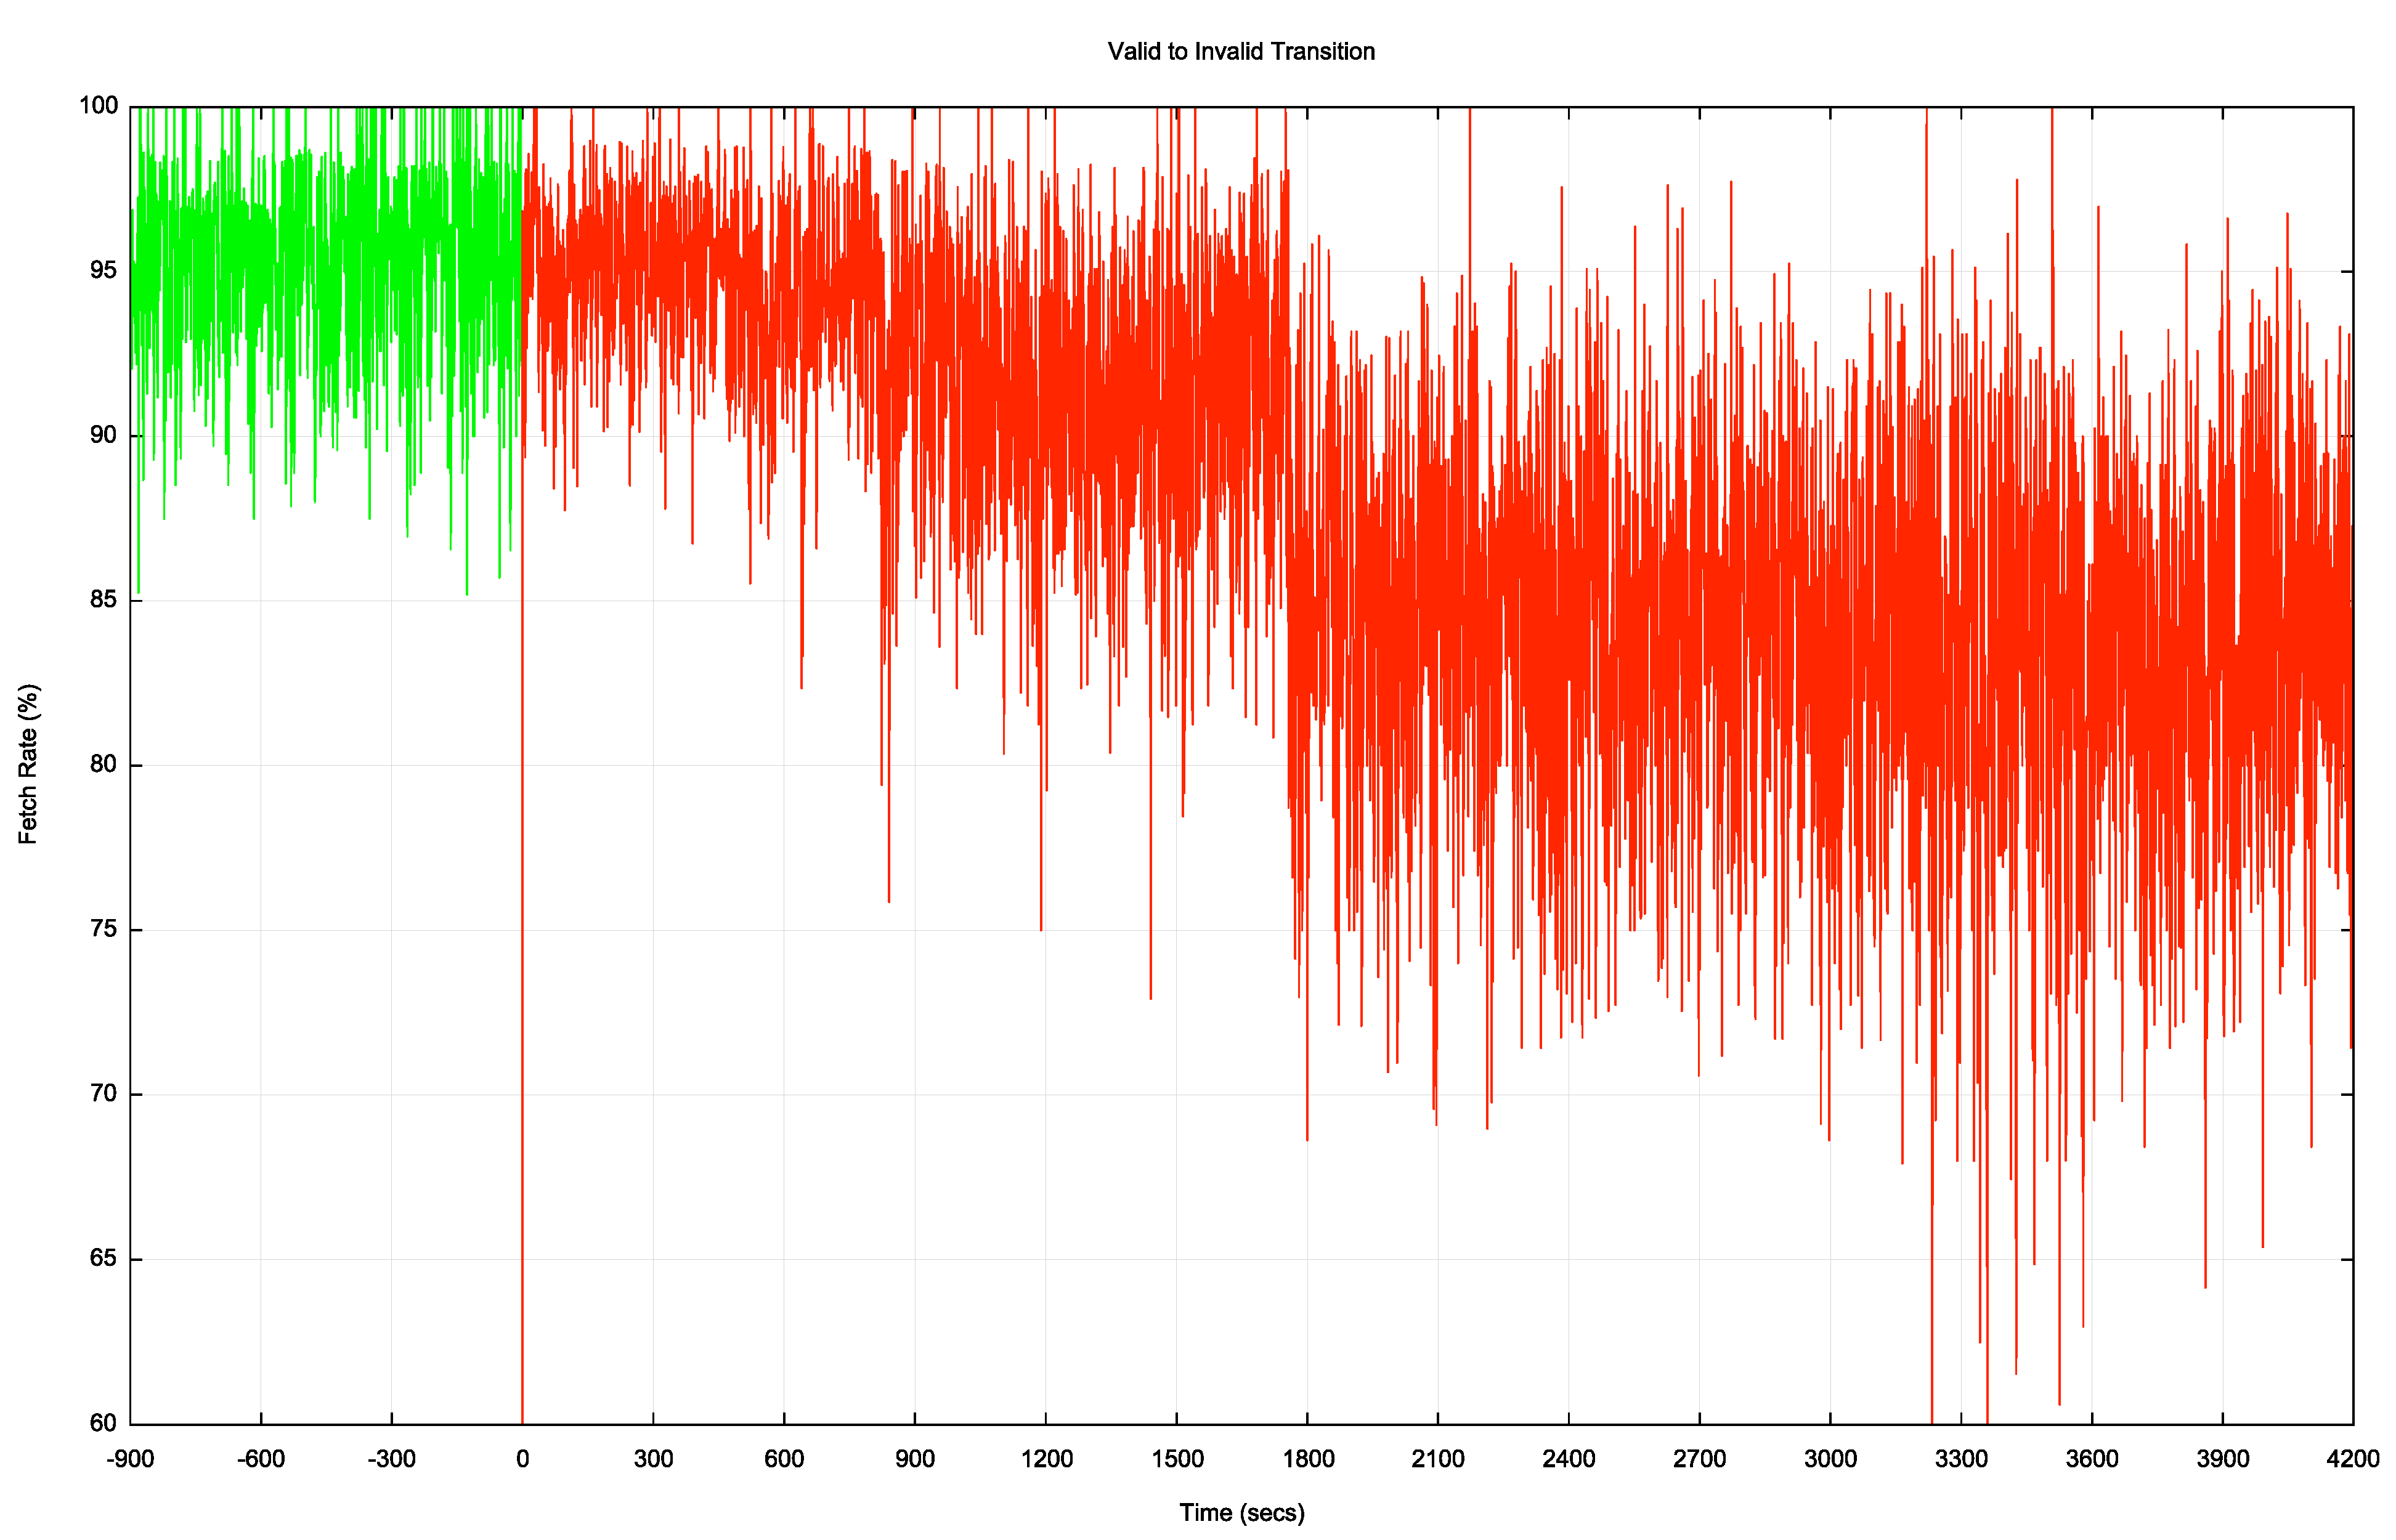
Figure 8 – Valid to Invalid Transition
The invalid to valid transition is a lot faster, as show in Figure 9.
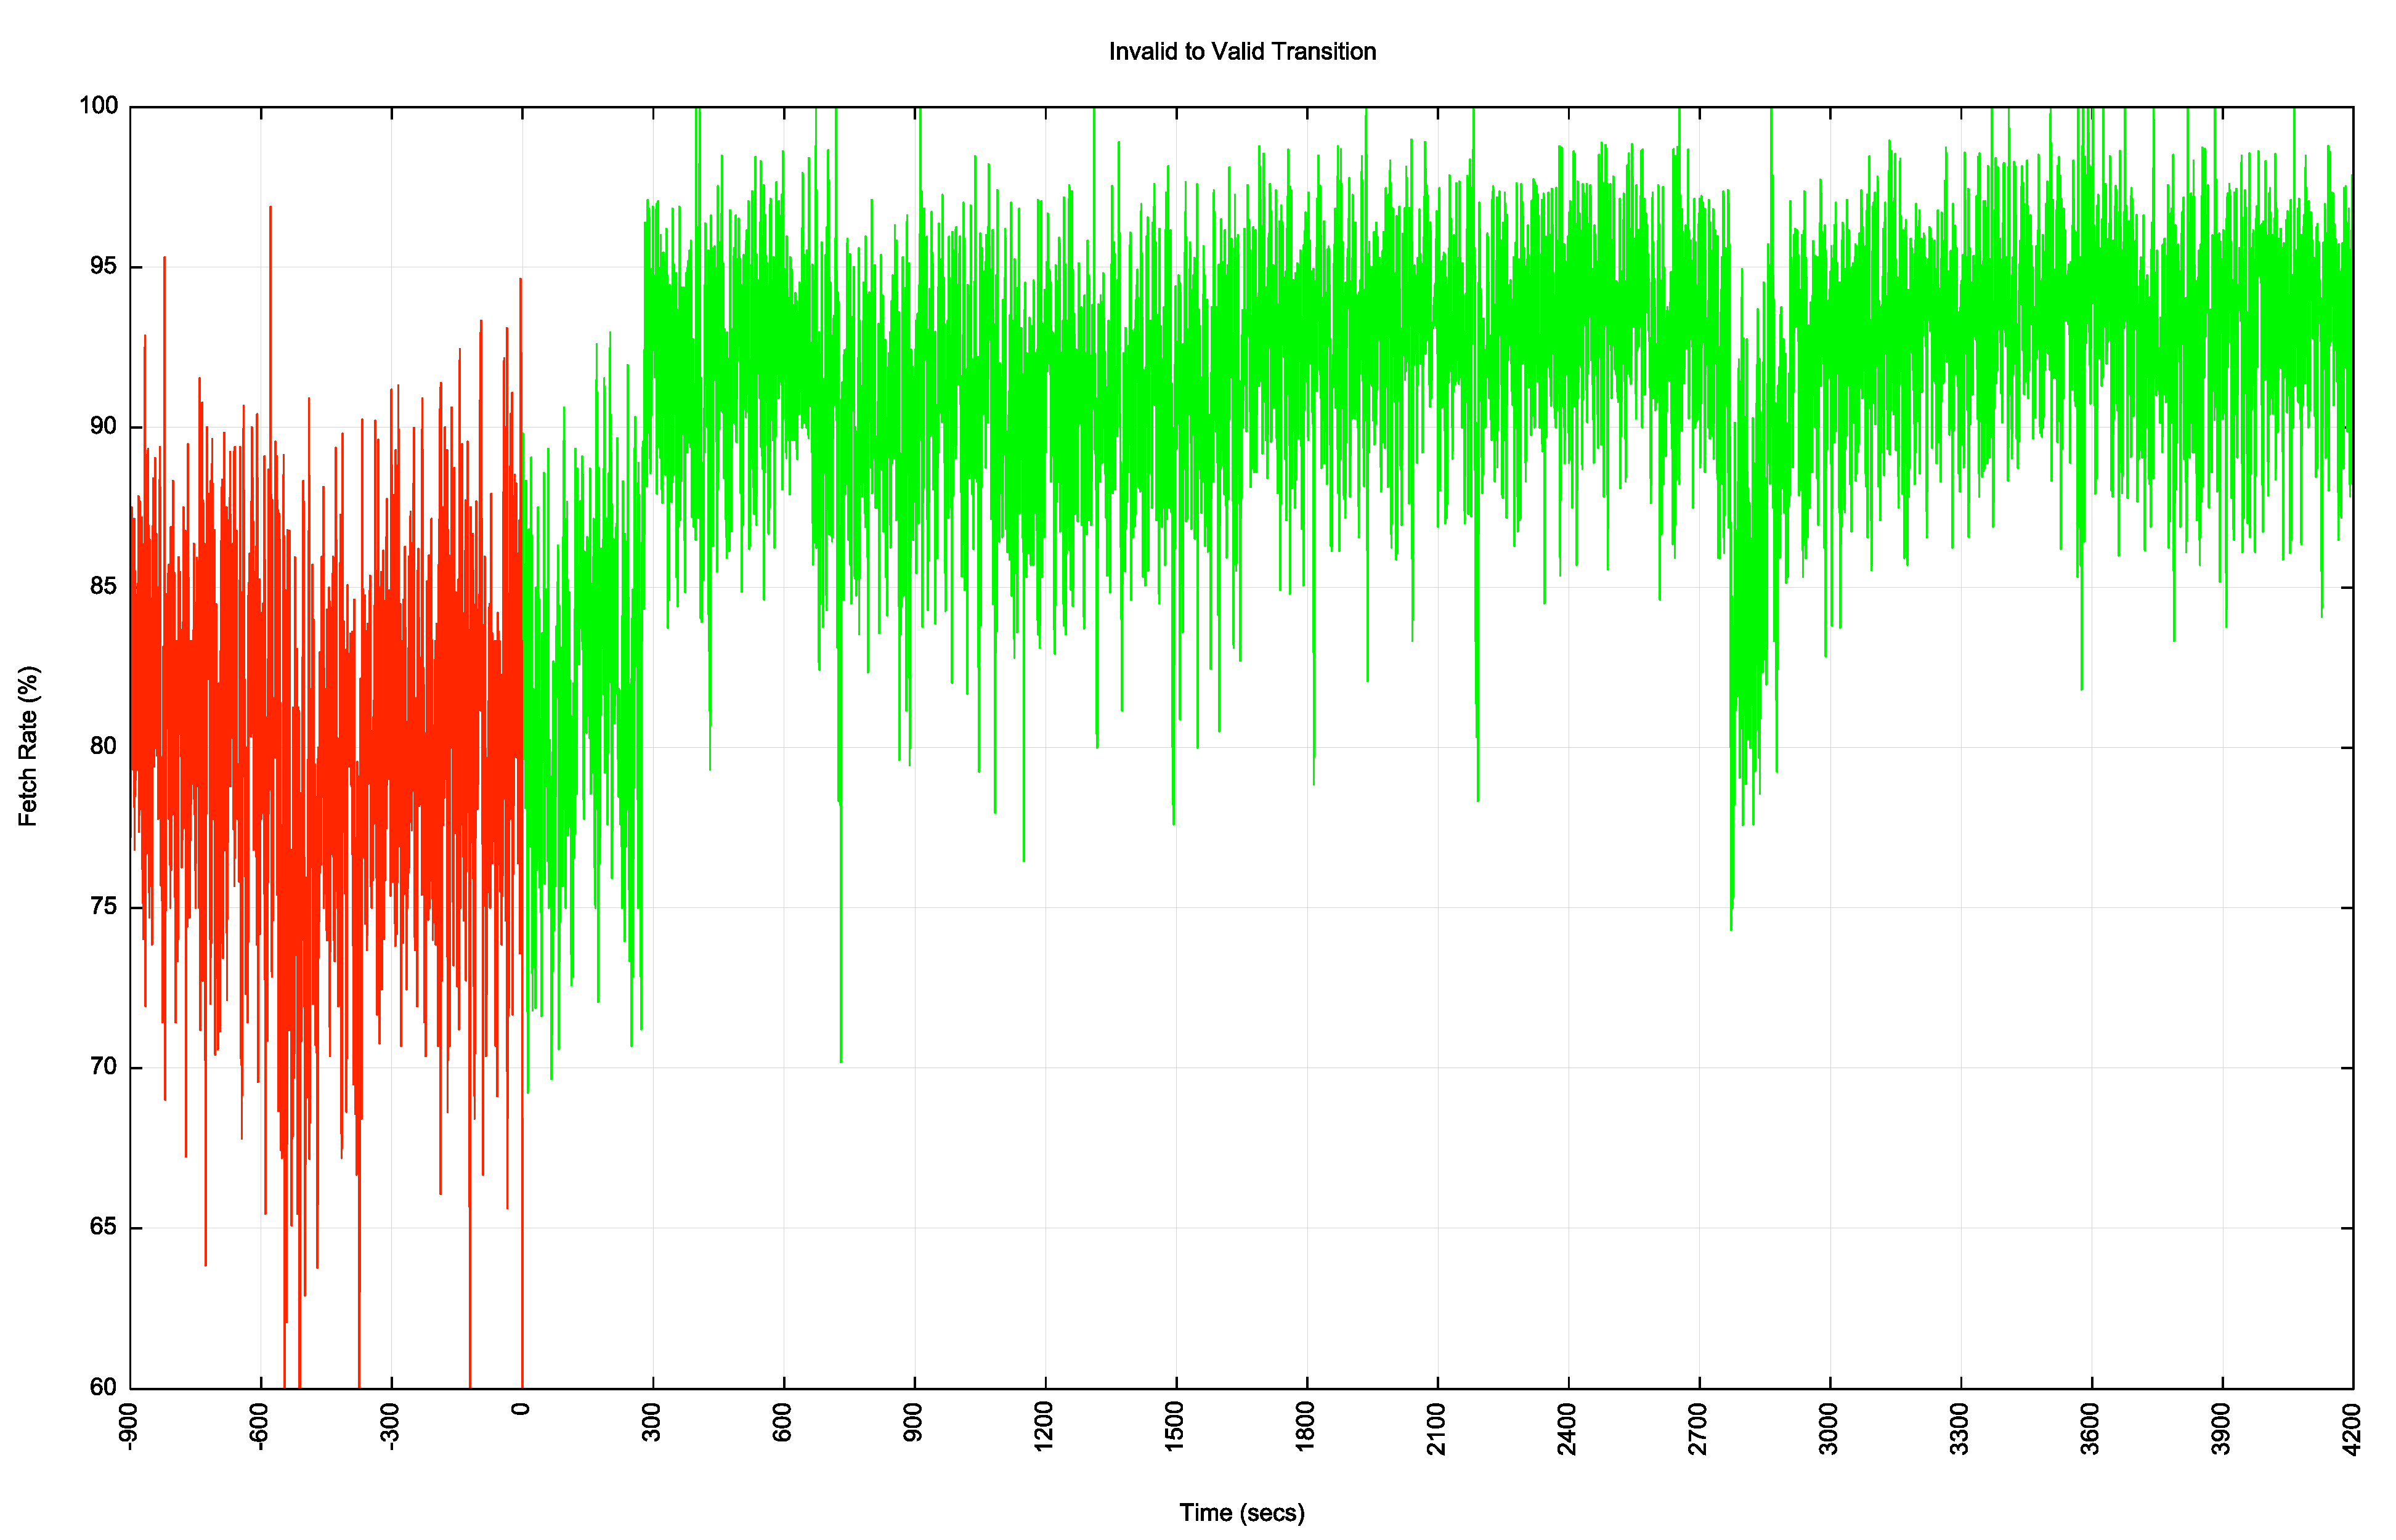
Figure 9 – Invalid to Valid Transition
Here the transition takes a little under 300 seconds to take effect.
Why are the transitions different? The test route is advertised into the routing system in three distinct locations. While some transit networks may react quickly, other transit networks may be using slower timers. They may be performing a scan of the RPKIU publication points every 10 minutes or even every hour, so it may be some time before the ROA state change is noticed. The in the case of the Valid to Invalid transition it is the time of the slowest transit paths to be withdrawn that determines the overall transition, as any initial withdrawals may simply cause the traffic to pick an alternate path. It is only when all alternates are withdrawn that the route becomes unusable. That means that the transition time is largely determined by the slowest networks to react, which from this data looks to be around 30 minutes. The opposite transition is largely governed by the fastest networks to react. As more paths become available the traffic may shift to other paths, but the transition time is determined by the fastest reaction times.
Measuring the User Impact of Invalid Route Filtering
The aim of this measurement is not to measure which networks are performing invalid route filtering, but to measure the user impact of this filtering. We are interested in answering questions the extent to which invalid route filtering is effective in preventing users to reach destinations announce through invalid routes and the trend over time of this measurement. The initial set of results for this measurement are shown in Figure 10.
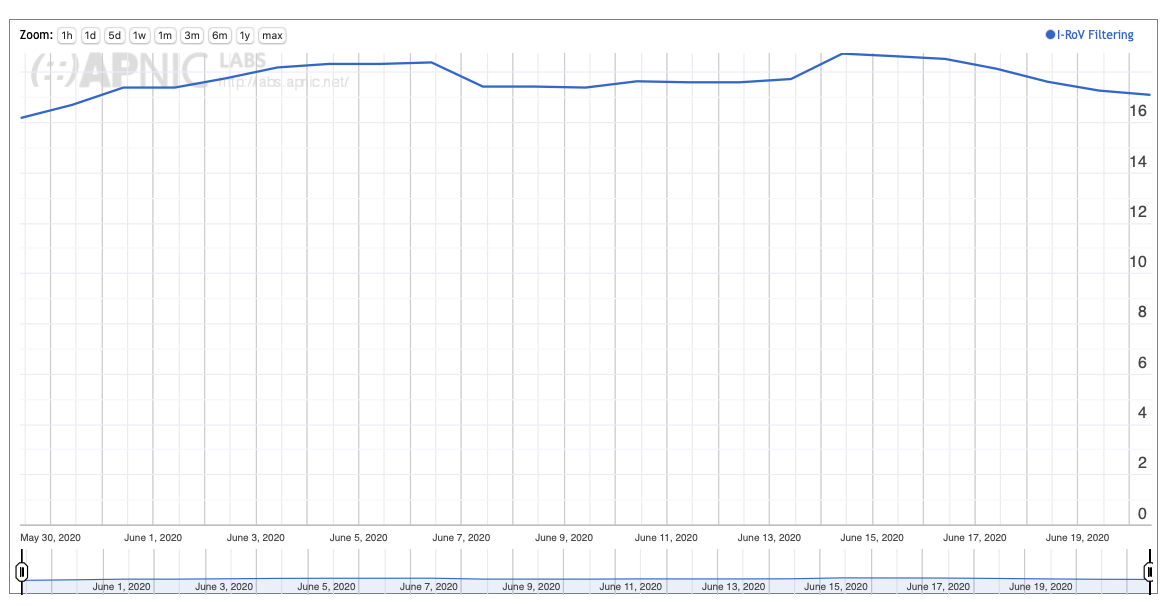
Figure 10 – User Measurement of RPKI filtering, June 2020 – https://stats.labs.apnic.net/rpki/XA
Through June 2020 RPKI filtering impacts some 17% of the Internet’s user population. As already noted it is clear that this is likely the result of uptake of filtering by a small set of transit providers rather than a larger deployment in the collection of stub networks.
We can break this down into a view per geographic region and further down into a per-economy view. The result, shown in Figure 11, is somewhat surprising, in that invalid route filtering is most prevalent for users in Africa. None of the RPKI beacon points are located in this region so it’s possible that this figure reflects the selection of transit providers in this part of the world. Where a transit service performs filtering the customer networks of this service see the route withdrawal and announcement in line with the ROA status schedule in Figure 5.
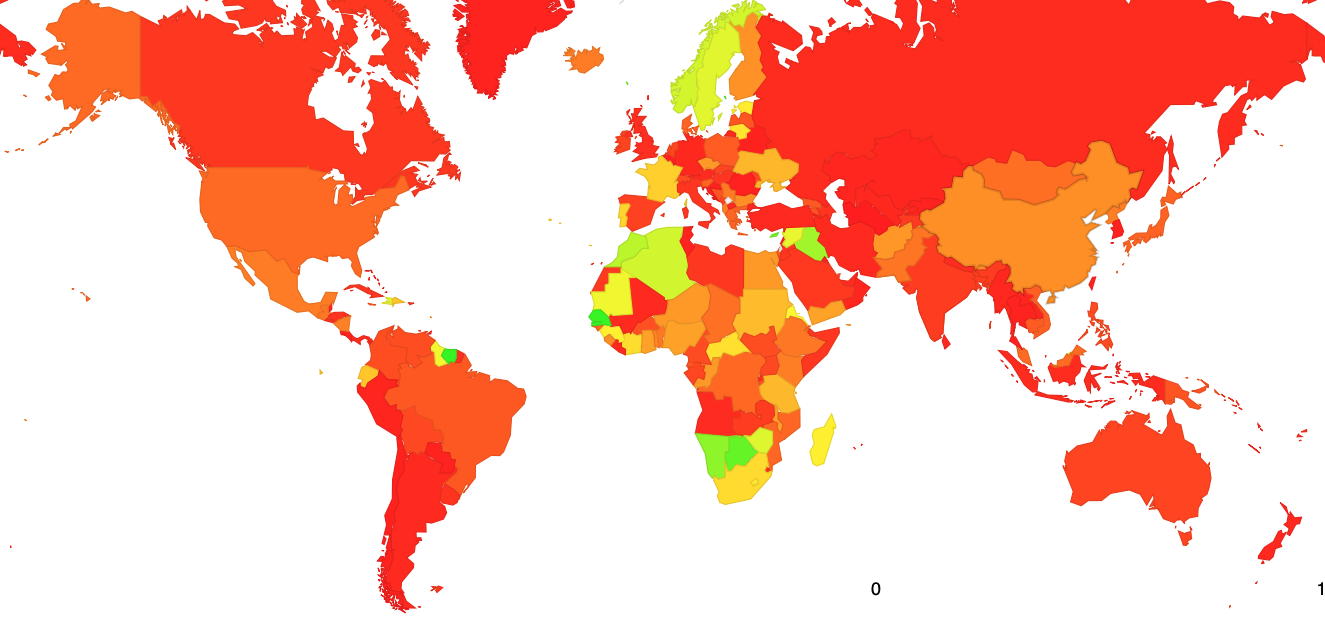
Figure 11 – Map of RPKI filtering, June 2020 – https://stats.labs.apnic.net/rpki
In the United States AT&T (AS7018) was an early adopter of invalid route filtering, and the measurement system also sees users of this network following the reachability dictated by the route validity status schedule (https://stats.labs.apnic.net/rpki/AS7018). It appears that NTT Communications (AS2914) also performs invalid route filtering, although the measurement through June 2020 shows some issues with this in the period June 7 through June 17 in the US (https://stats.labs.apnic.net/rpki/AS2914?ccc=US). There are a lot of moving parts in RPKI, ROA generation and publication and use of ROAs to perform validating and invalid route filtering, so perhaps its unsurprising to see periods where the total system is not operating as intended. In some countries we see some local providers perform filtering while others do not. Bhutan (https://stats.labs.apnic.net/rpki/BT) is a good case in point where TashiCell appears to perform invalid route filtering directly while DrukNet and Bhutan Telecom do not. In Northern Europe Telenor and Telia appear to perform invalid route filtering while Tele2 in Sweden. In France Proxad (AS12322) was an early adopter of IPv6 and it is also an adopter of invalid route filtering.
We will continue this daily process of gathering measurements and publishing global, regional and per-network measurements over the coming months and years to assemble a comprehensive picture of the growing adoption of invalid route filtering as seen from the user perspective. The URL for this data set is https://stats.labs.apnic.net/rpki.