At the start of each year, I have been reporting on the behaviour of the inter-domain routing system over the past 12 months, looking in some detail at some metrics from the routing system that can show the essential shape and behaviour of the underlying interconnection fabric of the Internet.
One reason why we are interested in the behaviour of the routing system is that at its heart the routing system has no natural self-constraint. Our collective unease about routing relates to a potential scenario where every network decides to disaggregate their prefixes and announce only the most specific prefixes, or where every network applies routing configurations that are inherently unstable, and the routing system rapidly reverts into oscillating states that generate an overwhelming stream of routing updates into the inter-domain routing space. In such scenarios, the routing protocol we use, the Border Gateway Protocol, or BGP, will not help us by attempting to damp down such behaviour. Indeed, there is a very real prospect that in such scenarios the protocol behaviour of BGP could well amplify the situation!
BGP is an instance of a Bellman-Ford distance vector routing algorithm. This algorithm allows a collection of connected devices (BGP speakers) to each learn the relative topology of the connecting network. The basic approach of this algorithm is very simple: each BGP speaker tells all its other neighbours about what it has learned if the new learned information alters the local view of the network. This is a lot like a social rumour network, where every individual who hears a new rumour immediately informs all their friends. BGP works in a very similar fashion: each time a neighbour informs a BGP speaker about reachability to an IP address prefix, the BGP speaker compares this new reachability information against its stored knowledge that was gained from previous announcements from other neighbours. If this new information provides a better path to the prefix then the local speaker moves this prefix and associated next-hop forwarding decision to the local forwarding table and informs all its immediate neighbours of a new path to a prefix, implicitly citing itself as the next hop. In addition, there is a withdrawal mechanism, where a BGP speaker determines that it no longer has a viable path to a given prefix, in which case it announces a “withdrawal” to all its neighbours. When a BGP speaker receives a withdrawal, it stores the withdrawal against this neighbour. If the withdrawn neighbour happened to be the currently preferred next hop for this prefix, then the BGP speaker will examine its per-neighbour data sets to determine which stored announcement represents the best path from those that are still extant. If it can find such an alternative path, it will copy this into its local forwarding table and announce this new preferred path to all its BGP neighbours. If there is no such alternative path, it will announce a withdrawal to its neighbors, indicating that it no longer can reach this prefix.
And that’s the one paragraph summary of BGP.
What could possibly go wrong?
The first metric of interest is the size of the routing tables. Each router needs to store a local database of all prefixes announced by each routing peer. In addition, conventional routing design places a complete set of “best” paths into each line card and performs a lookup into this forwarding data structure for each packet. This represents an extremely challenging silicon design problem. The larger the routing search space, the more challenging the problem!
Why does size matter for a router?
If you look at the internals of a high-speed Internet router operating the default-free zone of the Internet one of the more critical performance aspects of the unit is to make a forwarding decision for each packet within the mean inter-packet arrival time, and preferably within the inter-arrival time of minimum-sized IP packets.
A router line card with an aggregate line rate across all of its serial interfaces of some 10Tbps (which is probably not a large capacity by today’s standards) needs to process each packet within 70 nanoseconds, assuming that the average packet size is 900 octets). If the average memory access cycle time is 10ns then this implies that the router line card processor needs to scan the entire decision space within just 7 memory access operations just to keep pace with the anticipated peak packet rate. A densely packed binary tree with 1M entries will require an average of 20 decisions when using conventional serial binary decision logic, so it’s clear that some other decision approach is needed here. These very high-speed decision tables are often implemented using content-addressable memory to bypass this serial decision limitation. Ternary content-addressable memory (TCAM) can search its entire contents in a single memory cycle. It’s fast, but it’s also a very expensive component of a high-speed router line card
TCAM size is what you purchase when you buy the router, so you need to pay attention to not only what you need today, but what you may need over the operational lifetime of the unit. If the router is to be useful in, say, 5 years from now, then you need to deploy units that can maintain their switching performance levels five years from now. That often implies configuring your units with sufficient TCAM memory to contain IPv4 and IPv6 routing tables that not only adequate for today but are adequate to meet the routing table requirements some years into the future. Getting it wrong means that you’ve spent too much on your switching equipment if you over-provision or are forced to retire the equipment prematurely if you under-provision. What this means is this size question is an important question both to network operators and to designers and vendors of network switching equipment.
Secondly, there is the overall stability of the system. Processing a routing update requires several lookups into local data structures as well as local processing steps. Each router has a finite capacity to process updates, and once the update rate exceeds this local processing capability, then the router will start to queue up unprocessed updates. In the worst case, the router will start to lag in real time, so that the information a BGP speaker is propagating reflects a past local topology, not necessarily the current local topology. If this lag continues then at some point unprocessed updates may be dropped from the queue. BGP has no inherent periodic refresh capability, so when information is dropped the router, and its neighbours fall out of sync with the network topology. At its most benign, the router will advertise “ghost” routes where the prefix is no longer reachable, yet the out-of-sync router will continue to advertise reachability. At its worst, the router will set up a loop condition and as traffic enters the loop it will continue to circulate through the loop until the packet’s TTL expires. This may cause saturation of the underlying transmission system and trigger further outages which, in turn, may add to the routing load.
The two critical metrics we are interested in are the size of the routing space and its level of updates, or “churn”. Here we will look at the first of these metrics, the size of the routing space, and the changes that occurred through 2021, and use this data to extrapolate forward and look at 5-year projections for the size of the routing table in both IPv4 and IPv6.
The BGP Measurement Environment
In trying to analyse long baseline data series the ideal approach is to keep as much of the local data gathering environment as stable as possible. In this way, the changes that occur in the collected data reflect changes in the larger environment, as distinct from changes in the local configuration of the data collection equipment.
The measurement point being used here is a BGP speaker configured within AS131072. This AS generates no traffic and originates no routes in BGP. It’s a passive measurement point that has been logging all received BGP updates since 2007. The router is fed with a default-free eBGP feed from AS 4608, which is the APNIC network located in Australia, and AS 4777, which is the APNIC network located in Japan, for both IPv4 and IPv6 routes.
There is also no internal routing (iBGP) component in this measurement setup. While it has been asserted at various times that iBGP is a major contributor to BGP scalability concerns in BGP, the consideration here in trying to measure this assertion is that there is no “standard” iBGP configuration, as each network has its own rather unique configuration of Route Reflectors and iBGP peers. This makes it hard to generate a “typical” iBGP load profile, let alone analyse the general trends in iBGP update loads over time.
In this study, the scope of attention is limited to a simple eBGP configuration that is likely to be found as a “stub” AS at the edge of the Internet. This AS is not an upstream for any third party, it has no transit role, and does not have a large set of BGP peers. It’s a simple view of the routing world that I see when I sit at an edge of the Internet. Like all BGP views, its unique to this network, and every other network will see a slightly different Internet with different metrics. However, the behaviour seen by this stub network at the edge of the Internet is probably similar to most other stub networks at the edge of the Internet. While the fine details may differ, the overall picture is probably much the same.
Routing Table Analysis
The IPv4 Routing Table
Measurements of the size of the routing table have been taken on a regular basis since the start of 1988, although highly detailed snapshots of the routing system only date back to early 1994. Figure 1 shows a rather unique picture of the size of the routing table, as seen by all the peers of the Route Views route collector on an hourly basis.
I should take a moment to mention the Route Views Project. It was originally intended to offer a multi-perspective real time view of the inter-domain routing system, allowing network operators to examine in real time the visibility of route objects from various points in the inter-domain topology. What makes Route Views so unique is that it archives these routing tables every two hours and has done so for more than two decades. It also archives every BGP update message. This vast collection of data is a valuable research data set in its own right, and here we are just taking a tiny slice of this data set to look at longer term growth trends.
The folk at the Route Views Project, with the support from the University of Oregon and the US National Science Foundation should be commended for their efforts here. This is a very unique data set if you are interested in the evolution of the Internet over the years.
Several broader events are visible in the history of the routing table, such as the busting of the Internet bubble in 2001, and if one looks closely, the effects of the global financial crisis in 2009. What is perhaps surprising is one ongoing event that is not visible in this plot: since 2011 the supply of IPv4 addresses has been progressively constrained as the free address pools of the various Regional Internet Registries have been exhausted. Yet there is no visible impact on the rate of growth of the number of announced prefixes in the global routing system since 2011. In terms of the size of the routing table it’s as if the exhaustion of IPv4 addresses has not happened at all.
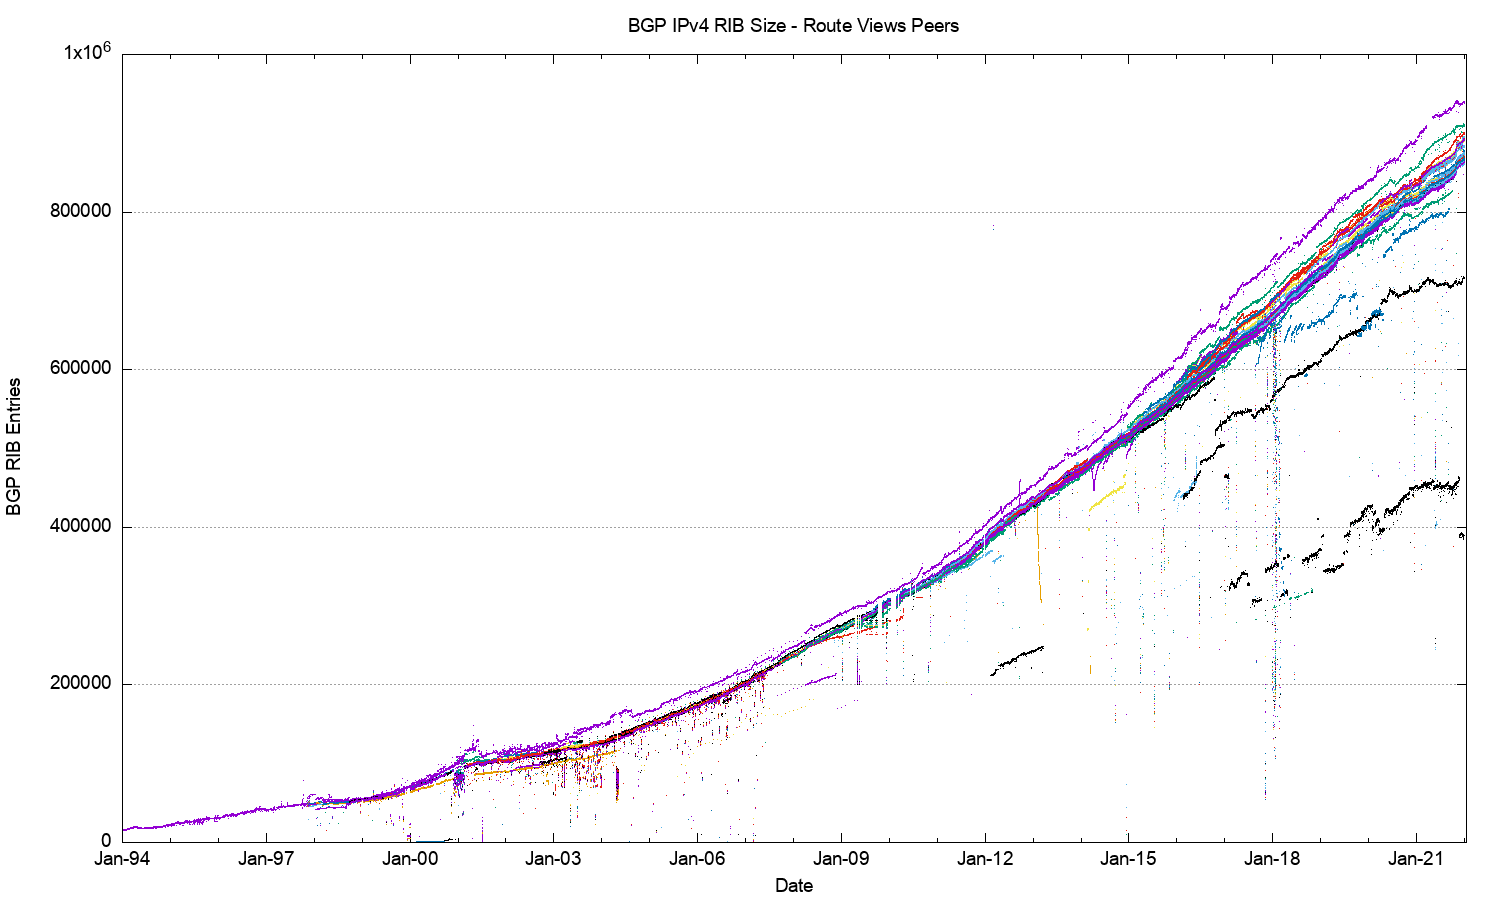
Figure 1 – IPv4 routing table since 1994 as seen by Route Views peers
BGP is not just a reachability protocol. Network operators can manipulate traffic paths using selective advertisement of more specific addresses, allowing BGP to be used as a traffic engineering tool. These more specific advertisements often have a restricted propagation. This is evident in Figure 2, where the BGP routing table counts from both the Route Views peers and the peers of the RIPE NCC’s Routing Information Service (RIS) are combined. There is not a single plot in this figure where each BGP speak sees essentially the same network. There is a variance across the various peers of these route collectors that is around 50,000 routes.
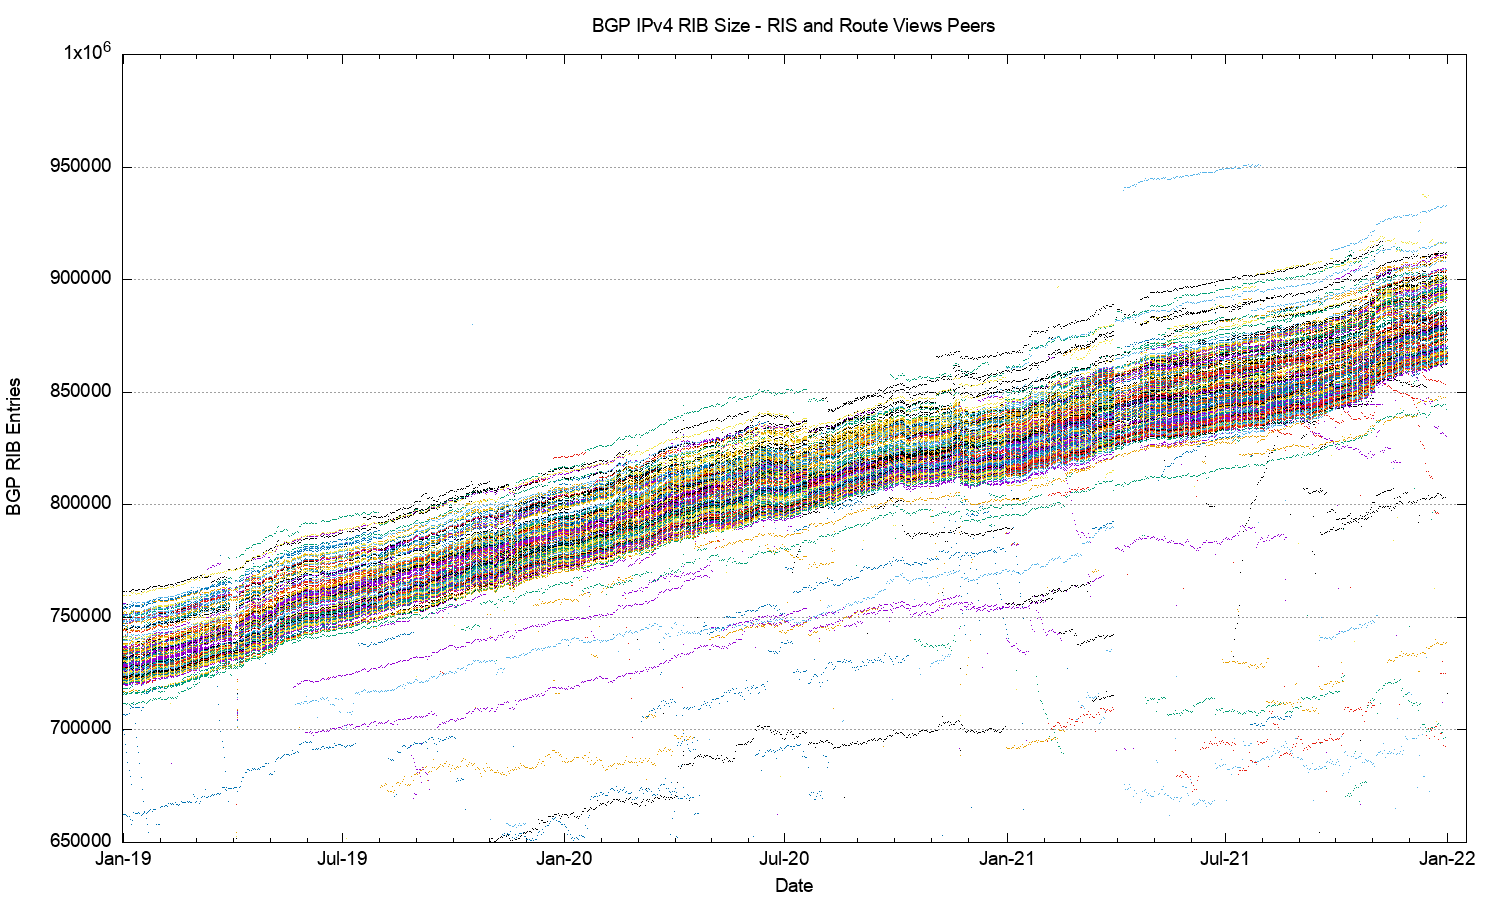
Figure 2 – IPv4 routing table 2019-2021, as seen by Route Views and RIS peers
Figure 2 illustrates an important principle in BGP, that there is no single authoritative view of the Internet’s inter-domain routing table – all views are in fact relative to the perspective of each BGP speaker. It also illustrates that at times the cause of changes in routing is not necessarily a change at the point of origination of the route which would be visible to all BGP speakers across the entire Internet, but it may well be a change in transit arrangements within the interior of the network that may expose, or hide, collections of routes.
The issue of the collective management of the routing system as a single entity could be seen as an instance of a tragedy of the commons where the self-interest of one actor in attempting to minimise its transit service costs becomes an incremental cost in the total routing load that is borne by other actors. To quote the Wikipedia article on this topic “In absence of enlightened self-interest, some form of authority or federation is needed to solve the collective action problem.” This appears to be the case in the behaviour of the routing system, where there is an extensive reliance on enlightened self-interest to be conservative in one’s own announcements.
And finally, in this overview of the BGP system Figure 3 looks at the year 2021 in terms of the number of BGP routing entries, using a 2-hour sample set for the year. All peers observed a small increase in the table size at the start of November 2021.
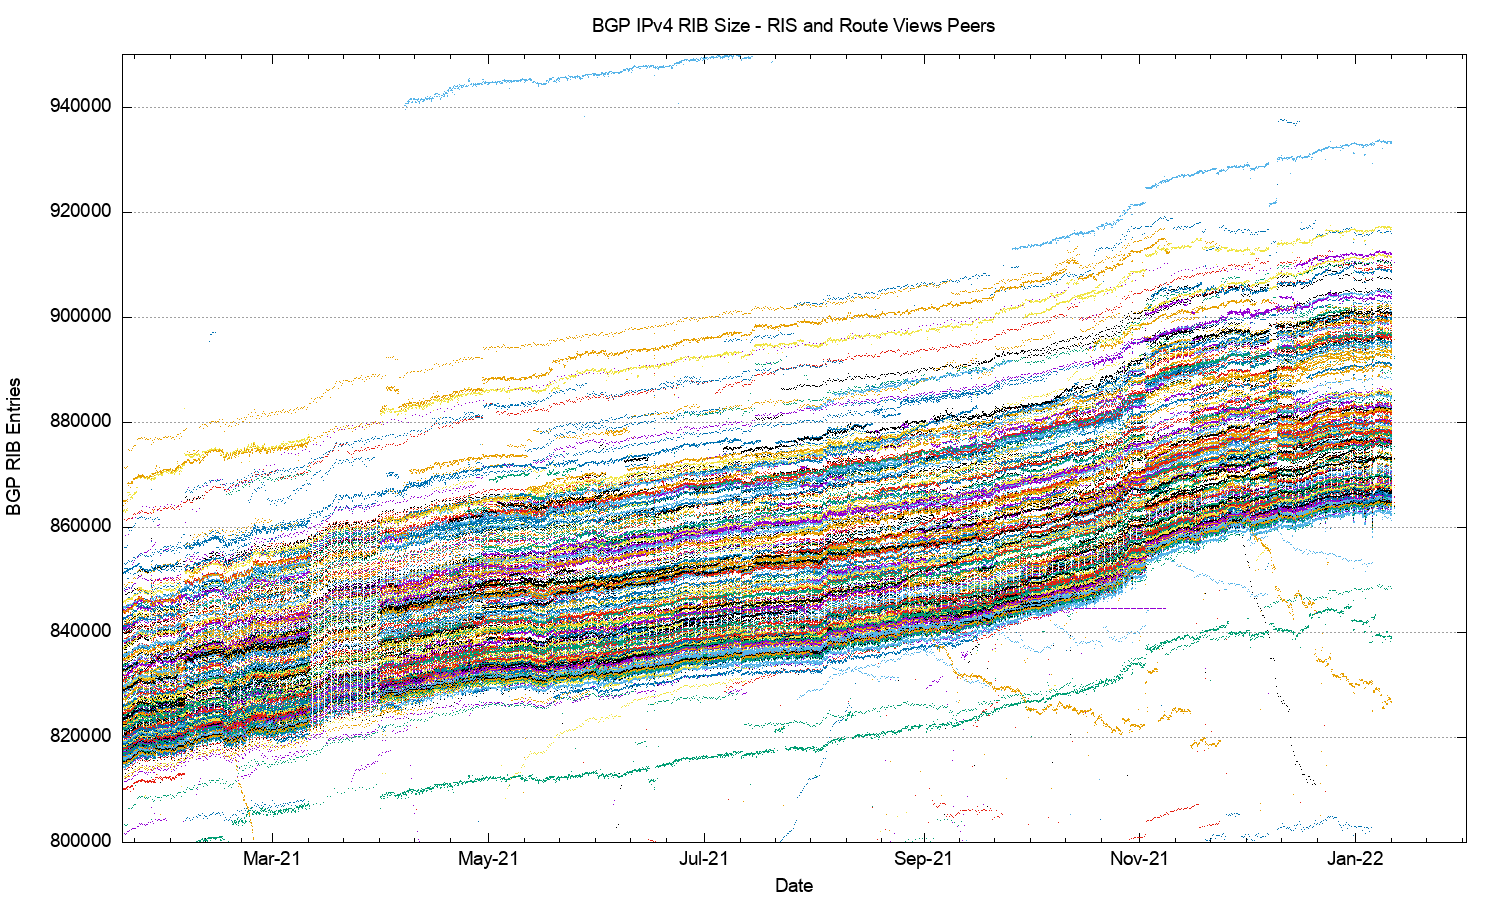
Figure 3 – IPv4 routing table across 2021, as seen by Route Views and RIS peers
The next collection of plots (Figures 4 through 13) contain some of the vital characteristics for IPv4 in BGP since the start of 2012 to the end of 2021.
|
|
|
|
|
|
|
|
|
|
|
|
|
|
|
|
|
|
|
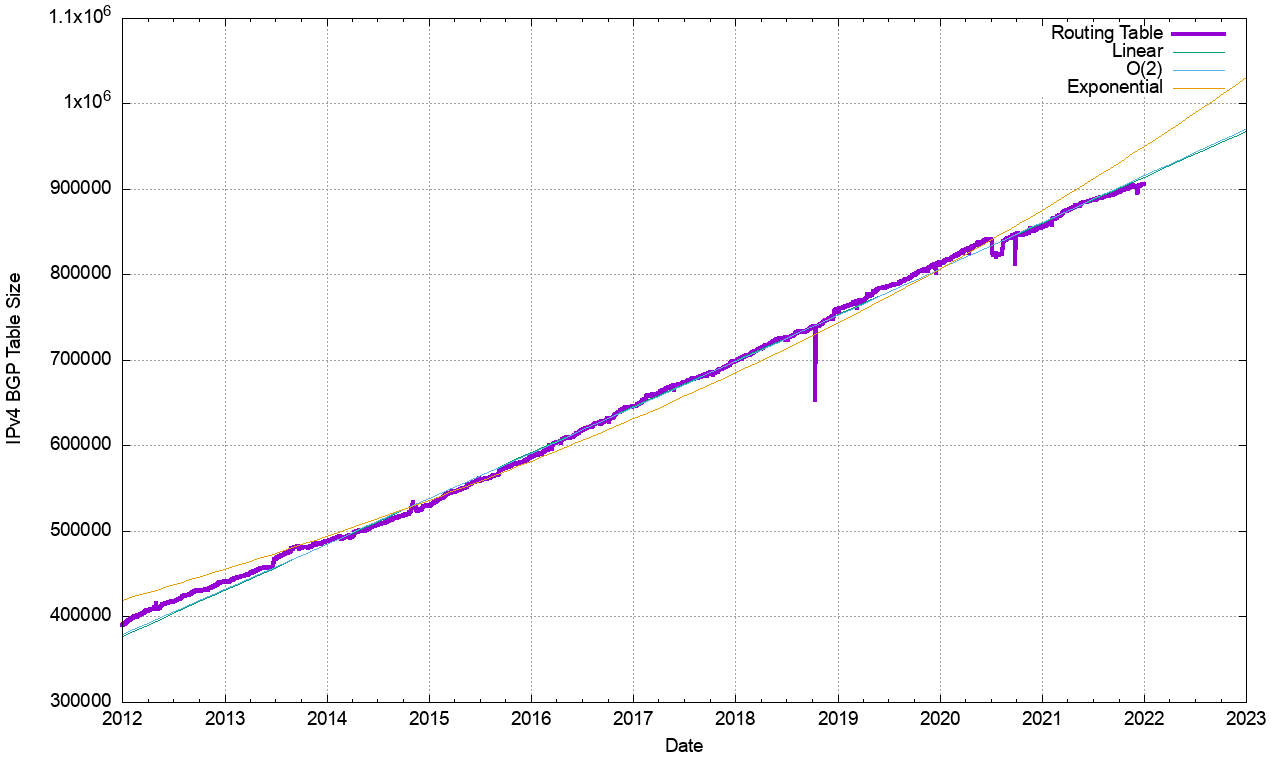
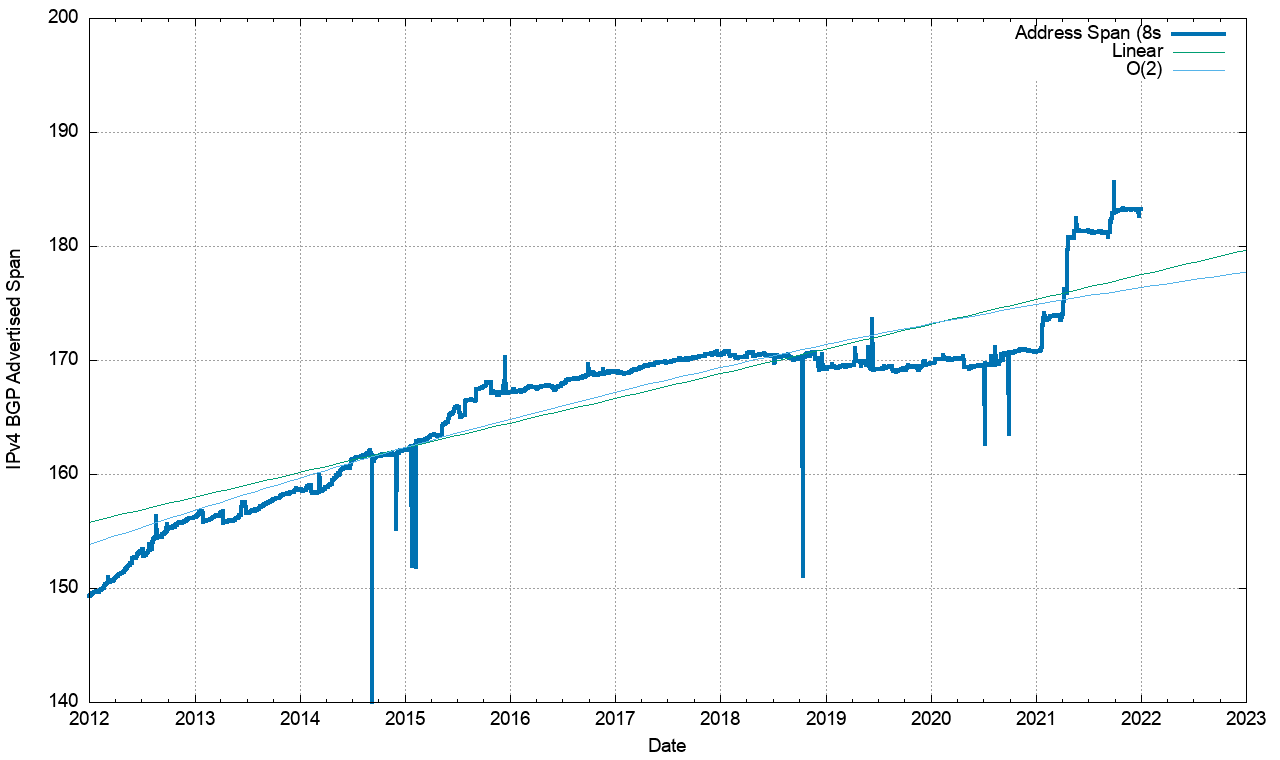
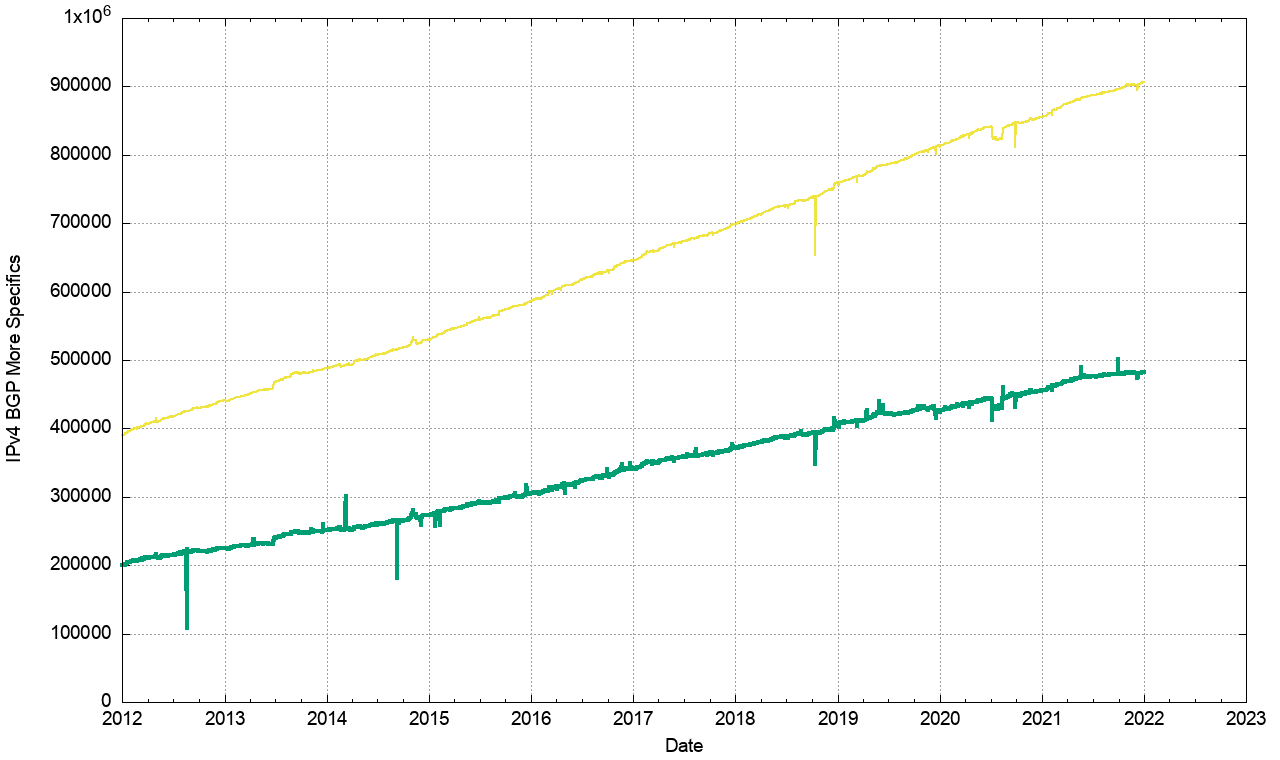
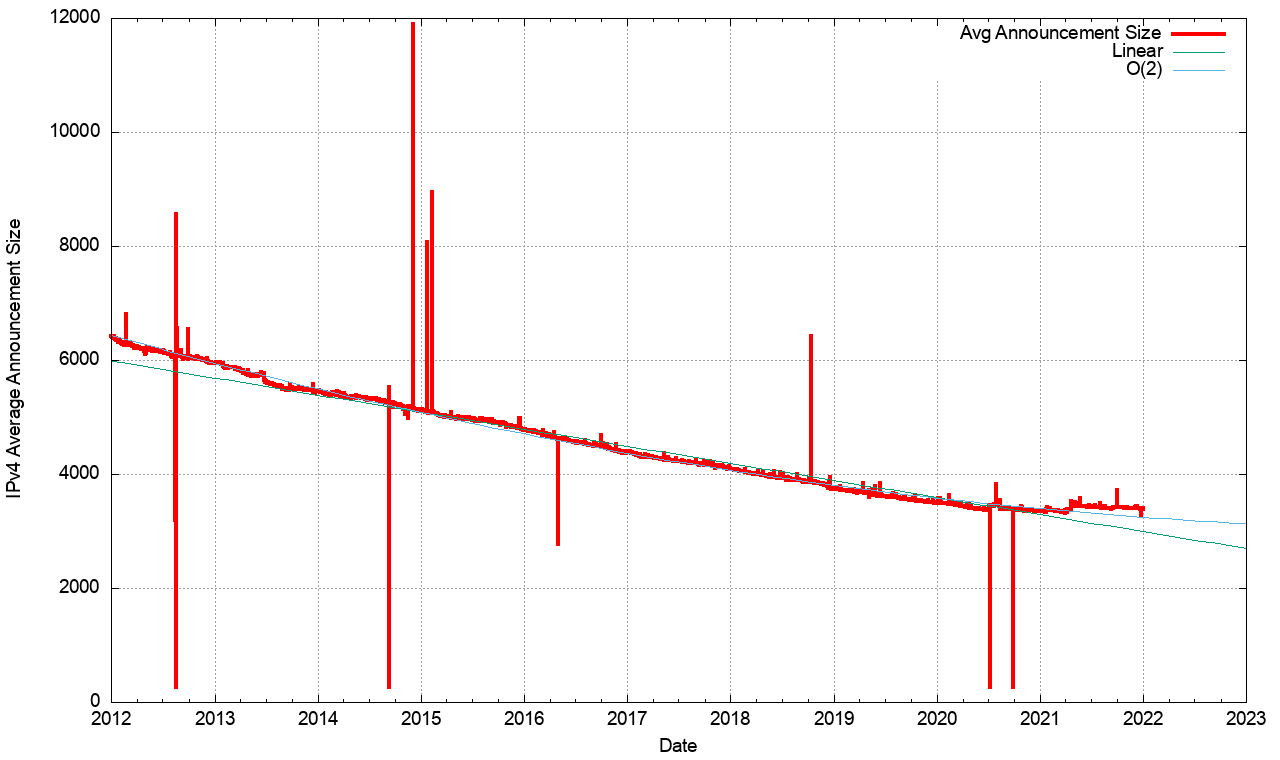
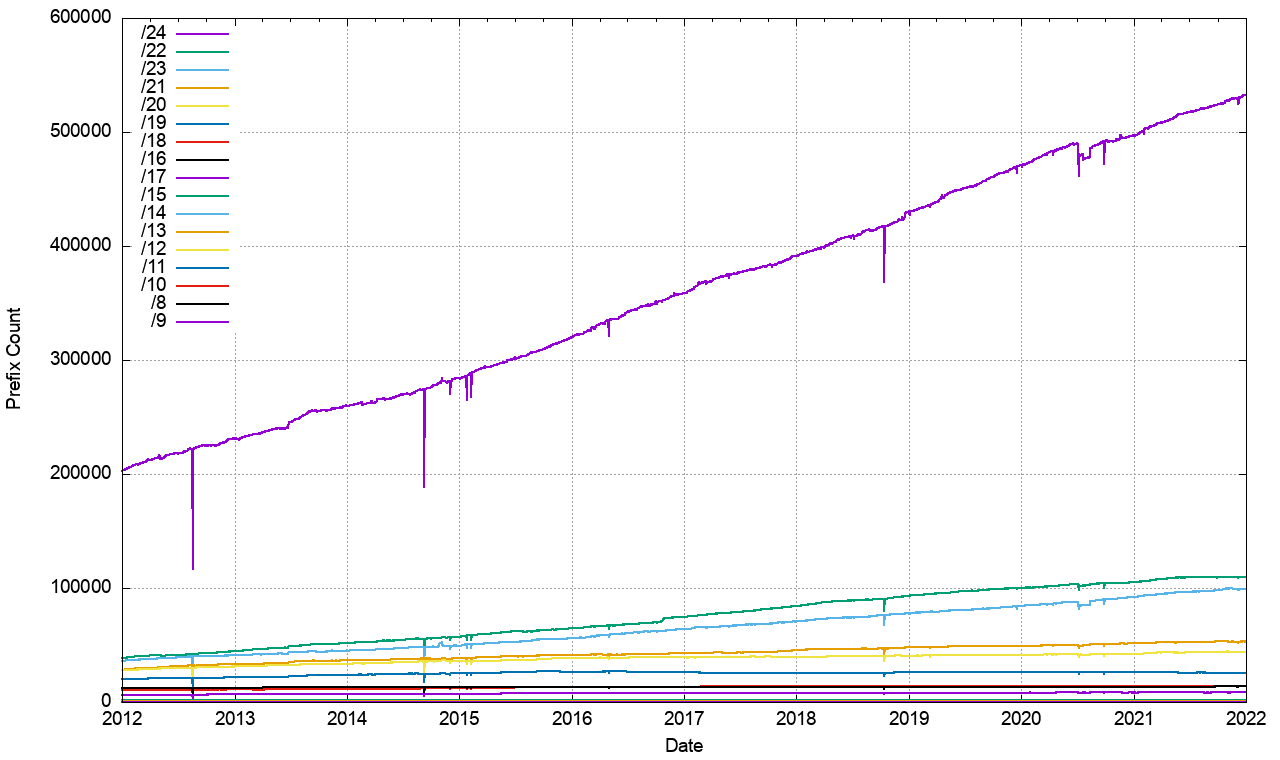
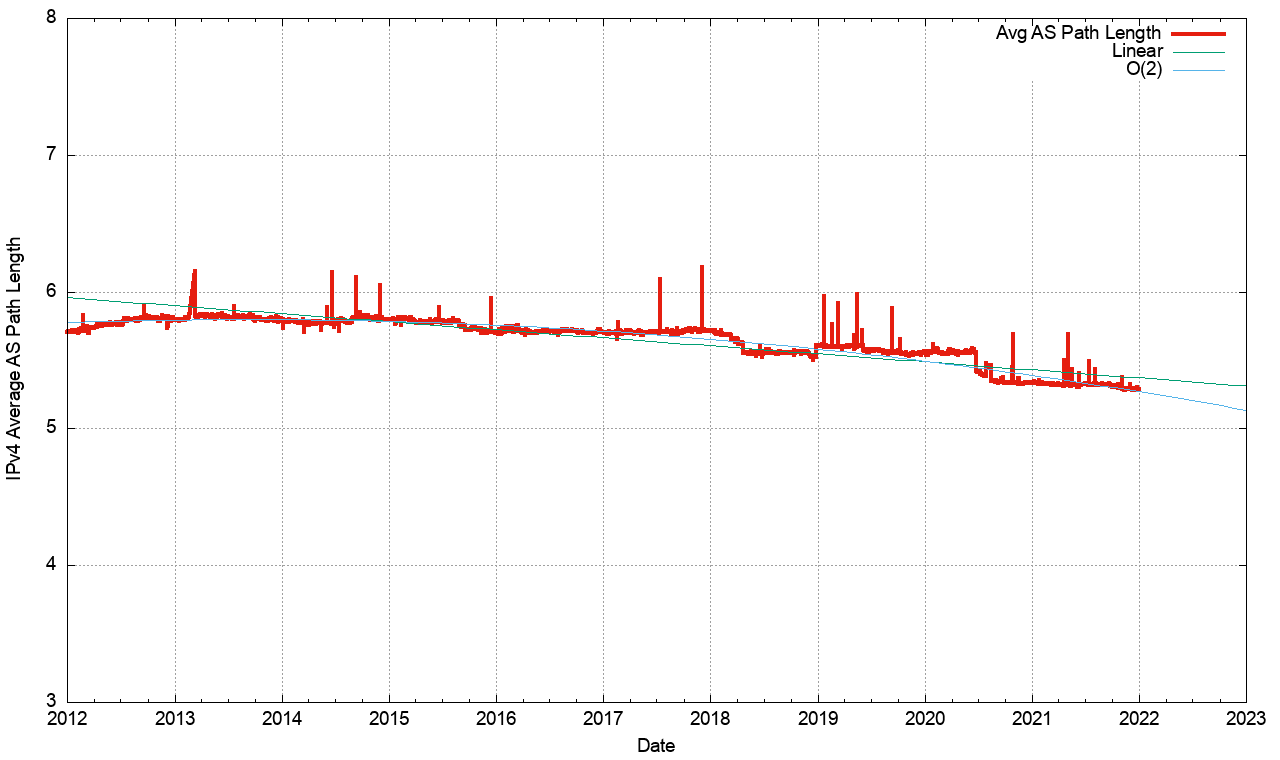
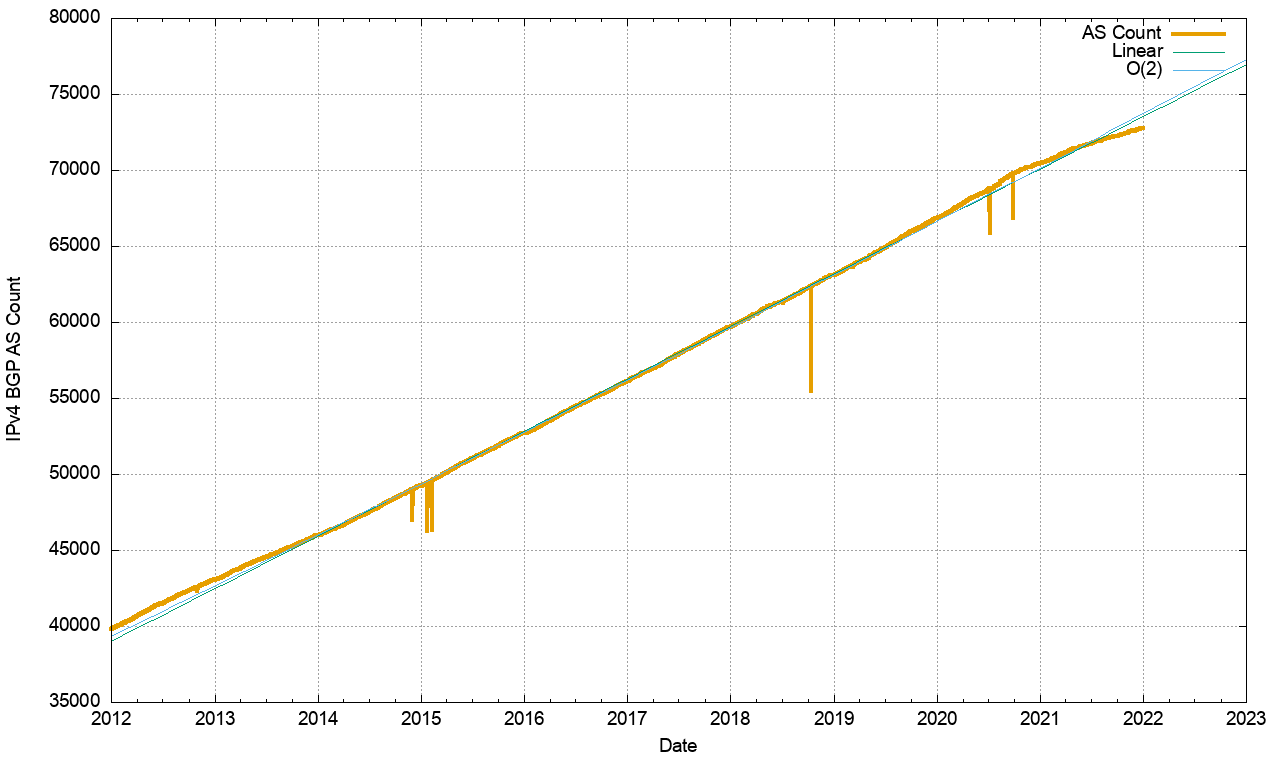
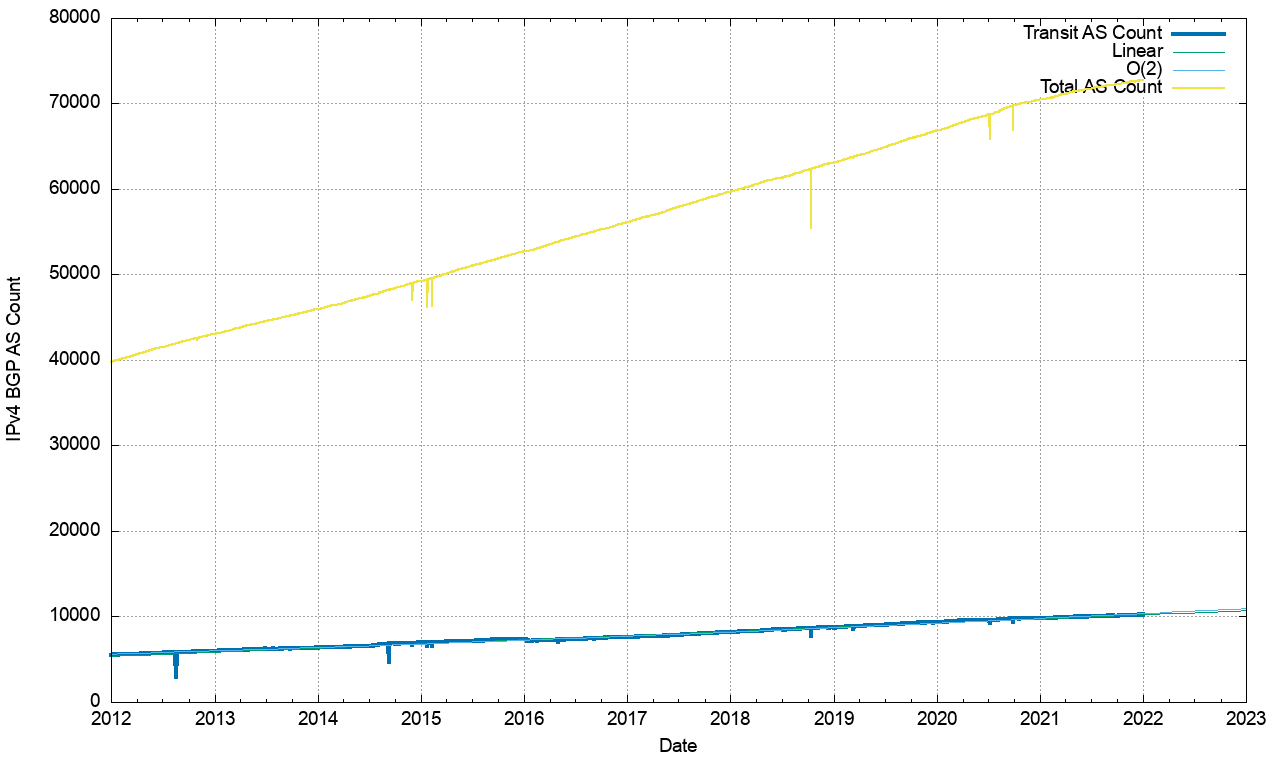
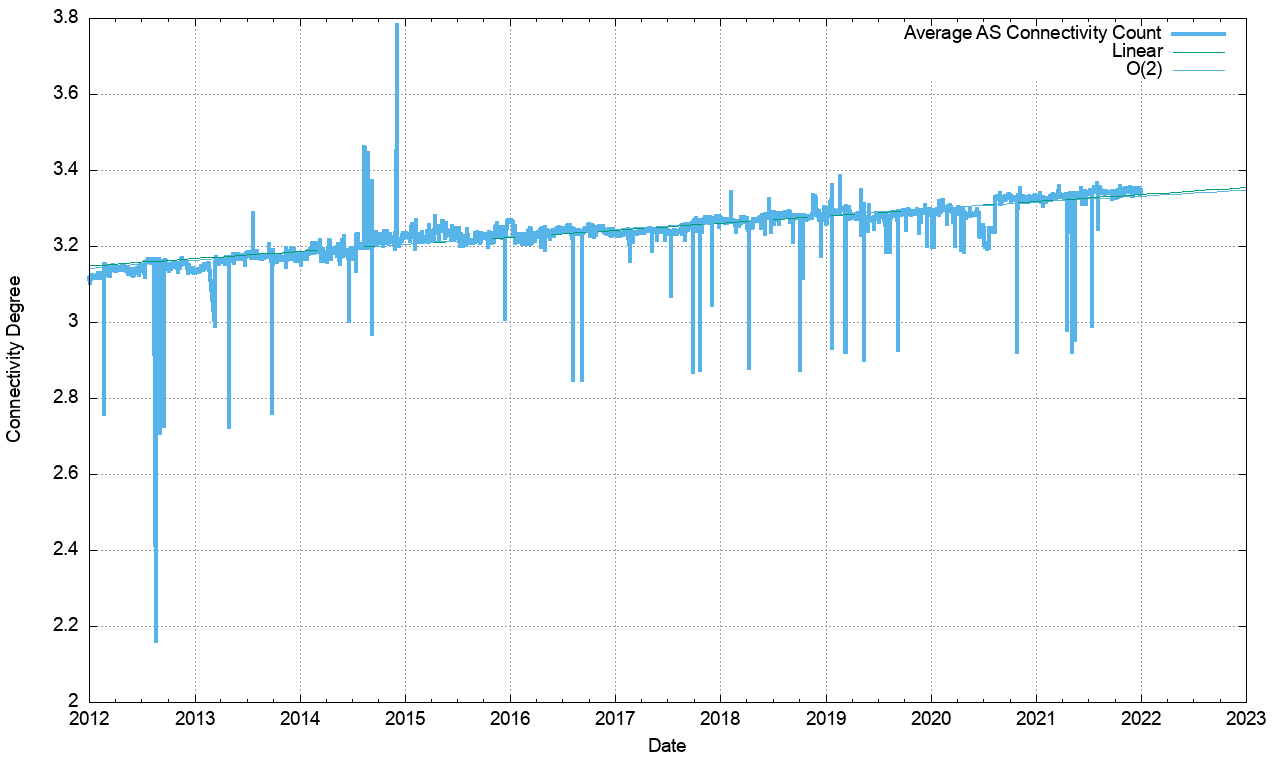
Figure 4 shows the total number of routes in the routing table over this period. This is a classic “up and to the right” Internet trajectory, but it should be noted that growth trends in the Internet today are strongly aligned to a quite modest linear growth model. We’ll return to this data when we look at projections for the size of the BGP FIB table later in this article.
The ten-year period since the start of 2012 has seen the span of addresses advertised in the routing system slowing down until the start of 2021, then in 2021 we saw a number of large address blocks being advertised in the routing system for the first time. (Figure 5). On the 20th of January AS 8003, an AS registered “Global Resource Systems”, a contractor to the US Department of Defence, advertised 11.0.0.0/8 and 22.0.0.0/8. Legacy address blocks originally assigned to the US Department of Defence in the early days of the Internet. On the 7th of April another block, 33.0.0.0/8 was advertised, again by AS 8003. On the 19th and 20th of April a further 4 /8 address blocks, 21.0.0.0/8, 26.0.0.0/8, 28.0.0.0/8 and 30.0.0.0/8, again advertised by AS8003. On the 7th of September the addresses were shifted over to AS749, a network registered to the Defence Data Network. In April this set of address advertisements was picked up in the media, and a number of motives were ascribed to this action (https://www.washingtonpost.com/technology/2021/04/24/pentagon-internet-address-mystery/). The likely explanation is far more prosaic., and probably sits in category of DDOS defence, as the advertisement of these addresses by a legitimate source makes efforts to co-opt these addresses as party of an attack a little more obvious (https://www.potaroo.net/ispcol/2021-04/dodv4.html). At the end of 2021 AS749 originates more IPv4 addresses than any other network, some 211,581,184 addresses, or the equivalent of a /4.34 in prefix length notation.
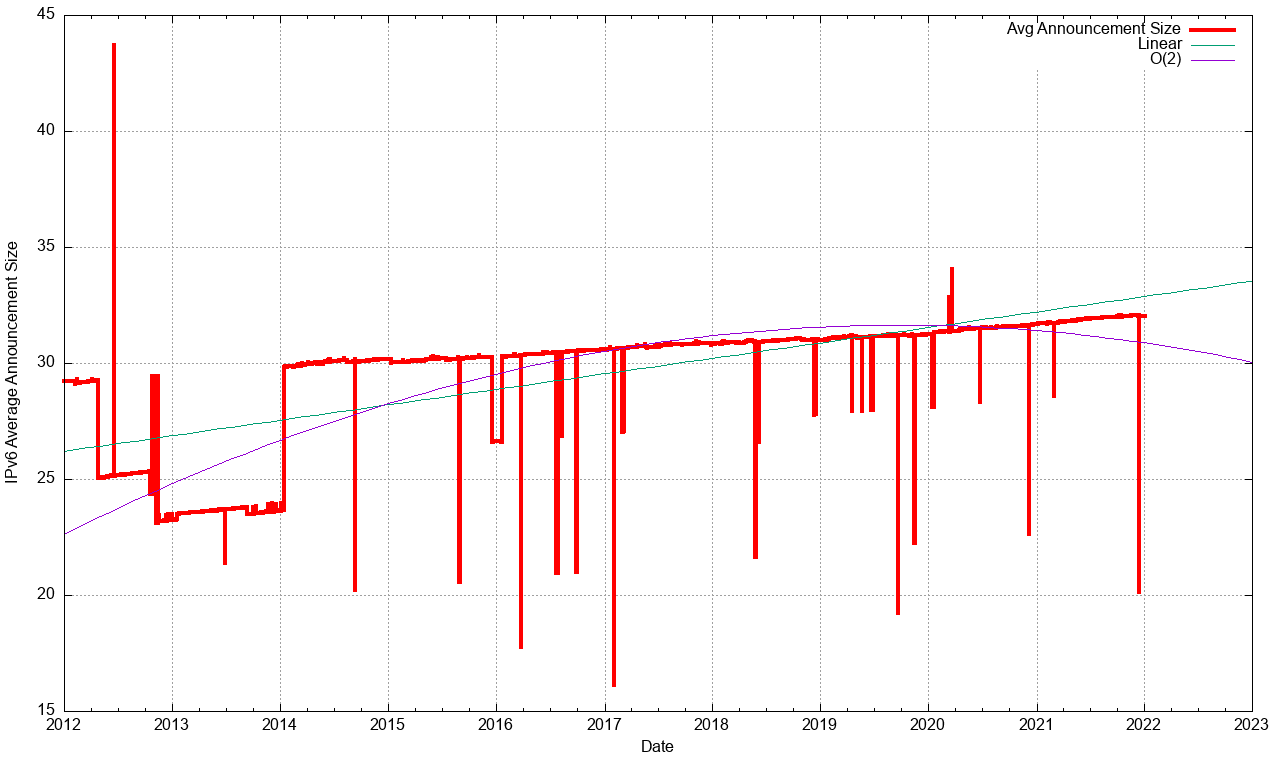
These seven /8 advertisements are enough to alter the average announcement in the IPv4 routing table. The average size of a routed address prefix was 3,394 addresses at the end of the year, where the same matric at the start of 2021 was 3,348 addresses. To put it another way, the granularity of the IPv4 routing space remained roughly constant through 2021, but this was due to a singular factor associated with the advertisement of these DDN legacy networks, and the overall trend to a more finely granulated set of routing advertisements will likely increase once more in 2022. At the end of 2021 93% of all announced IPv4 prefixes are of size /20 or smaller.
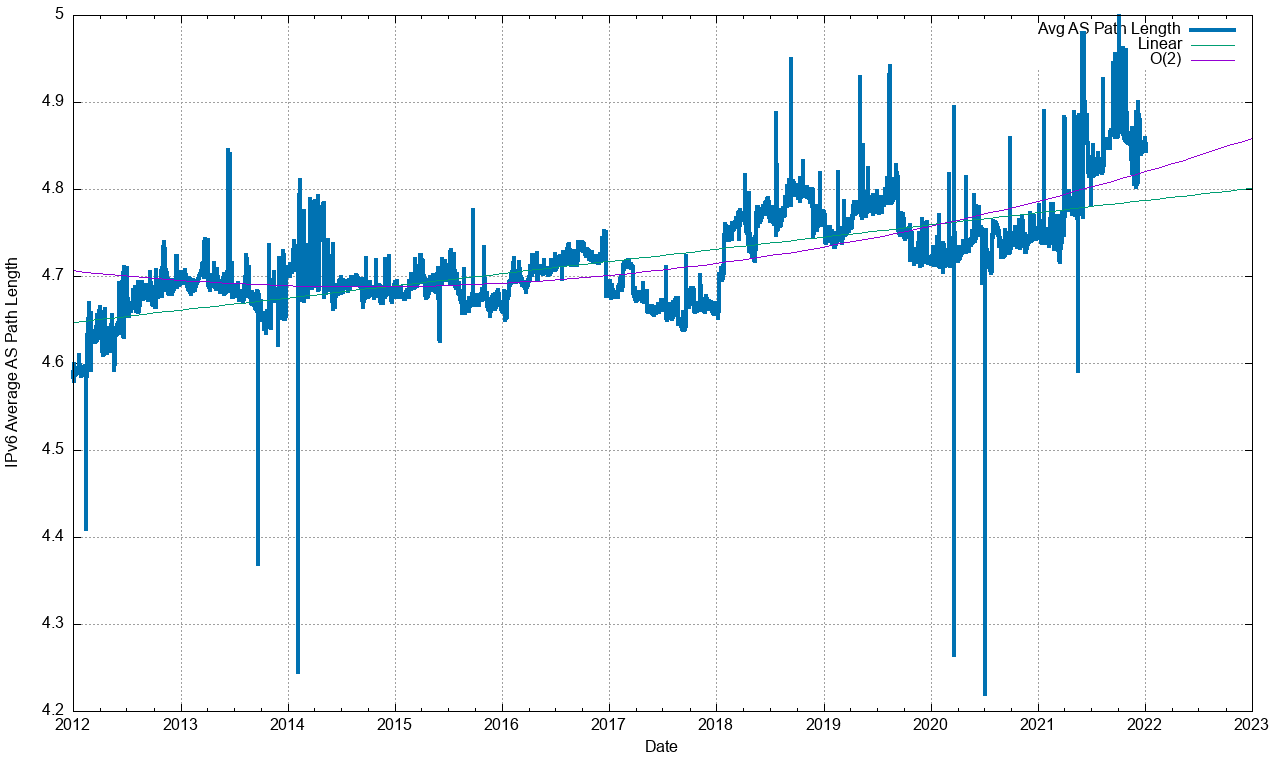
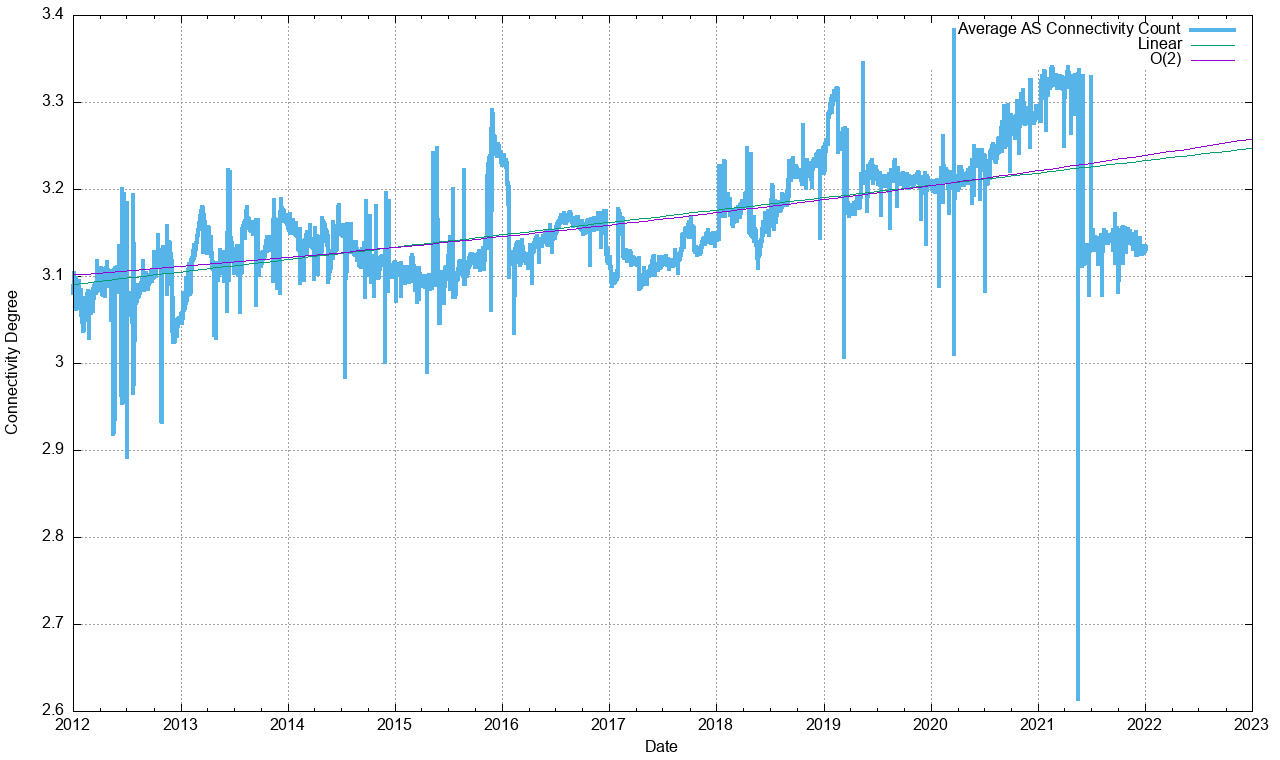
The topology of the network has remained relatively consistent, with the growth in the Internet being seen as increasing density of interconnectivity, rather than through extending transit paths, so the average AS path length has declined slightly for this period for this observation, shown in Figure 10.
The year-by-year summary of the IPv4 BGP network over the 2017-2020 period is shown in Table 1.
| Routing Table | Growth | ||||||||||
|---|---|---|---|---|---|---|---|---|---|---|---|
| Jan-18 | Jan-19 | Jan-20 | Jan-21 | Jan-22 | 2018 | 2019 | 2020 | 2021 | |||
| Prefix Count | 699,000 | 760,000 | 814,000 | 860,000 | 906,000 | 9% | 7% | 6% | 5% | ||
| Root Prefixes | 328,000 | 353,000 | 387,000 | 400,000 | 420,000 | 8% | 10% | 3% | 5% | ||
| More Specs | 371,000 | 407,000 | 427,000 | 460,000 | 486,000 | 10% | 5% | 8% | 6% | ||
| Address Span (/8s) | 169.0 | 169.3 | 169.8 | 171.4 | 183.3 | -1% | 0% | 1% | 7% | ||
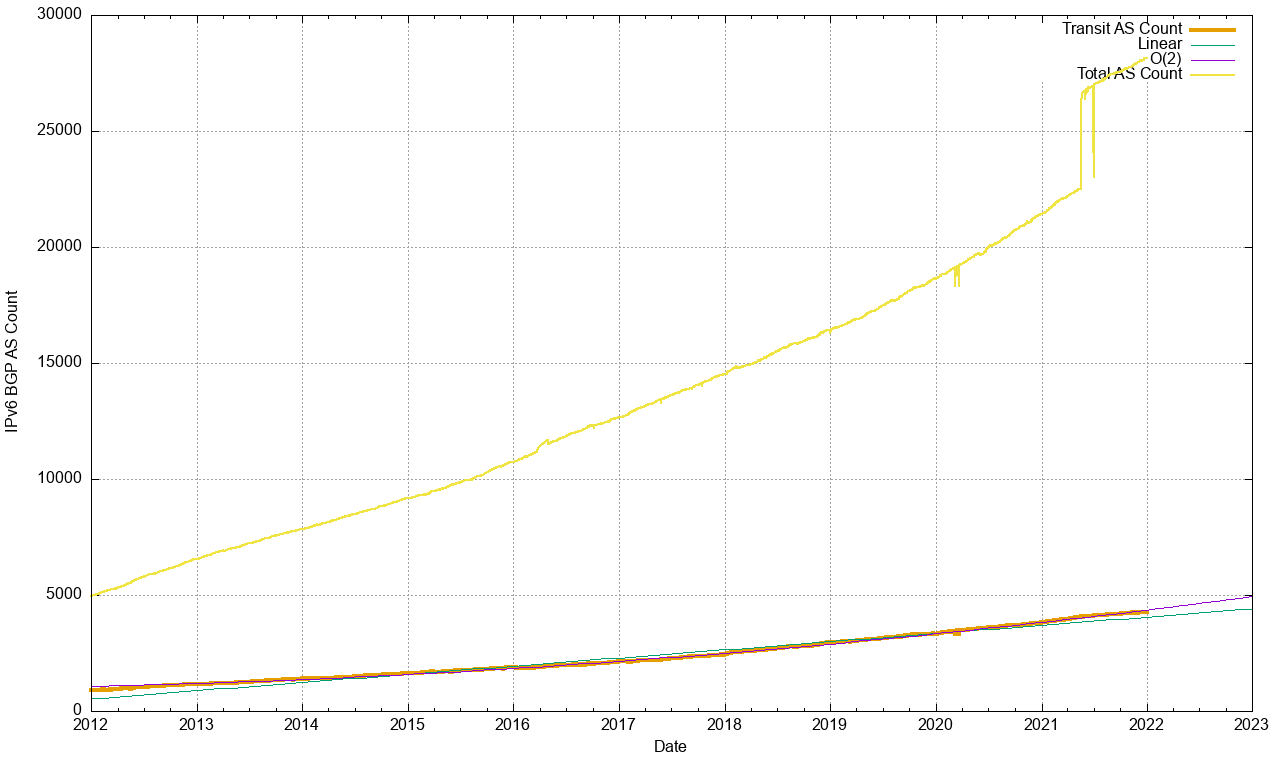
| AS Count | 59,700 | 63,100 | 66,800 | 70,400 | 72,800 | 6% | 6% | 5% | 3% | ||
| Transit AS | 8,500 | 9,000 | 9,600 | 10,200 | 10,800 | 6% | 7% | 6% | 6% | ||
| Stub AS | 51,200 | 54,100 | 57,200 | 60,200 | 62,000 | 6% | 6% | 5% | 3% | ||
Table 1 – IPv4 BGP Table Growth Profile
In terms of advertised prefixes, the size of the routing table continues to grow, but the 5% recorded through 2021 is slightly lower than the numbers seen for the previous three years, and this declining growth is seen on the other metrics of the IPv4 routing space. This observation supports a sub-linear growth model of the routing table size, with a growth rate of on average of 126 prefixes per day for the year. The effects of increasing scarcity of IPv4 addresses and the continuing process of recovering dormant addresses from the so-called legacy space has been overshadowed by the advertising of the US DoD prefixes, and the advertised address space grew by the equivalent of just under 12/8’s for the year. The number of routed Stub AS numbers (new edge networks) grew by 3% in 2021, which is half the growth rate of 2 – 3 years earlier.
It appears that the drivers for growth in the IPv4 BGP network are now declining. It’s likely that we are seeing a number of factors at play. The first is the saturation of many Internet markets, so that the amount of “green field” expansion is far lower than, say, a decade ago. Secondly, we are seeing considerable concentration on the service market, where the level of utilization of addresses is vastly greater by both content and service publishers and by end clients. The service and client numbers may be growing, but that does not necessarily imply the use of more IPv4 addresses or more routing table entries. Thirdly, this concentration in the service market has been accompanied by further consolidation in the access market, particularly in mobile access networks. This consolidation of client access networks creates greater efficiencies in shared address solutions. Finally, the continued deployment of IPv6 cannot be ignored. Within the 10 economies with the largest span of advertised addresses (collectively, these 10 economies advertise 73% of the span of advertised IPv4 addresses) seven of these economies are also in the 10 countries with the largest span of advertised IPv6 addresses (collectively, these 10 economies advertise 69% of the span of advertised IPv6 addresses). Looking at just these seven economies, namely the United States, China, Japan, Germany, Brazil, the United Kingdom and Australia, they advertise 56% of the entire advertised IPv6 address span and 64% of the advertised IPv4 address span. The level of IPv6 use in five of these seven economies have a greater use of IPv6 deployment than the total global deployment level of 30% of end users, while the deployment levels in Australia and China are slightly below this global average.
As IPv4 addresses are being placed under increasingly higher scarcity pressure, the compensatory move is that the advertised address space being divided up into smaller units, and presumably this routing change is accompanied by the increasing use of IPv4 Network Address Translation (NAT) to accommodate the underlying network’s growth pressures.
The density of inter-AS interconnection continues to increase. The growth of the Internet is not “outward growth from the edge” as the network is not getting any larger in terms of average AS path length. Instead, the growth is happening by increasing the density of the network by attaching new networks into the existing transit structure and peering at established exchange points. This makes for a network whose diameter, measured in AS hops, is essentially static, yet whose density, measured in terms of prefix count, AS connectivity degree and AS Path diversity, continue to increase. This denser mesh of interconnectivity could be potentially problematical in terms of convergence times if the BGP routing system used a dense mesh of peer connectivity, but the topology of the network continues along a clustered hub and spoke model, where a small number of transit ASs directly service a large number of stub edge networks. This implies that the performance of BGP in terms of time and updates required to reach convergence continues to be relatively static.
The IPv6 BGP Table Data
A similar exercise has been undertaken for IPv6 routing data. There is considerable diversity in the number of routes seen at various vantage points, as shown when looking at the prefix counts advertised by all the peers of Route Views (Figure 14).
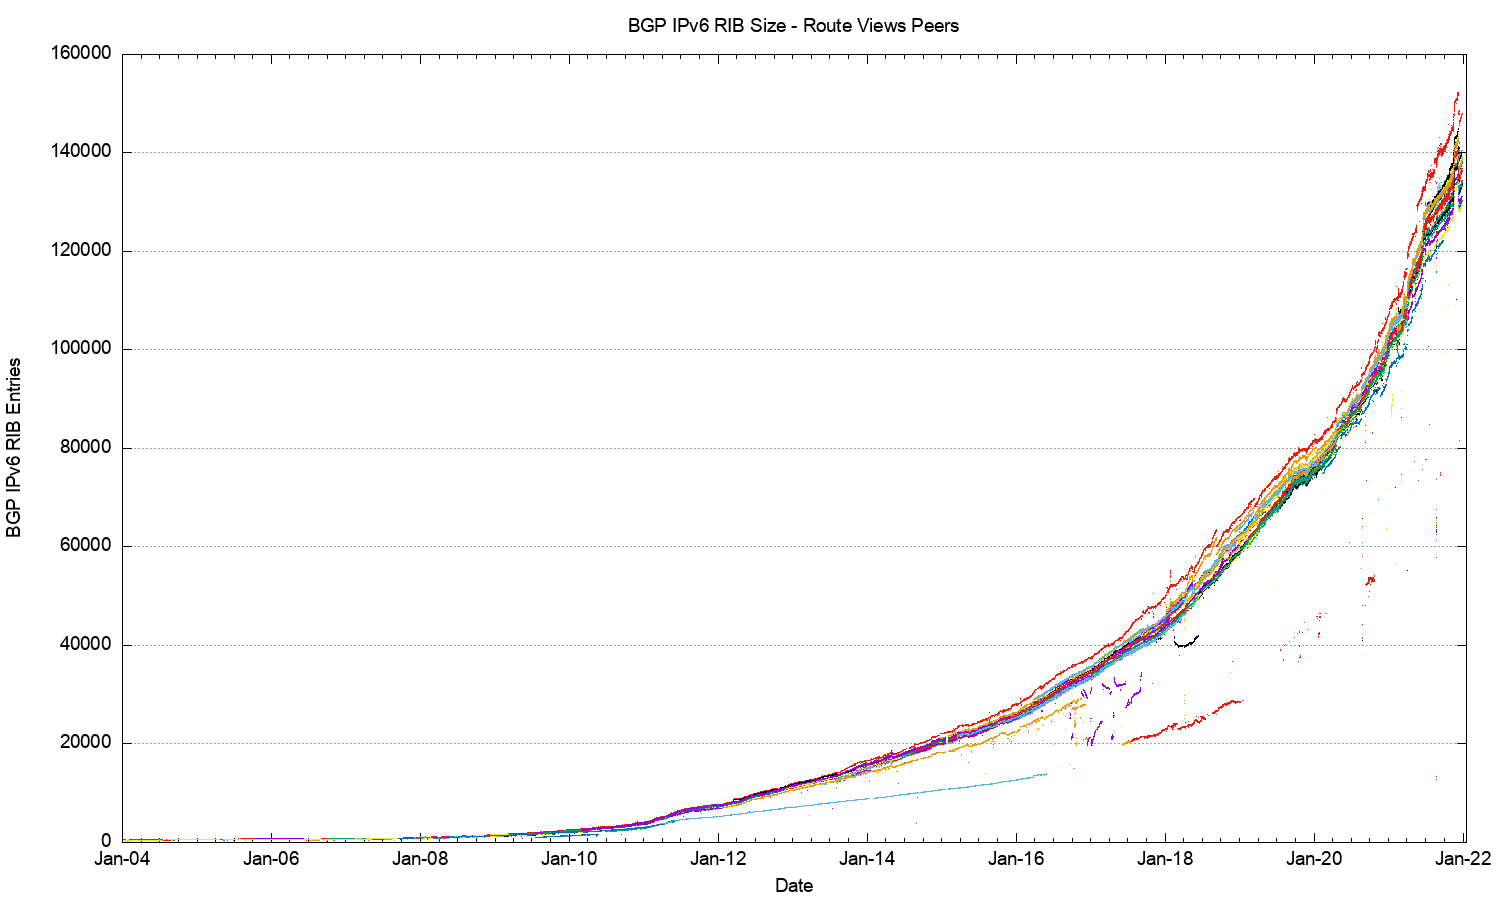
Figure 14 – IPv6 routing table since 2004 as seen by Route Views peers
A more detailed look at 2019 and 2020 incorporating both Route Views and RIS (Figure 14) shows that in IPv6 there is no visible disparity in the route sets announced by RIS peers as compared to Route Views peers. It is also evident that there increasing diversity between various BGP views as to what constitutes the “complete” IPv6 route set, and the variance at the end of 2020 now span some 10,000 prefix advertisements.
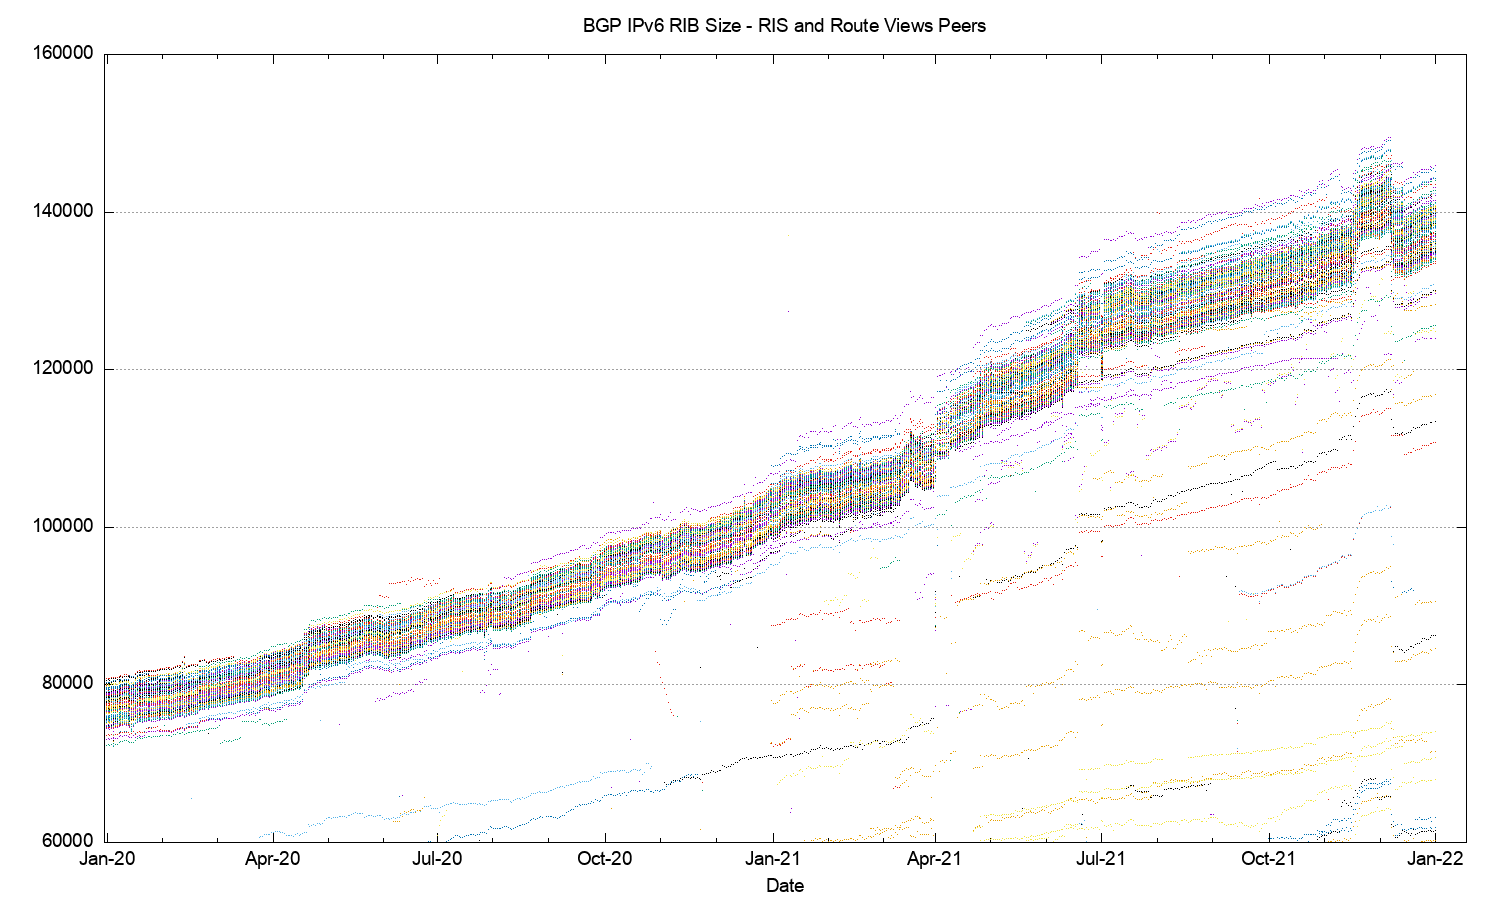
Figure 15 – IPv6 routing table 2019 – 2020 as seen by Route Views and RIS peers
Figure 16 shows a detailed view of the routing table as seen by each of the Route Views and RIS peers across the year, using 2-hourly snapshots.
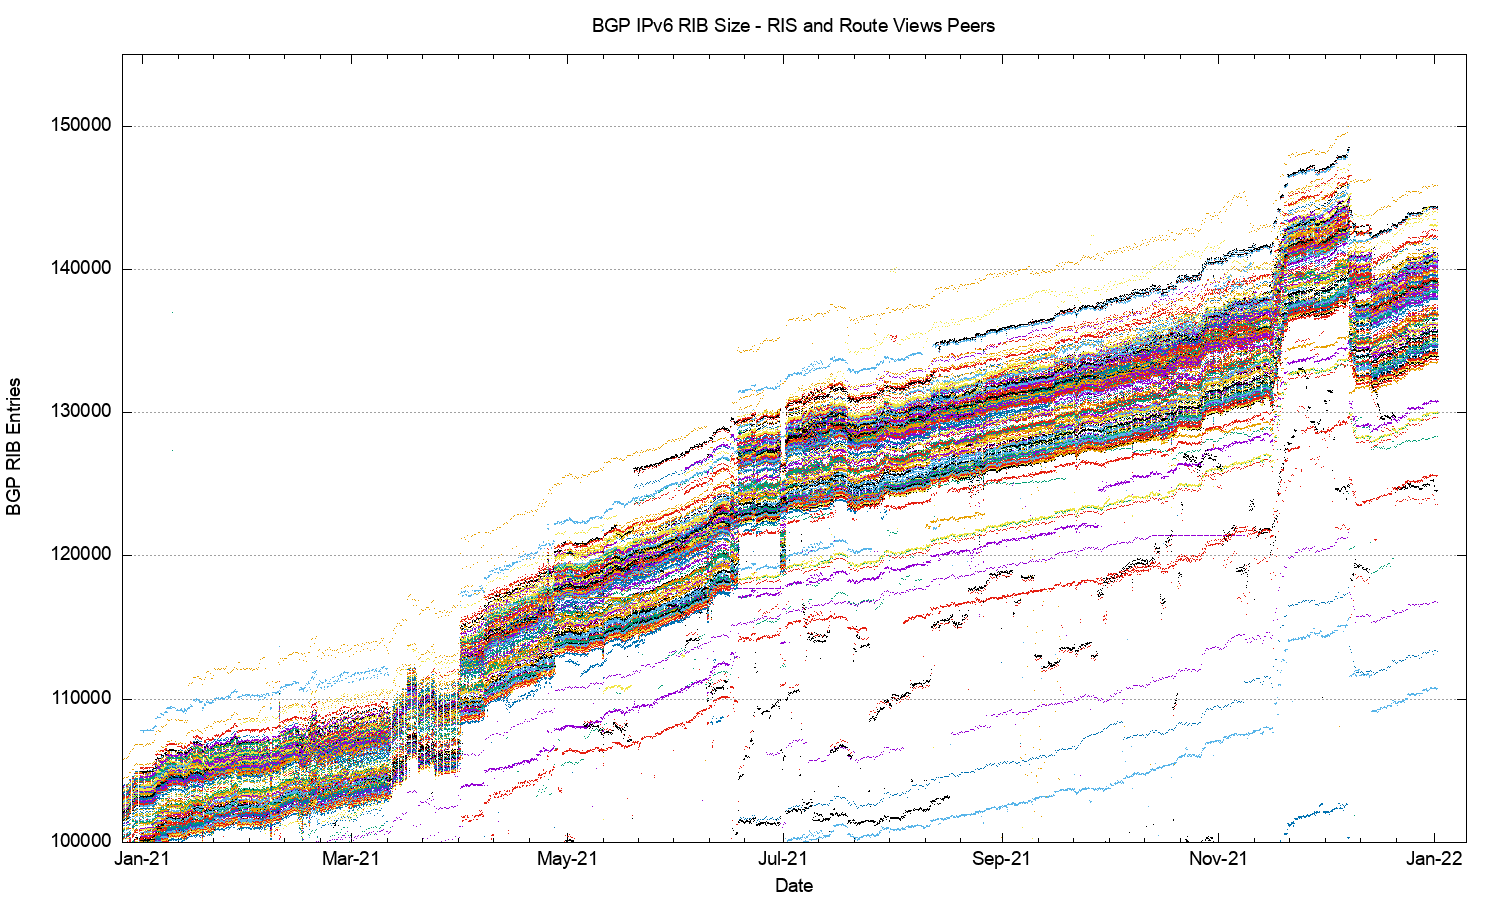
Figure 16 – IPv6 routing table across 2021, as seen by Route Views and RIS peers
The comparable profile figures for the IPv6 Internet are shown in Figures 17 through 26.
|
|
|
|
|
|
|
|
|
|
|
|
|
|
|
|
|
|
|
There have been some anomalies in routing table in 2021, with a distinct jump in the number of visible prefixes in April, May, November and December.
Some 4,000 IPv6 announcements were added at the start of April 2021, and a further 5,000 announcements in mid-May. In both cases these were predominately more-specific announcements, and in both cases /48 and /32 announcements dominated. A similar situation occurred in November and December, where a collection of some 7,000 more specifics were announced in mid-November and then withdrawn in mid-December.
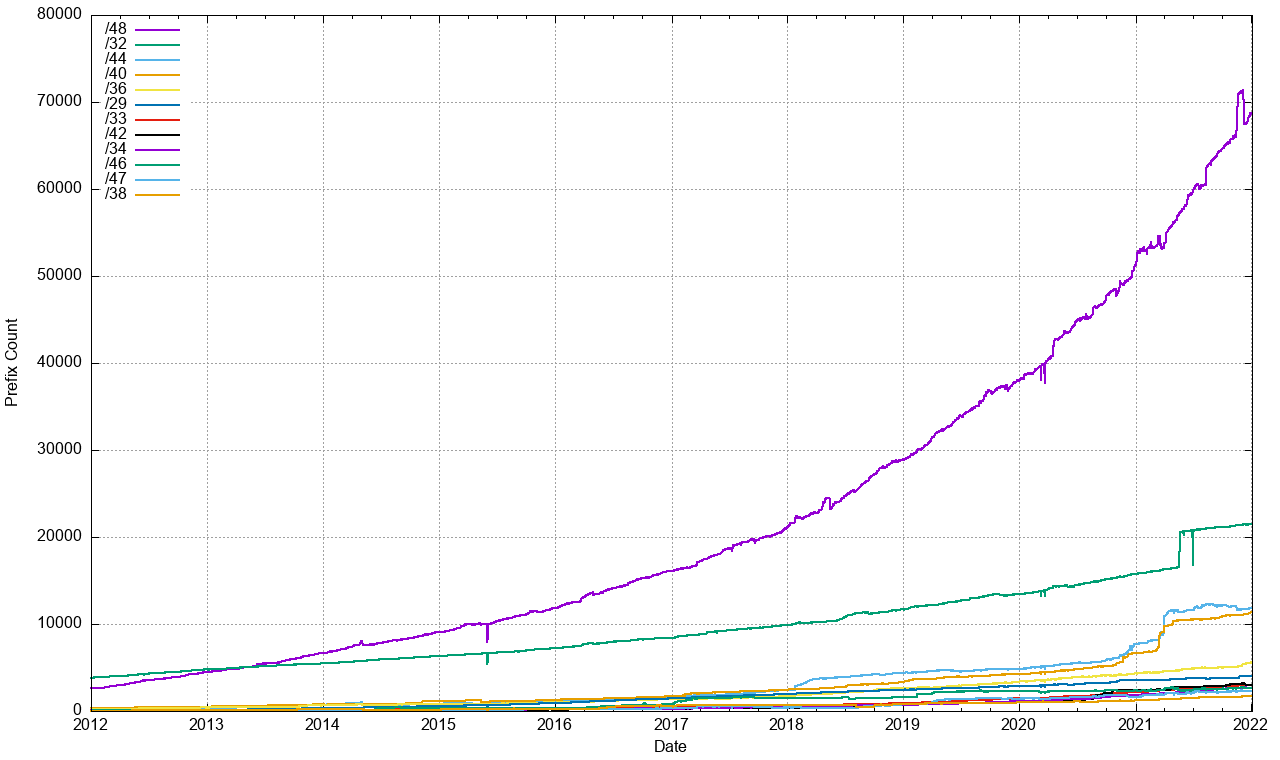
Routing advertisements of /48s are the most prevalent prefix size in the IPv6 routing table at the end of 2021, and some 47% of all prefixes are /48’s. A total of 77% of the IPv6 table entries are composed of /48, /32, /44, and /40 prefixes.
RIR allocations of IPv6 addresses show a different pattern, with 75% of address allocations are either a /32 (50%) or a /29 (25%). Only some 18% of allocations are a /48. What is evident is that there is no clear correlation between an IPv6 address allocation size as used by the address registries and the advertised address prefix size, and many IPv6 address holders do not advertise their entire allocated IPv6 address prefix in a single routing advertisement.
Why is the IPv6 routing table being fragmented so extensively? The conventional response is that this is due to the use of more specific route entries to perform traffic engineering. However, given that IPv6 traffic volumes still tend to be far lower than IPv4 volumes for most networks, this rationale probably does not apply in all cases. Another possible reason is the use of more specifics to counter efforts of route hijacking. This also has issues, given that it appears that most networks appear to accept a /64 prefix, and the disaggregated prefix is typically a /48, so as a countermeasure for more specific route hijacks it may not be all that effective.
This brings up the related topic of the minimum accepted route object size. The common convention in IPv4 is that a /24 prefix advertisement is the smallest address block will propagate across the entire IPv4 default-free zone. More complex minimum size rules have largely fallen into disuse as address trading appears to be slicing up many of the larger address blocks into smaller sizes. If a /24 is the minimum accepted route prefix size in IPv4, what is the comparable size in IPv6? There appears to be no common consensus position here, and the default is to use no minimum size filter. In theory that would imply that a /128 would be accepted across the entire IPv6 default-free zone, but a more pragmatic observation is that a /32 would be assuredly accepted by all networks, and it appears that many network operators believe that a /48 is also generally accepted. Given that a /48 is the most common prefix size in today’s IPv6 network this belief appears to be the case. However, we also see prefixes smaller in size than a /48 in the routing table with /49, /52, /56 and /64 prefixes present in the IPv6 eBGP routing table. Slightly more than 1% of all advertised prefixes are more specific than a /48.
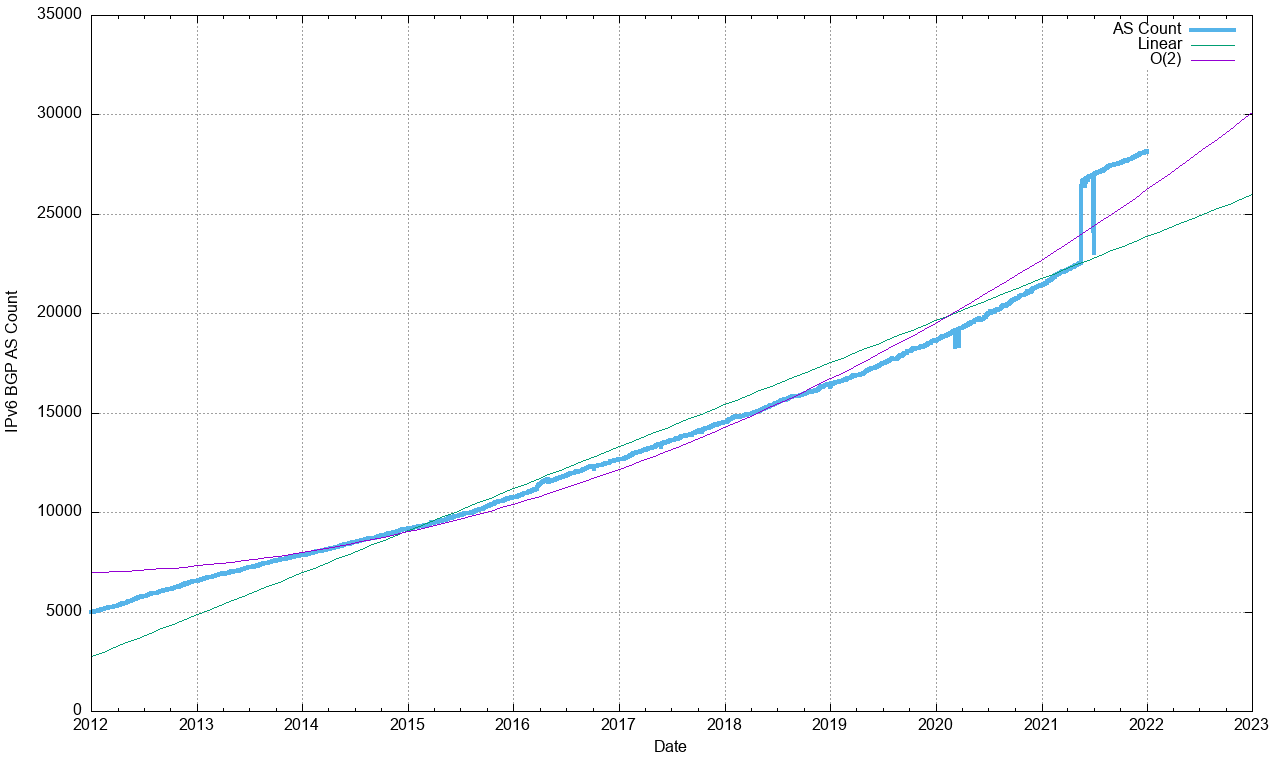
Some 4,000 ASes were added on the 20th of May. The major reason appears to have been a re-organisation within China’s Education and Research Network, which has reorganised its route advertisements to advertisements to route a single /32 IPv6 prefix per AS, using the block of AS numbers AS142650 – AS146745 for this purpose. Presumably this is to support some form of network slicing research experiment, although it is unclear to me why these /32 advertisements are separately advertised into the global IPv6 routing tables.
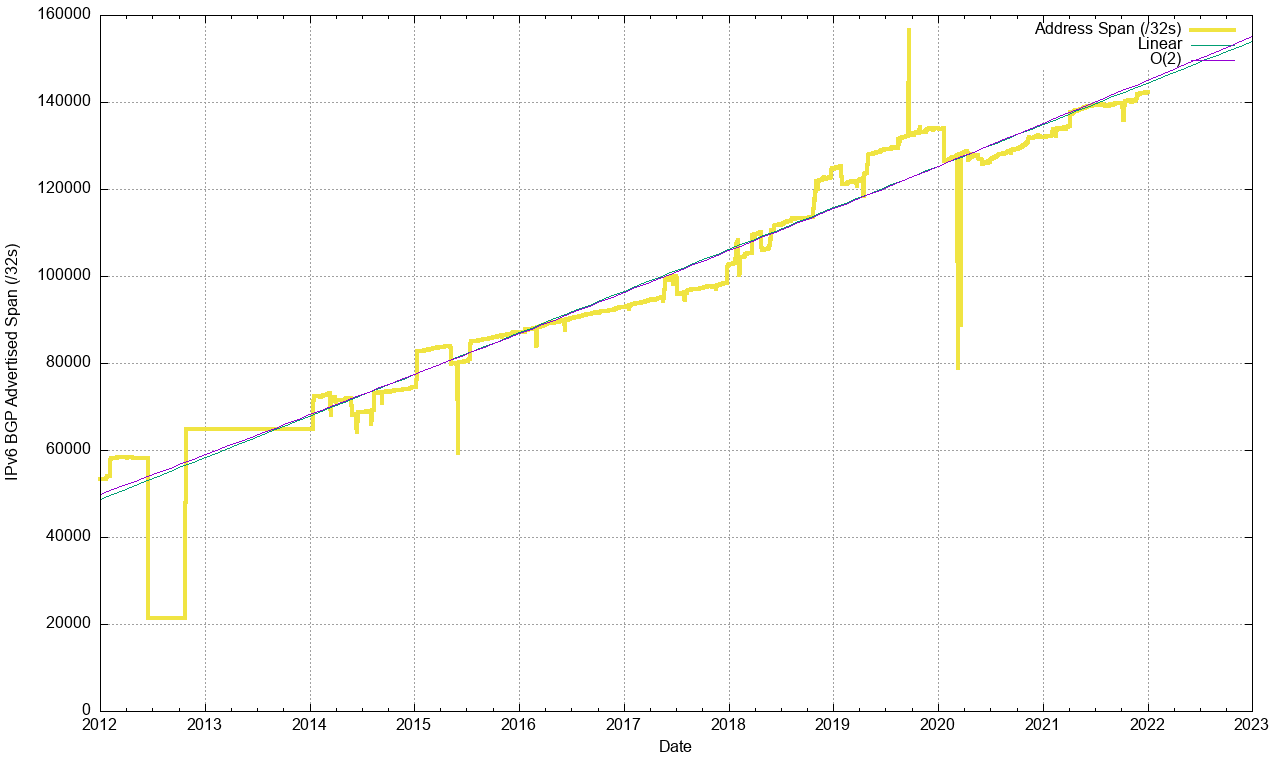
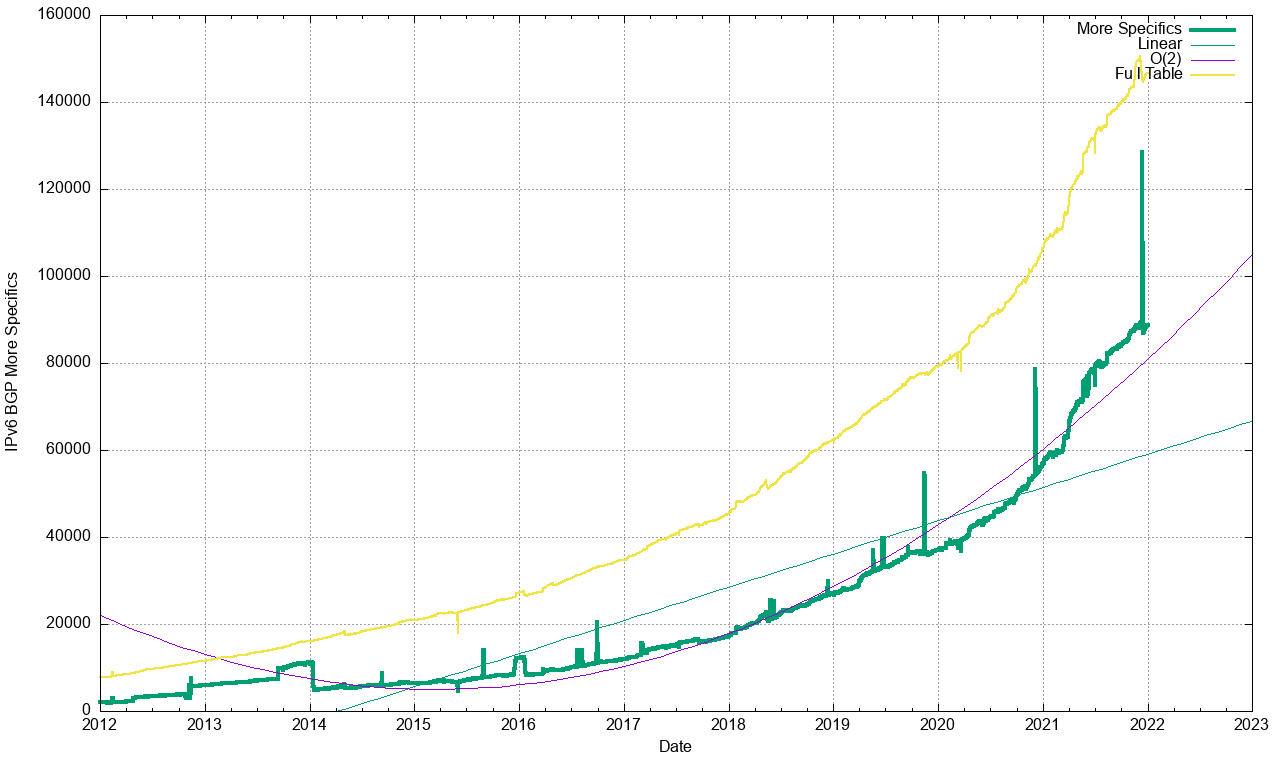
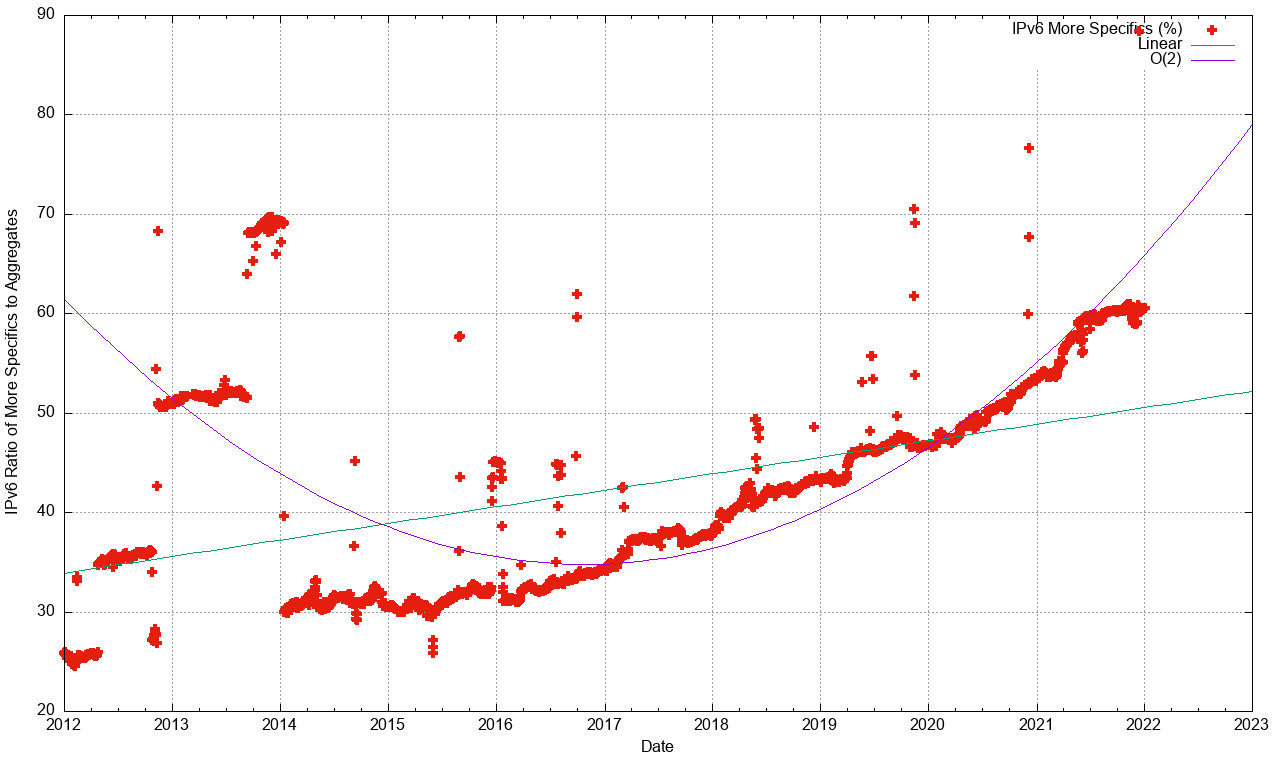
The summary of the IPv6 BGP routing table profile for period 2018 through to the start of 2022 is shown in Table2. While the routing table grew significantly over 2021, much of that growth was in the announcement of more specifics (which grew by 58% for the year) rather than in announcing root address prefixes. The advertised address span grew at a far more modest rate of 8%.
| Routing Table | Growth | ||||||||||
|---|---|---|---|---|---|---|---|---|---|---|---|
| Jan-18 | Jan-19 | Jan-20 | Jan-21 | Jan-22 | 2018 | 2019 | 2020 | 2021 | |||
| Prefix Count | 45,700 | 62,400 | 79,400 | 105,500 | 146,500 | 37% | 27% | 33% | 39% | ||
| Root Prefixes | 28,200 | 35,400 | 42,300 | 49,200 | 57,8– | 26% | 19% | 16% | 17% | ||
| More Specifics | 17,500 | 27,000 | 37,100 | 56,300 | 88,700 | 54% | 37% | 52% | 58% | ||
| Address Span (/32s) | 102,700 | 124,900 | 133,800 | 132,000 | 142,300 | 22% | 7% | -1% | 8% | ||
| AS Count | 14,500 | 16,470 | 18,650 | 21,400 | 28,140 | 14% | 13% | 15% | 31% | ||
| Transit AS Count | 2,600 | 3,190 | 3,590 | 4,100 | 4,580 | 23% | 13% | 14% | 12% | ||
| Stub AS Count | 11,900 | 13,280 | 15,600 | 17,300 | 23,560> | 12% | 13% | 15% | 36% | ||
Table 2 – IPv6 BGP Table Growth Profile
The Predictions
What can this data from 2021 tell us in terms of projections of the future of BGP in terms of BGP table size?
Forecasting the IPv4 BGP Table
Figure 27 shows the data set for BGP from January 2012 until January 2021. This plot also shows the fit of these most recent 5 years of data to various growth models. The first order differential, or the rate of growth, of the BGP routing table is shown in Figure 28. The ten-year linear average rate of growth of the routing table appears be rising slowly from 140 to 160 additional entries per day. This ten-year series data suggests that a reasonable prediction of IPv4 BGP table size can be generated using a linear growth model of approximately 150 additional routing entries per day (Figure 28).
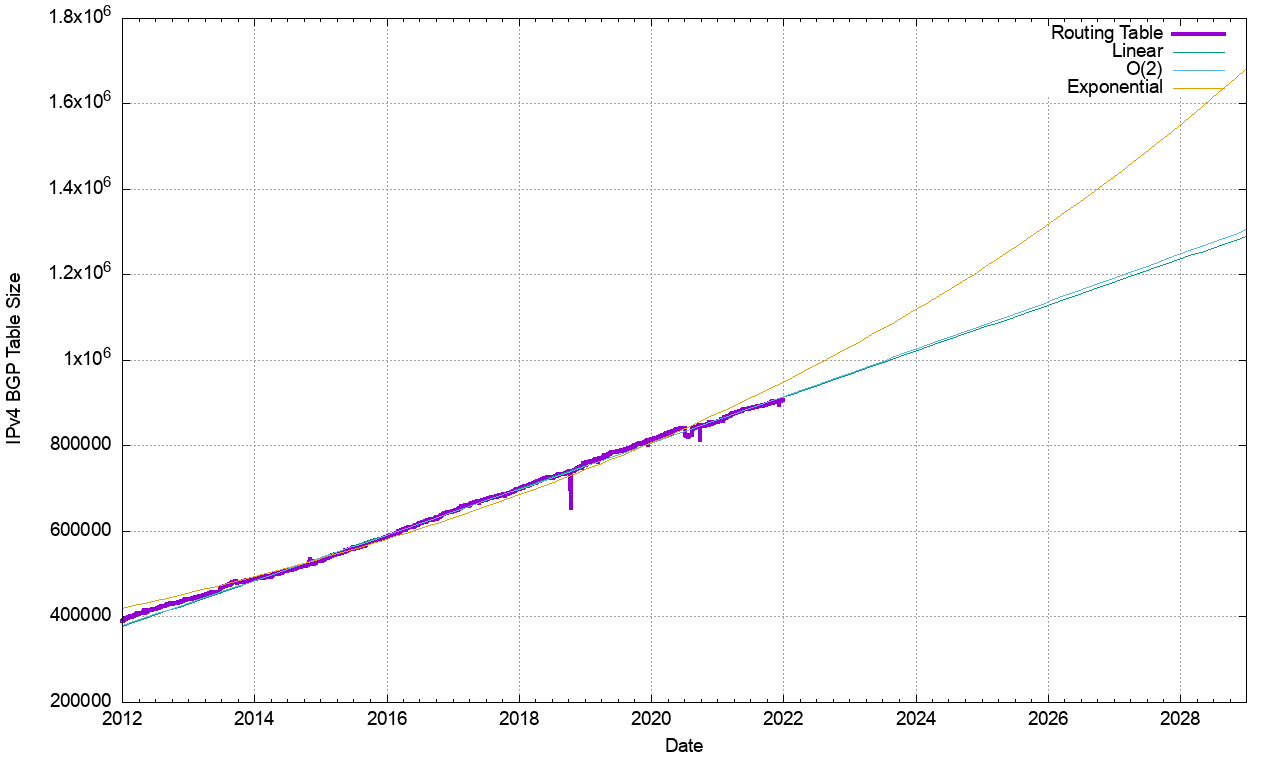
Figure 27 – IPv4 BGP Table 2012 – 2022
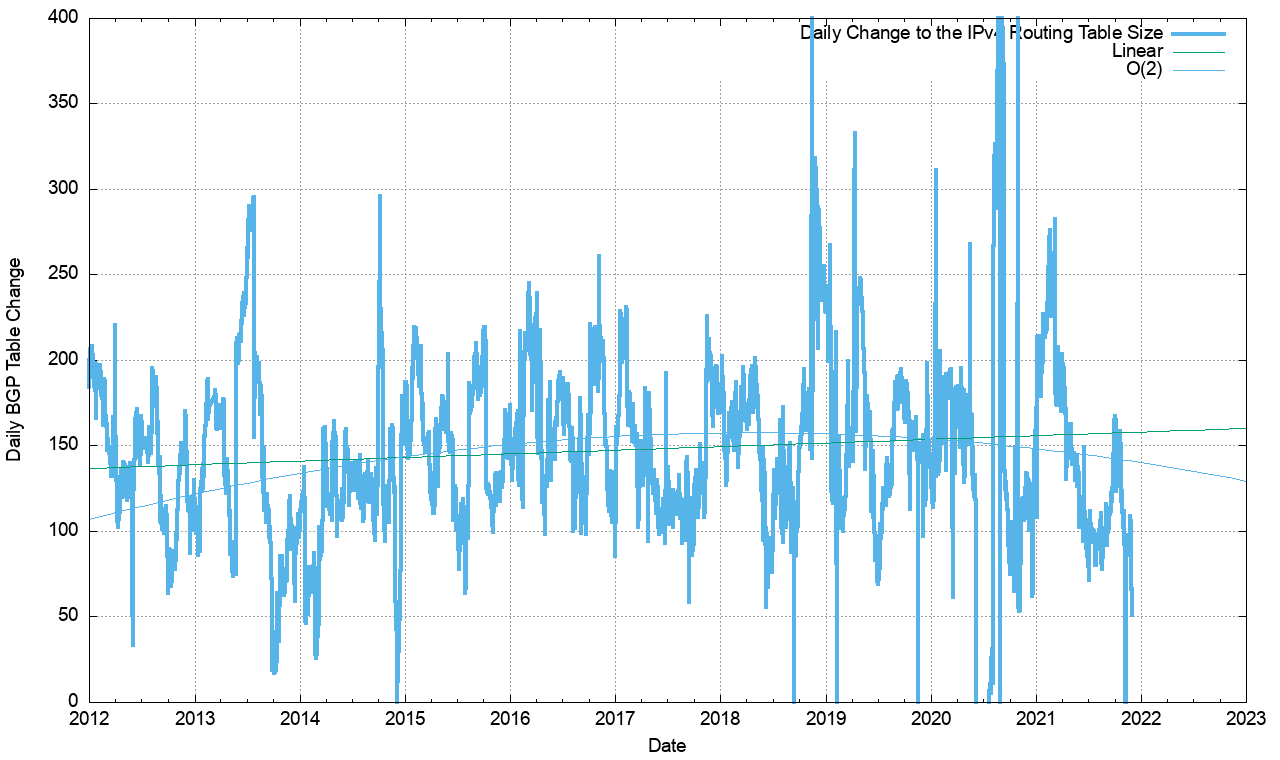
Figure 28 -First Order Differential of Smoothed IPv4 BGP Table Size – 2012 – 2021
However, the data since mid-2020 in Figure 28 suggests a different trend, where the growth rate is declining to around 100 new entries per day. What is the change to these projections if we use just the most recent 24 months to generate a prediction model for the IPv4 routing table size? This is shown in Figure 29.
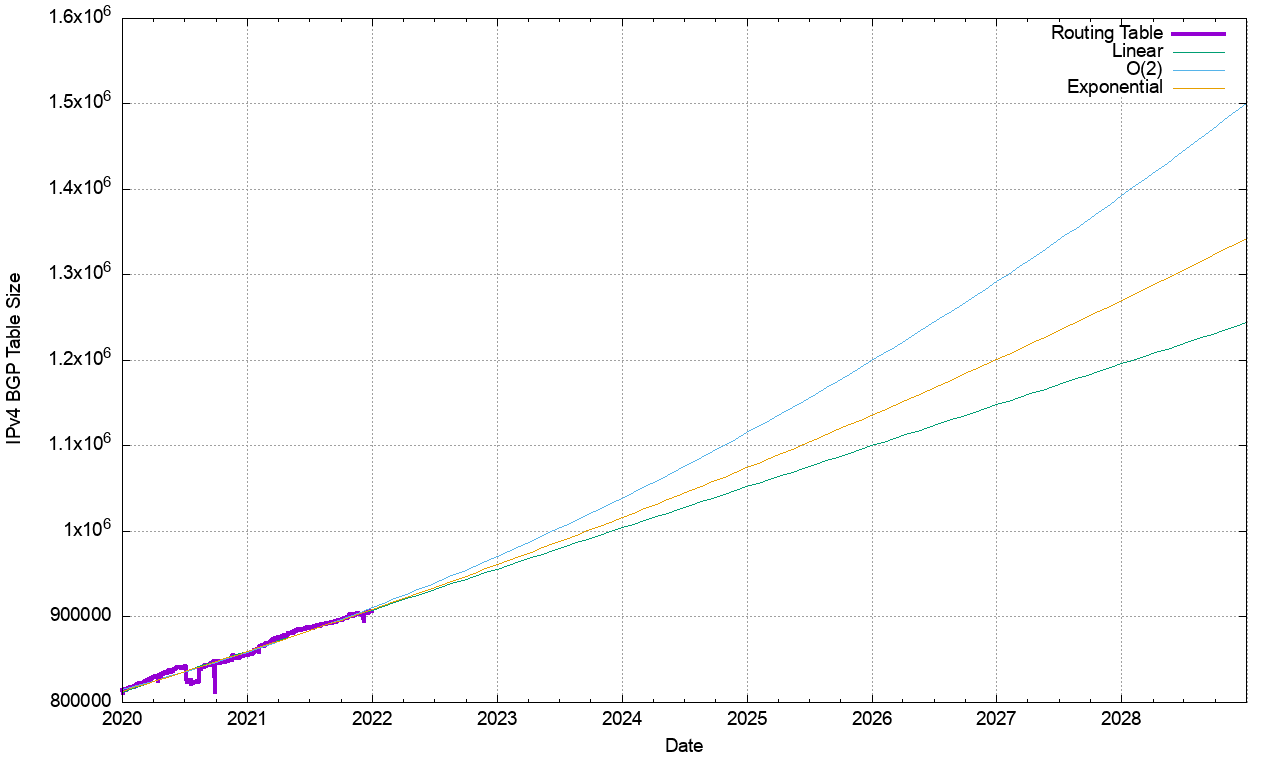
Figure 29 – IPv4 BGP Table 2020 – 2022
The predicted outcomes are not that much different. The 10-year linear growth model predicts a BGP table size of some 1,236,000 entries at the start of 2028, while the 2-year model predicts a size of 1,196,000 entries. I’d be tempted to ascribe a greater probability to this smaller prediction model, but it is extremely hard to take the rather anomalous conditions of the past two years and use it as a stable predictor for the next five years! However, also in favour of a smaller prediction is the increasing level of deployment of IPv6 and the influence the Happy Eyeballs preference for IPv6 connections has on the pressure for IPv4 addresses in Carrier Grade NATs. There is also the simultaneous factor of cloud providers to deploying points of presence inside the larger access networks, inside their CGN. This also acts to relieve the pressures on IPv4 address use in large access networks.
With the caveat that this prediction assumes that tomorrow will be a lot like today and that the influences that shape tomorrow have already shaped today, then it’s reasonable to predict that the IPv4 routing table five years from now, at the start of 2027, will contain an additional 250,000 entries, making a total for IPv4 of some 1,133,000 entries in the BGP IPv4 routing table at that time.
| IPv4 Table | Prediction | |
|---|---|---|
| Jan 2018 | 699,000 | |
| Jan 2019 | 760,000 | |
| Jan 2020 | 814,000 | |
| Jan 2021 | 866,000 | |
| Jan 2022 | 906,000 | 908,000 |
| Jan 2023 | 956,000 | |
| Jan 2024 | 1,004,000 | |
| Jan 2025 | 1,052,000 | |
| Jan 2026 | 1,100,000 | |
| Jan 2027 | 1,148,000 | |
| Jan 2028 | 1,196,000 |
Table 3 – IPv4 BGP Table Size Prediction
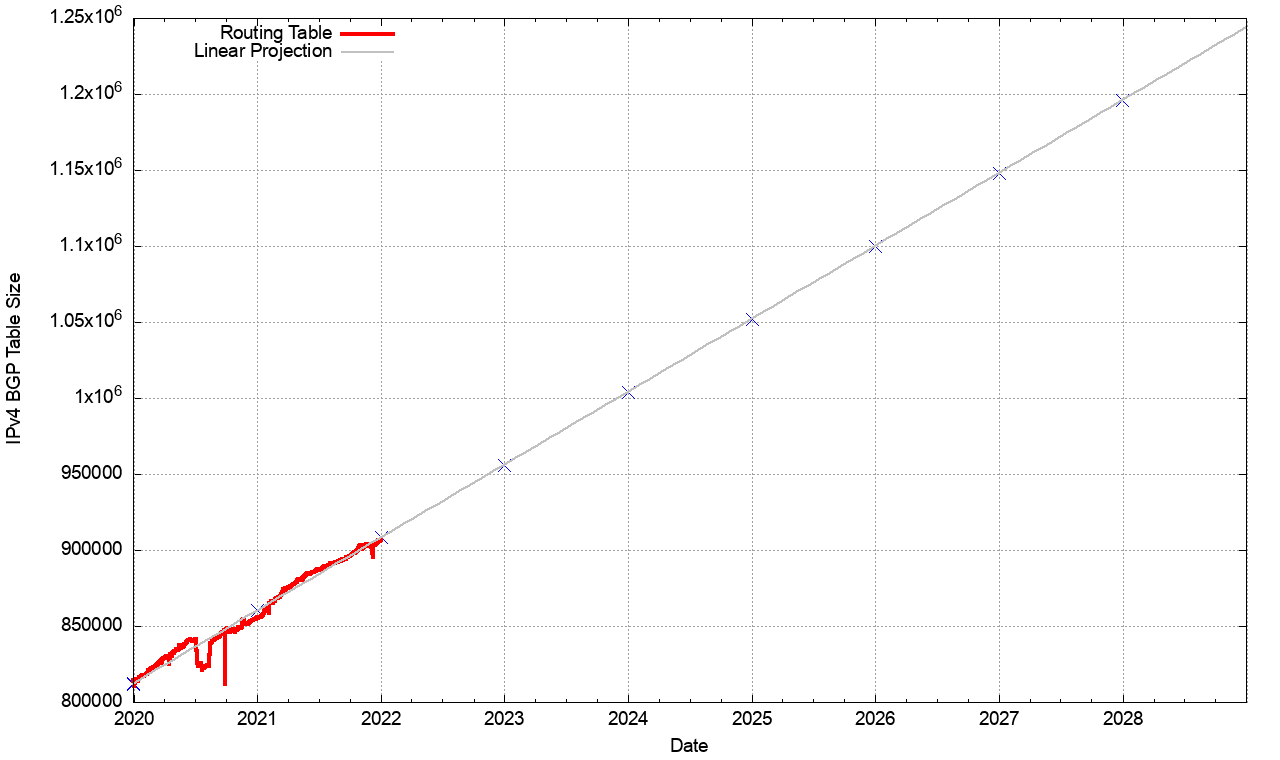
Figure 30 – Linear Prediction of IPv4 Table Growth
It’s difficult to portray this prediction as reasonable under the current circumstances. Given that that last ‘normal’ year of supply of available IPv4 address to fuel continued growth in the IPv4 Internet was now over a decade ago in 2010, perhaps the more relevant question is: why has the growth of the IPv4 routing table persisted with such regularity?
It should be remembered that a dual stack Internet is not the objective in this time of transitioning the Internet to IPv6. The ultimate objective of the entire transition process is to support an IPv6-only network. An important part of the process is the protocol negotiation strategy used by dual stack applications, where IPv6 is the preferred protocol wherever reasonably possible. In a world of ubiquitous dual stack deployment all applications will prefer to use IPv6, and the expectation is that in such a world the use of IPv4 would rapidly plummet.
The challenge for the past decade or more has been in attempting to predict when in time that tipping point that causes demand for IPv4 to plummet may occur. The assumption behind these predictions, predictions that have been made over the past twenty years, is that such a tipping point is at least five more years in the future from the time of the prediction. This may not be a reasonable assumption, but it’s been our informal working mode of operation through this period.
Forecasting the IPv6 BGP Table
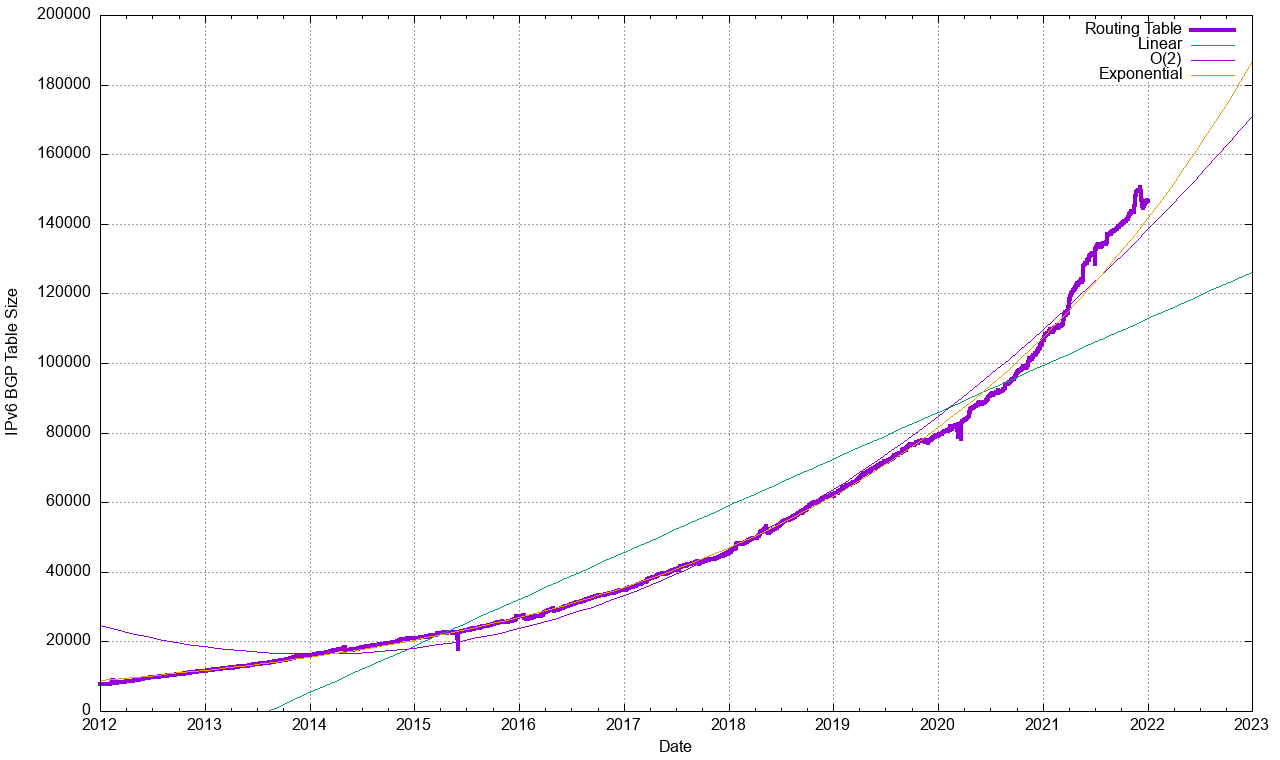
The same technique can be used for the IPv6 routing table. Figure 31 shows the data set for BGP from January 2012 until December 2021.
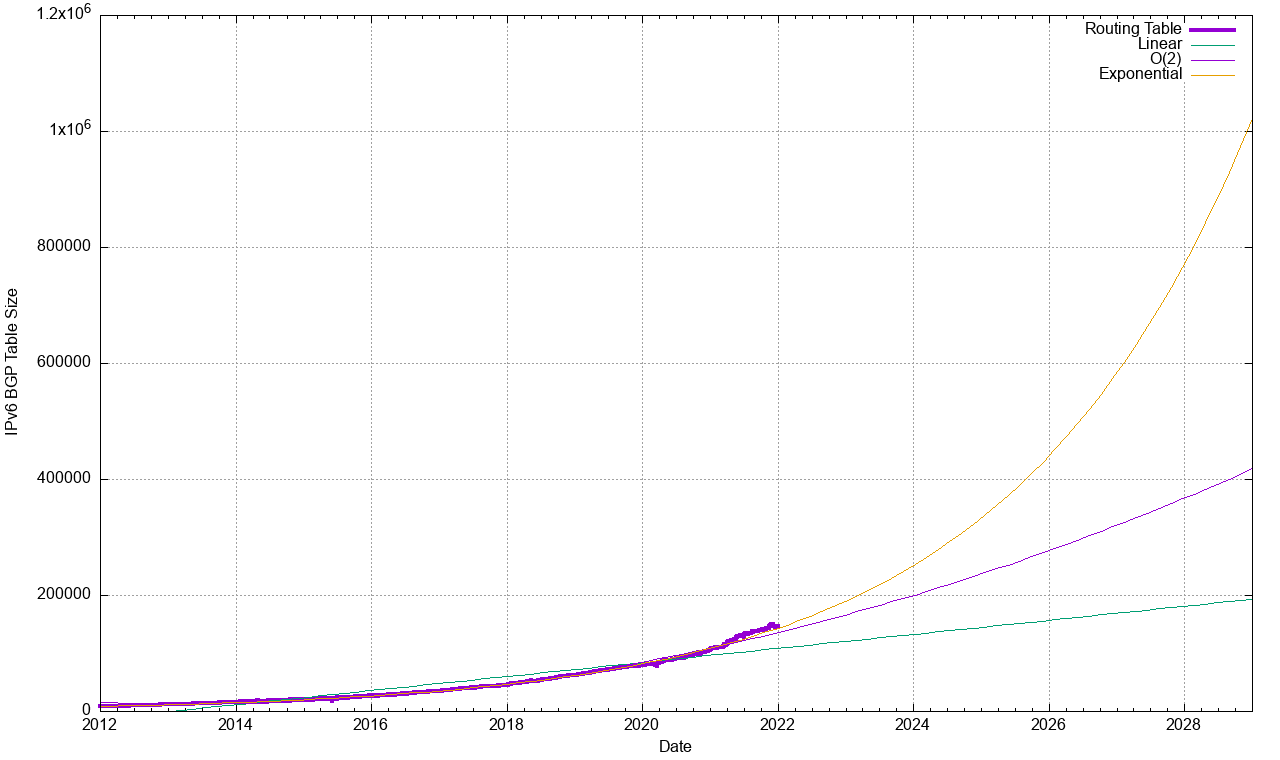
Figure 31 – IPv6 BGP Table Size from January 2012
The first order differential, or the rate of growth of the IPv6 BGP routing table is shown in Figure 32. The number of additional routing entries has grown from 10 new entries per day at the start of 2012 to a peak of some 230 new entries per day in May 2021.
While the data from 2020 illustrated a steady increase in the daily rate from 50 new entries per day at the start of 2020 to approaching 150 new entries at the end of 2020, the data for 2021 is not consistent through the year. The first half of 2021 had periods of sustained growth of between 150 to 200 new entries per day, while the data for the second half of 2021 shows a more modest growth rate of between 70 to 100 new entries per day (Figure 32).
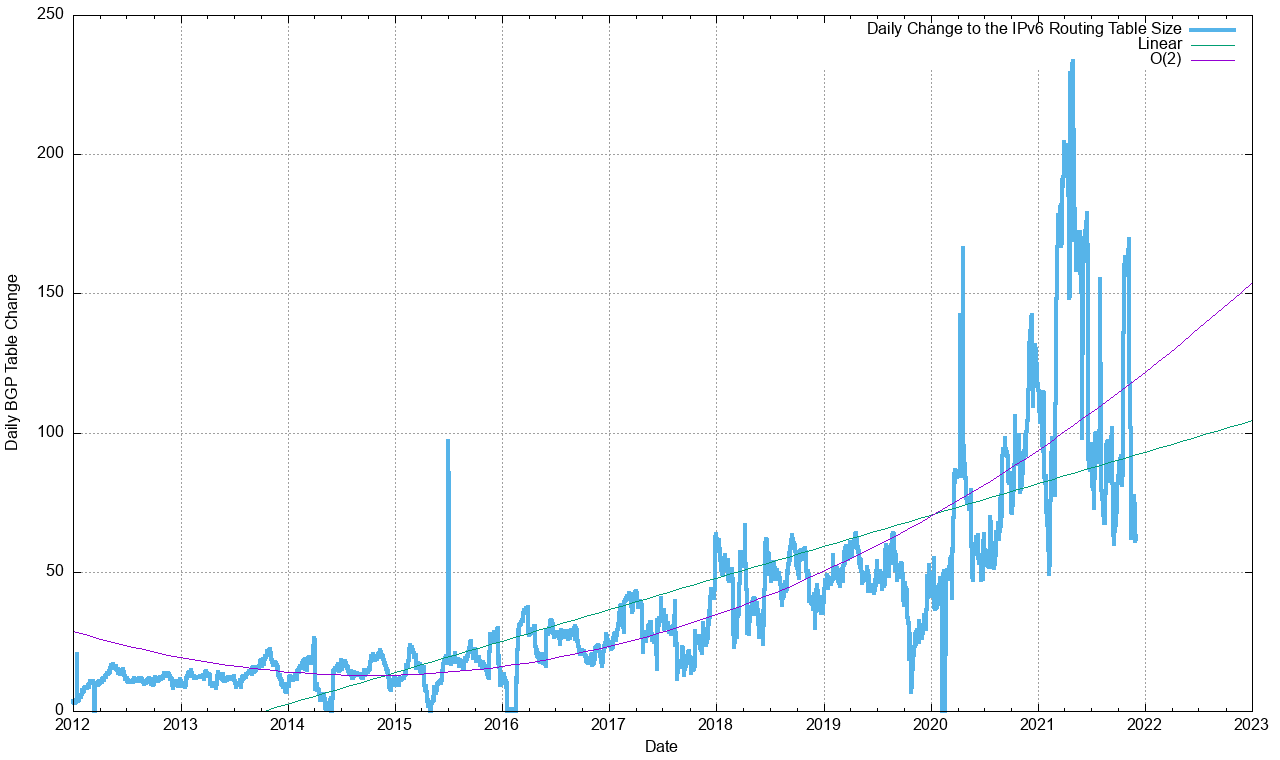
Figure 32 -First Order Differential of IPv6 BGP Table Size
This implies that a linear growth model is inappropriate for modelling growth in IPv6. A better fit to the data is a compound growth model, with a doubling factor of some 24 months. The fit of a linear projection and an exponential model of projected IPv6 table size is shown in Figure 33.
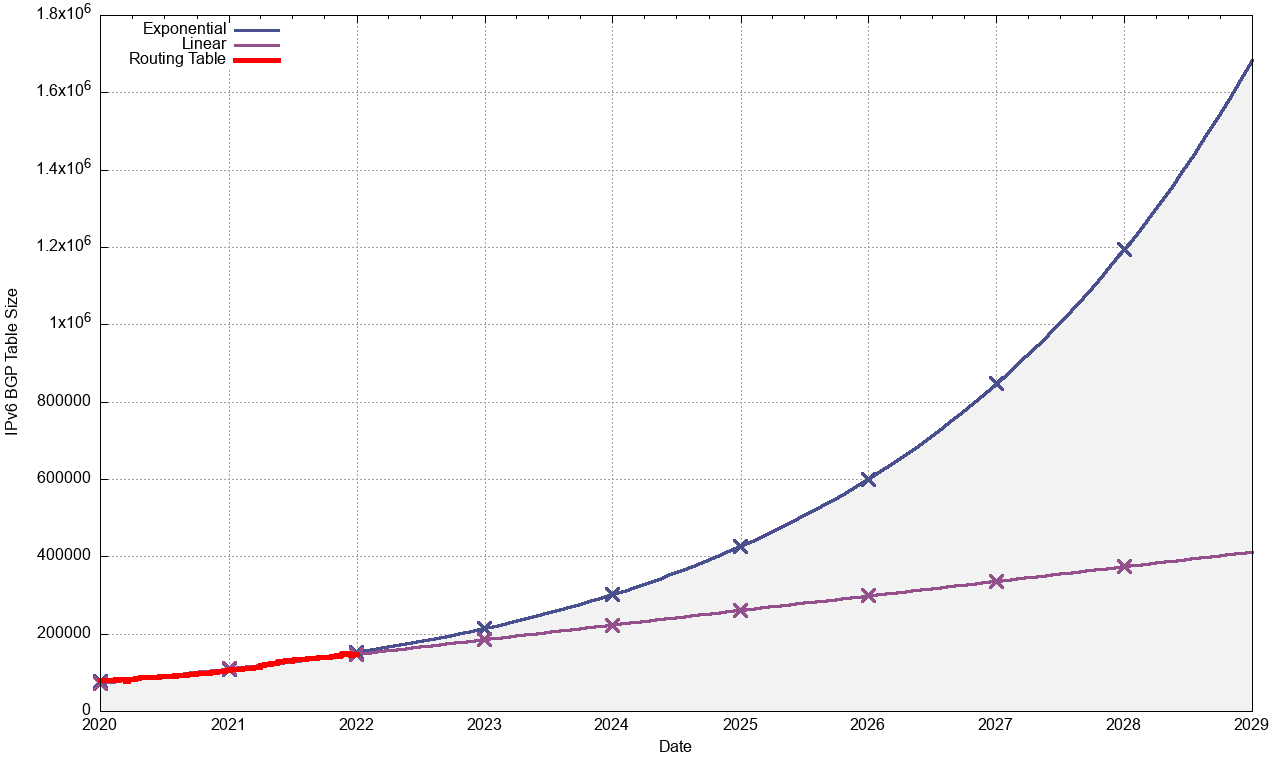
Figure 33 -Projections of IPv6 BGP Table Size
The projections for the IPv6 table size are shown in Table 4.
| IPv6 Table | IPv6 Prediction | ||
|---|---|---|---|
| Linear | Exponential | ||
| Jan 2018 | 45,000 | ||
| Jan 2019 | 62,000 | ||
| Jan 2020 | 79,000 | ||
| Jan 2021 | 104,000 | ||
| Jan 2022 | 147,000 | 148,000 | 152,000 |
| Jan 2023 | 185,000 | 214,000 | |
| Jan 2024 | 233,000 | 302,000 | |
| Jan 2025 | 261,000 | 426,000 | |
| Jan 2026 | 299,000 | 601,000 | |
| Jan 2027 | 366,000 | 847,000 | |
| Jan 2028 | 374,000 | 1,194,000 | |
Table 4 – IPv6 BGP Table Size Prediction
The linear and exponential projections in Table 4 provide a reasonable estimate of the low and high bounds of the growth of the IPv6 BGP routing table in the coming years.
If IPv6 continues to grow exponentially over the next five years, doubling every 2 years, then the size of the IPv6 routing table will be a little over one million entries at the start of 2028. This will be comparable to the projected size of the IPv4 routing table by this time. In hardware terms, an IPv6 address prefix entry takes four times the memory of an IPv4 prefix, so the memory demands of the IPv6 forwarding table will be four times the size of the stored IPv4 routing table at that point.
Conclusion
These predictions for the routing system are highly uncertain. The correlation between network deployments and routing advertisements has been disrupted by the hiatus in supply of IPv4 addresses, causing more recent deployments to make extensive use of various forms of address sharing technologies, and making fundamental alterations to the architecture of the service model of the Internet.
While a number of access providers and service platforms have made significant progress in public IPv6 deployments for their respective customers, the majority of the Internet user base (some two thirds of the Internet’s user base) is still exclusively using IPv4 as of the end of 2021 (Figure 34).
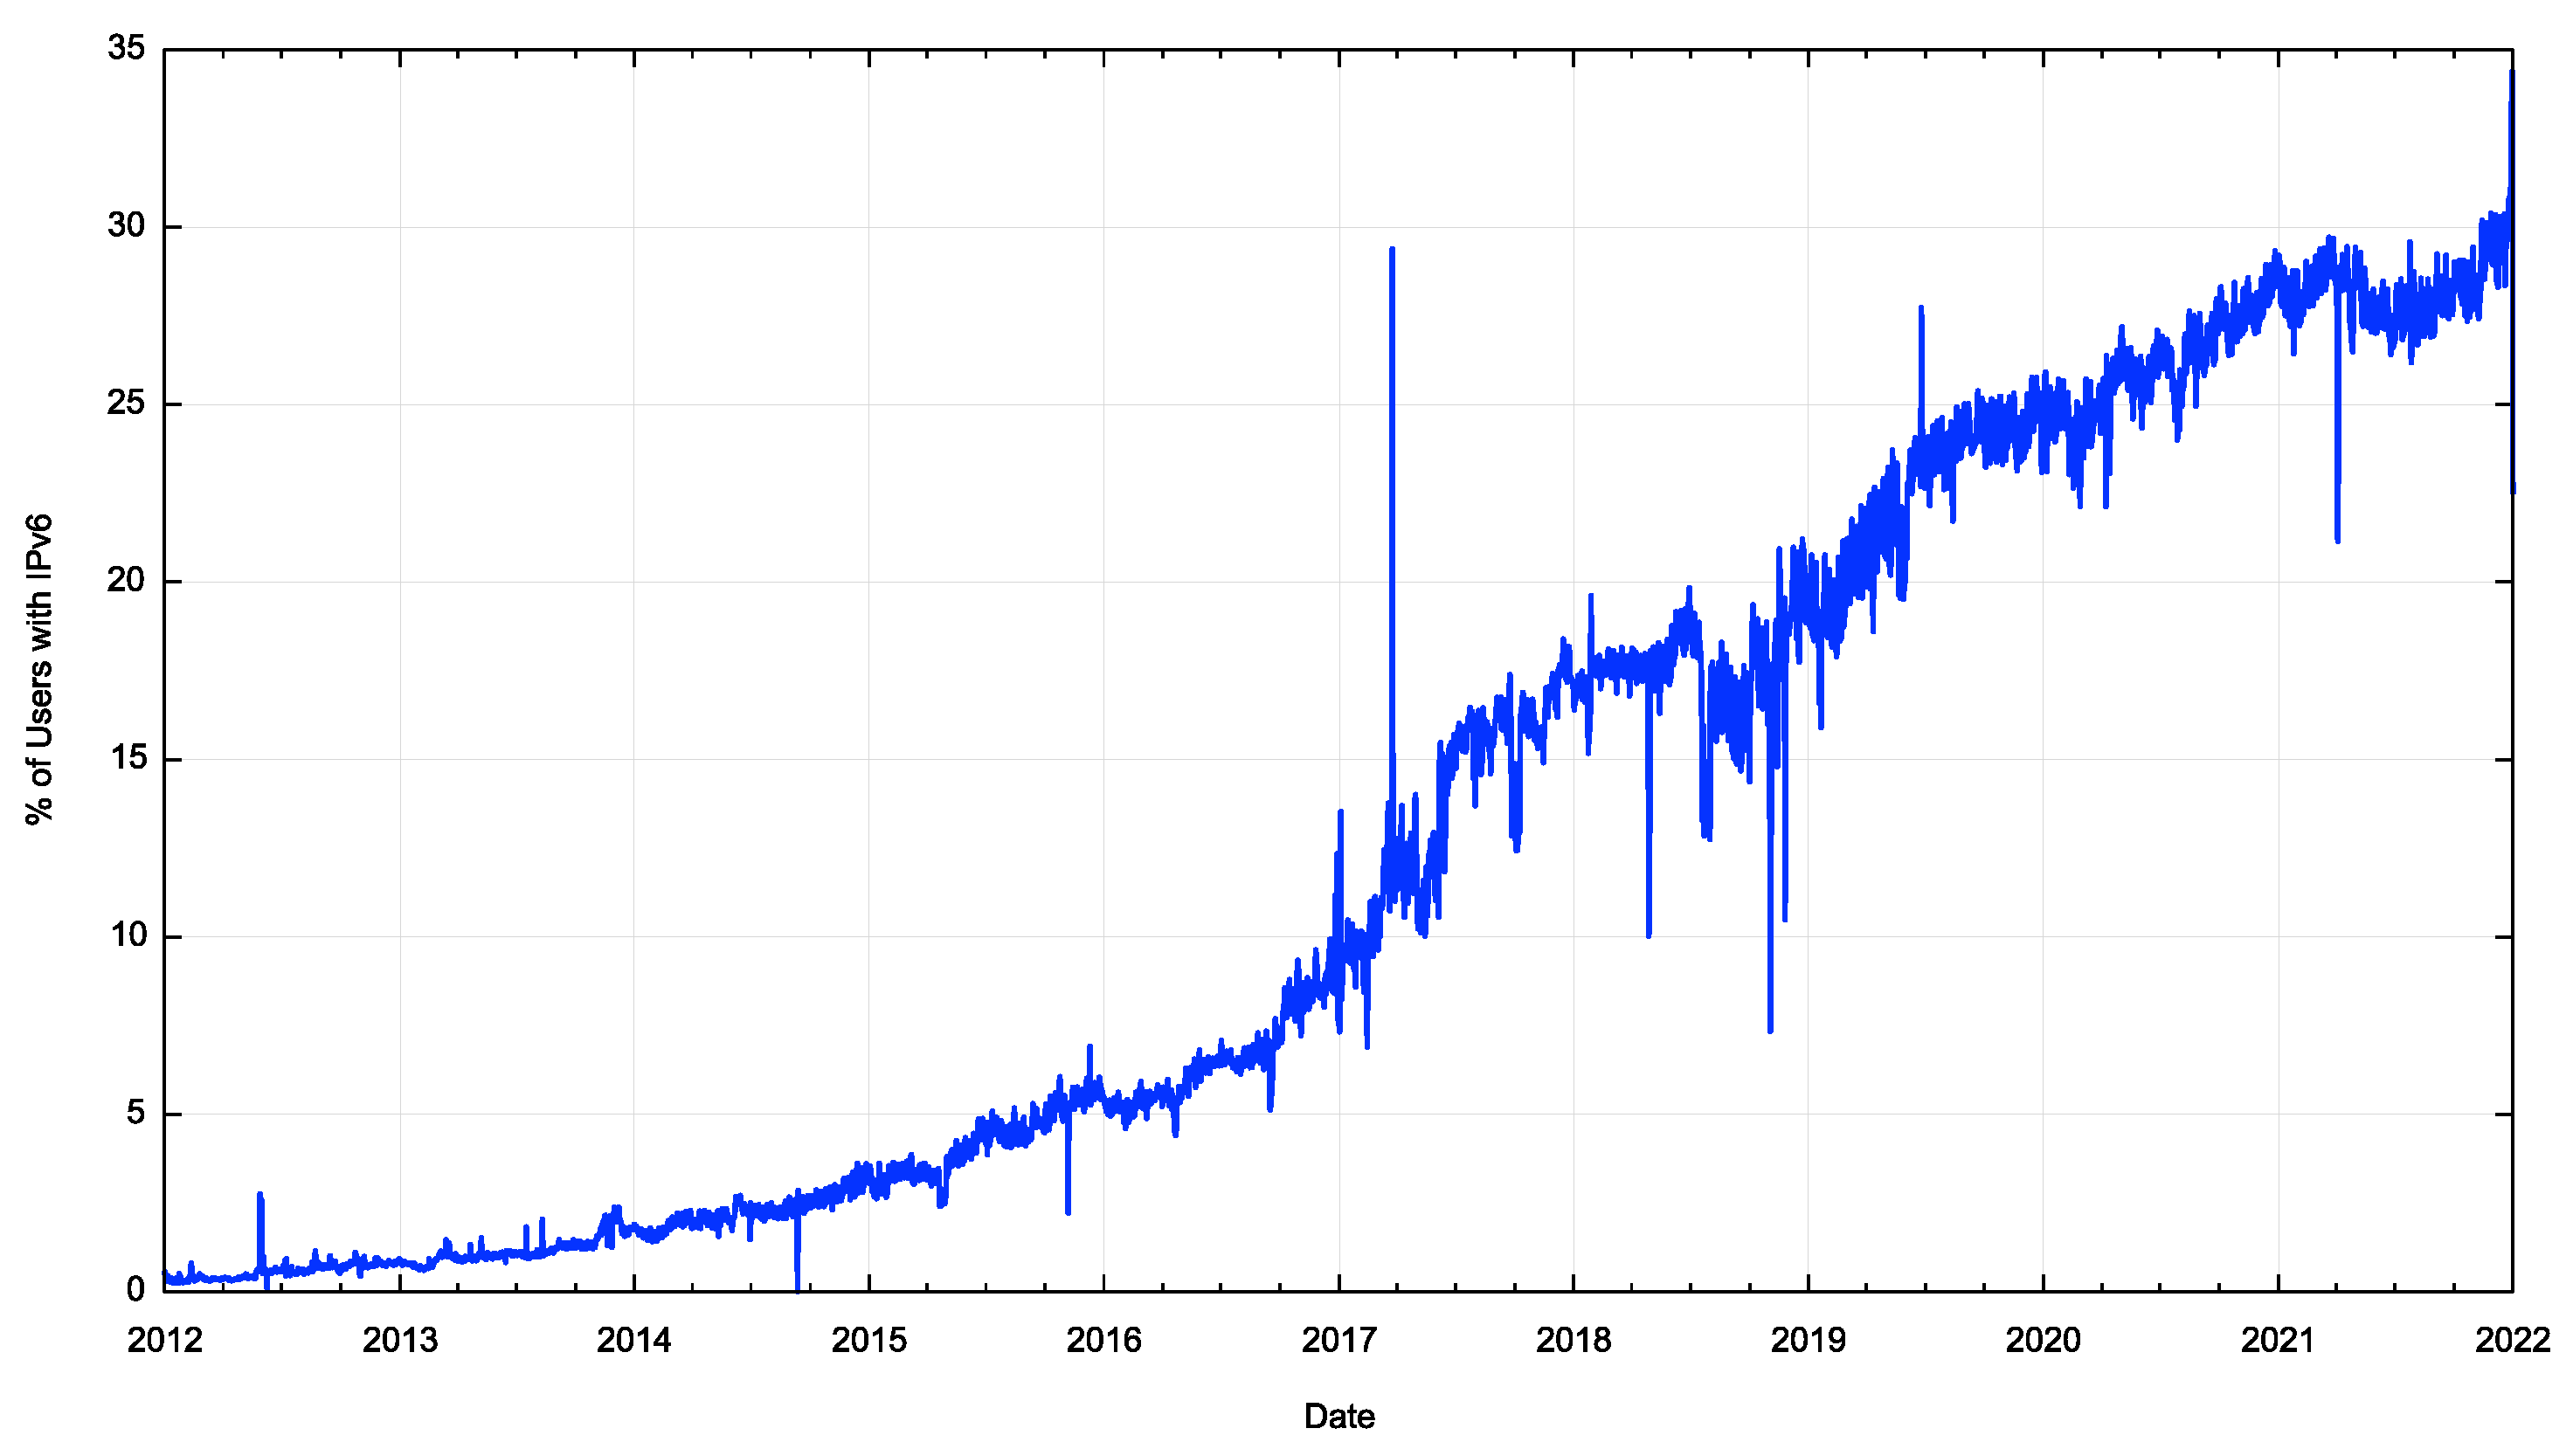
Figure 34 -IPv6 Deployment 2012 – 2021
The predictions as to the future profile of the routing environment for IPv4 and IPv6 that use extrapolation from historical data can only go so far in providing a coherent picture for the near-term future. Despite this uncertainty, nothing in this routing data indicates any serious cause for alarm in the current trends of growth in the routing system. There is no evidence of the imminent collapse of BGP.
None of the BGP metrics that we’ve looked at here indicate that we are seeing such an explosive level of growth in the routing system that it will fundamentally alter the viability of the BGP routing table anytime soon.
However, the size of the inter-domain routing table is only one half of the story. The stability of the routing system is also very important, and to complete this look at the routing system in 2021 we will also need to look at the dynamic behaviour of the routing system. The profile of BGP update churn in 2021 is a topic we’ll look at in detail in the next article.