At the start of each year, I’ve been reporting on the behaviour of the Internet’s inter-domain routing system over the previous 12 months, looking in some detail at some metrics from the routing system that can show the essential shape and behaviour of the underlying interconnection fabric of the Internet.
The year 2023 marks a significant point in the evolution of the Internet where the strong growth numbers that were a constant feature of the past thirty years are simply not present in the data. Not only is the Internet’s growth slowing down significantly, but in the IPv4 network it appears to be shrinking, which is unprecedented in the brief history of the Internet to date. Have we got to the point of market saturation and there is no more demand capacity to fuel further growth? Is the Internet losing its investment appeal along with so many other signals of investor disillusion over outlandish growth predictions in technology-based services? Or has the massive transition into content distribution networks for digital services meant that there is a declining demand for the traditional form of content distribution over on-demand network access?
Let’s take a look at the BGP view of 2023 and see how these larger technical and economic considerations are reflected in the behaviour of the Internet’s inter-domain routing system.
One reason why we are interested in the behaviour of the routing system is that at its heart the routing system has no natural self-constraint. Our collective unease about routing relates to a potential scenario where every network decides to disaggregate their prefixes and announce only the most specific prefixes, or where every network applies routing configurations that are inherently unstable, and the routing system rapidly reverts into oscillating between unstable states that generate an overwhelming stream of routing updates into the inter-domain routing space. In such scenarios, the routing protocol we use, the Border Gateway Protocol, or BGP, will not help us by attempting to damp down such behaviour. Indeed, there is a very real prospect that in such scenarios the protocol behaviour of BGP could well amplify the situation!
BGP is an instance of a Bellman-Ford distance vector routing algorithm. This algorithm allows a collection of connected devices (BGP speakers) to each learn the relative topology of the connecting network. The basic approach of this algorithm is very simple: each BGP speaker tells all its other neighbours about what it has learned if the newly learned information alters the local view of the network. This is a lot like a social rumour network, where every individual who hears a new rumour immediately informs all their friends. BGP works in a very similar fashion: each time a neighbour informs a BGP speaker about reachability to an IP address prefix, the BGP speaker compares this new reachability information against its stored knowledge that was gained from previous announcements from other neighbours. If this new information provides a better path to the prefix, then the local speaker moves this prefix and associated next-hop forwarding decision to the local forwarding table and informs all its immediate neighbours of a new path to a prefix, implicitly citing itself as the next hop. In addition, there is a withdrawal mechanism, where a BGP speaker determines that it no longer has a viable path to a given prefix, in which case it announces a “withdrawal” to all its neighbours. When a BGP speaker receives a withdrawal, it stores the withdrawal against this neighbour. If the withdrawn neighbour happened to be the currently preferred next hop for this prefix, then the BGP speaker will examine its per-neighbour data sets to determine which stored announcement represents the best path from those that are still extant. If it can find such an alternative path, it will copy this into its local forwarding table and announce this new preferred path to all its BGP neighbours. If there is no such alternative path, it will announce a withdrawal to its neighbors, indicating that it no longer can reach this prefix.
And that’s the one paragraph summary of BGP.
What could possibly go wrong?
The first metric of interest is the size of the routing tables. Each router needs to store a local database of all prefixes announced by each routing peer. In addition, conventional routing design places a complete set of “best” paths into each line card and performs a lookup into this forwarding data structure for each packet. This represents an extremely challenging silicon design problem. The larger the routing search space, the more challenging the problem!
Why does memory size matter for a router?
If you look at the internals of a high-speed Internet router operating the default-free zone of the Internet one of the more critical performance aspects of the unit is to make a forwarding decision for each packet within the mean inter-packet arrival time, and preferably within the inter-arrival time of minimum-sized IP packets.
A router line card with an aggregate line rate across all of its serial interfaces of some 10Tbps (which is probably not a large capacity by today’s standards) needs to process each packet within 70 nanoseconds, assuming that the average packet size is 900 octets). If the average memory access cycle time is 10ns then this implies that the router line card processor needs to scan the entire decision space within just 7 memory access operations just to keep pace with the anticipated peak packet rate. A densely packed binary tree with 1M entries will require an average of 20 decisions when using conventional serial binary decision logic, so it’s clear that some other decision approach is needed here. These very high-speed decision tables are often implemented using content-addressable memory to bypass this serial decision limitation. Ternary content-addressable memory (TCAM) can search its entire contents in a single memory cycle. It’s fast, but it’s also a very expensive component of a high-speed router line card.
TCAM size is what you purchase when you buy the router, so you need to pay attention to not only what you need today, but what you may need over the operational lifetime of the unit. If the router is to be useful in, say, 5 years from now, then you need to deploy units that can maintain their switching performance levels five years from now. That often implies configuring your units with sufficient TCAM memory to contain IPv4 and IPv6 routing tables that are not only adequate for today but are adequate to meet the routing table requirements some years into the future. Getting it wrong means that you’ve spent too much on your switching equipment if you over-provision or are forced to retire the equipment prematurely if you under-provision. What this means is this size question is an important question both to network operators and to designers and vendors of network switching equipment.
There is also the consideration of the overall stability of the system. Processing a routing update requires several lookups into local data structures as well as local processing steps. Each router has a finite capacity to process updates, and once the update rate exceeds this local processing capability, then the router will start to queue up unprocessed updates. In the worst case, the router will start to lag in real-time, so that the information a BGP speaker is propagating reflects a past local topology, not necessarily the current local topology. If this lag continues, then at some point unprocessed updates may be dropped from the queue. BGP has no inherent periodic refresh capability, so when information is dropped, then the router and its neighbours fall out of sync with the network topology. At its most benign, the router will advertise “ghost” routes where the prefix is no longer reachable, yet the out-of-sync router will continue to advertise reachability. At its worst, the router will set up a loop condition and as traffic enters the loop it will continue to circulate through the loop until the packet’s TTL expires. This may cause saturation of the underlying transmission system and trigger further outages which, in turn, may add to the routing load.
The two critical metrics we are interested in are the size of the routing space and its level of updates, or churn. Here we will look at the first of these metrics, the size of the routing space, and the changes that occurred through 2023, and use this data to extrapolate forward and look at 5-year projections for the size of the routing table in both IPv4 and IPv6.
The BGP Measurement Environment
In trying to analyse long baseline data series the ideal approach is to keep as much of the local data gathering environment as stable as possible. In this way, the changes that occur in the collected data reflect changes in the larger environment, as distinct from changes in the local configuration of the data collection equipment.
The measurement point being used here is a BGP speaker configured within AS 131072. This AS generates no traffic and originates no routes in BGP. It’s a passive measurement point that has been logging all received BGP updates since 2007. The router is fed with a default-free eBGP feed from AS 4608, which is the APNIC network located in Australia, and AS 4777, which is the APNIC network located in Japan, for both IPv4 and IPv6 routes.
There is also no internal routing (iBGP) component in this measurement setup. While it has been asserted at various times that iBGP is a major contributor to BGP scalability concerns in BGP, the consideration here in trying to measure this assertion is that there is no “standard” iBGP configuration, as each network has its own rather unique configuration of Route Reflectors and iBGP peers. This makes it hard to generate a “typical” iBGP load profile, let alone analyse the general trends in iBGP update loads over time.
In this study, the scope of attention is limited to a simple eBGP configuration that is likely to be found as a “stub” AS at the edge of the Internet. This AS is not an upstream for any third party, it has no transit role, and does not have a large set of BGP peers. It’s a simple view of the routing world that I see when I sit at an edge of the Internet. Like all BGP views, its unique to this network, and every other network will see a slightly different Internet with different metrics. However, the behaviour seen by this stub network at the edge of the Internet is probably similar to most other stub networks at the edge of the Internet. While the fine details may differ, the overall picture is probably much the same. This BGP view is both unique and typical at the same time.
The IPv4 Routing Table
Measurements of the size of the routing table have been taken regularly since the start of 1988, although regular highly detailed snapshots of the routing system only date back to early 1994. Figure 1 shows a rather unique picture of the size of the routing table, as seen by all the peers of the Route Views route collector on an hourly basis.
I should take a moment to mention the Route Views Project. It was originally intended to offer a multi-perspective real-time view of the inter-domain routing system, allowing network operators to examine the current visibility of route objects from various points in the inter-domain topology. What makes Route Views so unique is that it archives these routing tables every two hours and has done so for more than two decades. It also archives every BGP update message. This vast collection of data is a valuable research data source in its own right, and here we are just taking a tiny slice of this data set to look at longer term routing growth trends.
The folk at the Route Views Project, with the support from the University of Oregon and the US National Science Foundation should be commended for their efforts here. This is a very unique data set if you are interested in the evolution of the Internet over the years.
Several broader events are visible in the history of the routing table, such as the busting of the Internet bubble in 2001, the impact of the global financial crisis in 2009 and the lingering effects of the Covid-related shutdowns in late 2020. What is perhaps surprising is one ongoing event that is not visible in this plot. Since 2011 the supply of IPv4 addresses has been progressively constrained as the free address pools of the various Regional Internet Registries have been exhausted. Yet there is no visible impact on the rate of growth of the number of announced prefixes in the global routing system since 2011. In terms of the size of the routing table it’s as if the exhaustion of IPv4 addresses has not happened at all for the ensuring decade. It is only by 2021 that we see some tapering of the growth of the size of the IPv4 routing table. BGP is not just a reachability protocol. Network operators can manipulate traffic paths using selective advertisement of more specific addresses, allowing BGP to be used as a traffic engineering tool. These more specific advertisements often have a restricted propagation. This is evident in Figure 1, where the BGP routing table counts from both the Route Views peers and the peers of the RIPE NCC’s Routing Information Service (RIS) are combined. There is not a single plot in this figure where each BGP speak sees essentially the same network. There is a variance across the various peers of these route collectors that is around 50,000 routes.
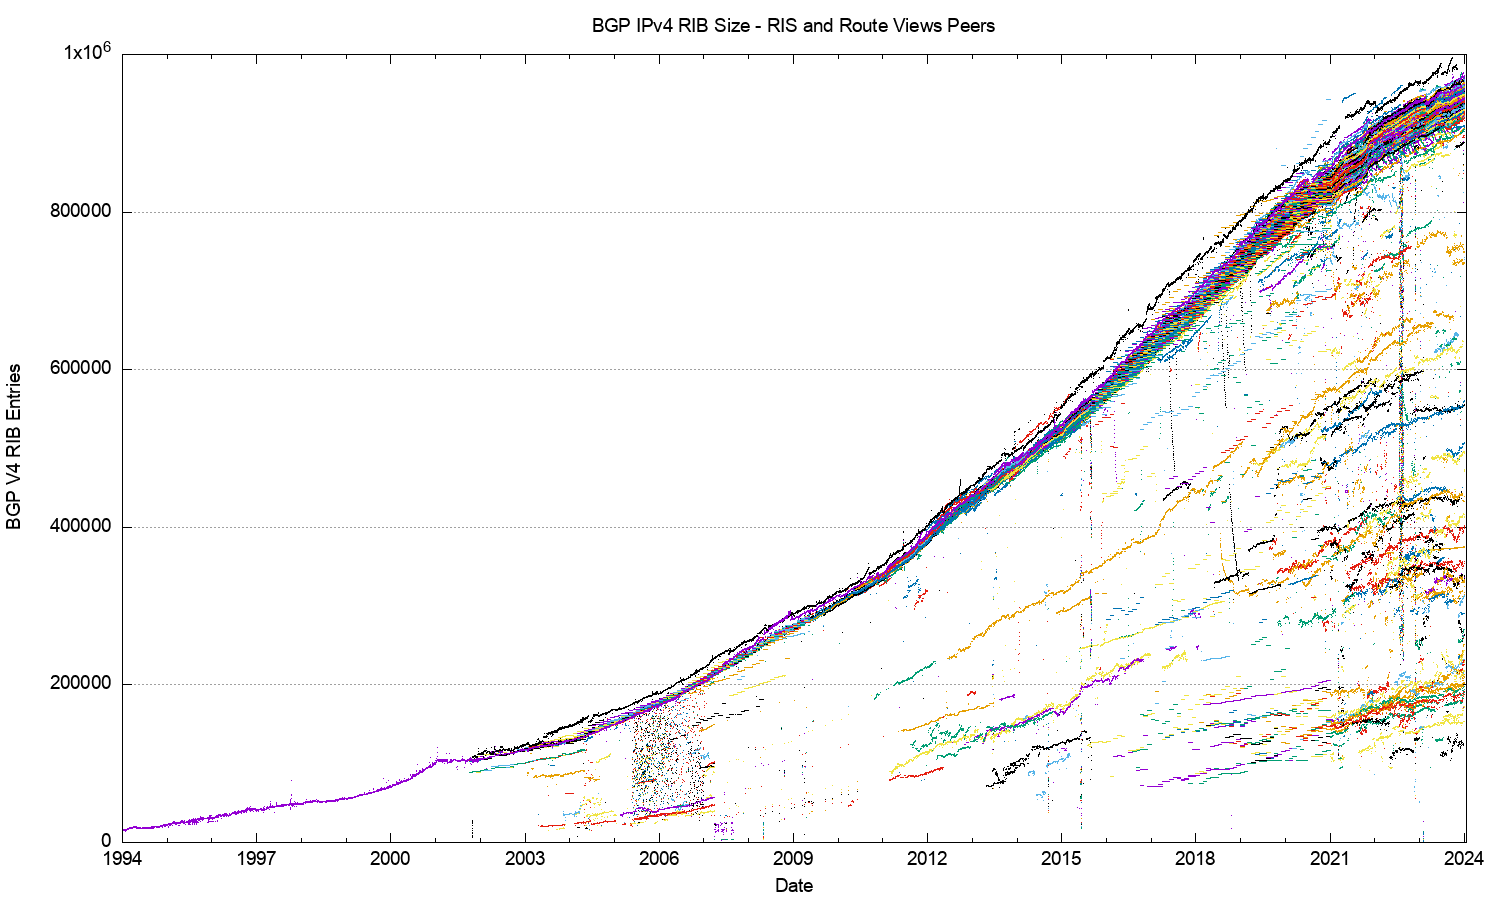
Figure 1 – IPv4 routing table since 1994 as seen by RIS and Route Views peers
We can zoom in to look at just 2023, taking the same collection of RouteViews and RIS BGP peers (Figure 2). The major discontinuity in this period occurred on the 22nd February 2023, where AS 9121 withdrew 5,279 prefixes and AS 47331 withdrew 2,427 prefixes. Both of these networks are operated by Türk Telecom and the withdrawals reflect the withdrawal of more specific routes.
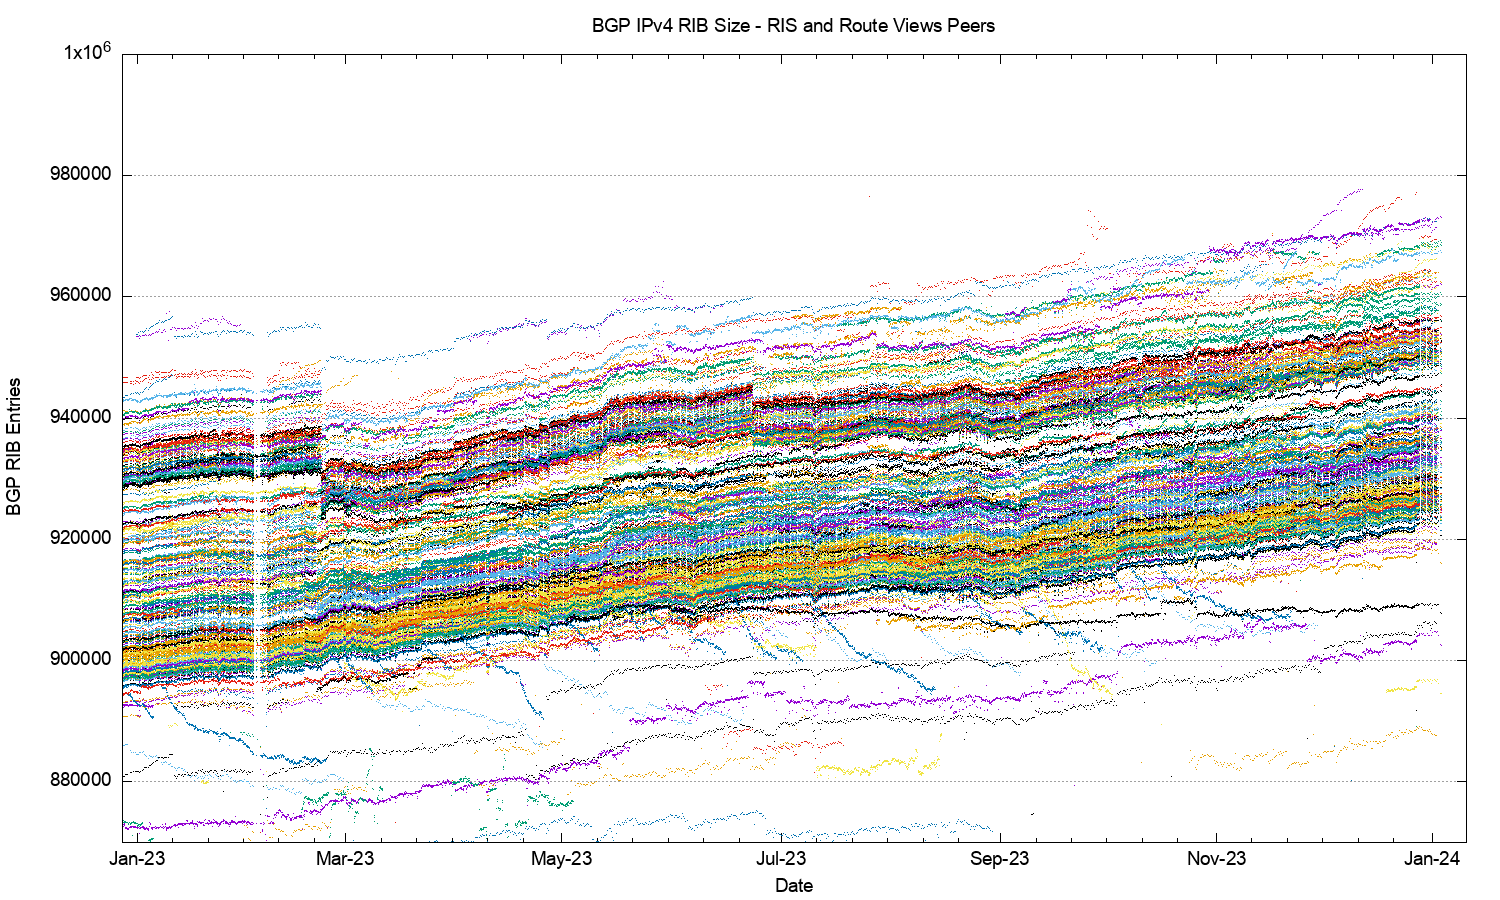
Figure 2 – IPv4 routing table 2019-2024, as seen by Route Views and RIS peers
Both Figures 1 and 2 illustrates an important principle in BGP, that there is no single authoritative view of the Internet’s inter-domain routing table, as all views are relative to the perspective of each BGP speaker. These figures also illustrate that at times the cause of changes in routing is not necessarily a change at the point of origination of the route which would be visible to all BGP speakers across the entire Internet, but it may well be a change in transit arrangements within the interior of the network that may expose, or hide, collections of routes. For example, a change in the number of advertised routes on the 26th June was visible only for around one half of the networks who feed these route collectors.
The issue of the collective management of the routing system can be seen as an example of the condition of the “tragedy of the commons“, where the self-interest of one actor in attempting to minimise its transit service costs becomes an incremental cost in the total routing load that is borne by other actors. To quote the Wikipedia article on this topic “In absence of enlightened self-interest, some form of authority or federation is needed to solve the collective action problem.” This appears to be the case in the behaviour of the routing system, where there is an extensive reliance on enlightened self-interest to be conservative in one’s own announcements.
The next collection of plots (Figures 3 through 12) contains some of the vital characteristics for the IPv4 BGP network since the start of 2016 to the end of 2023, using the routing data collected from AS 131072.
|
|
|
|
|
|
|
|
|
|
|
|
|
|
|
|
|
|
|
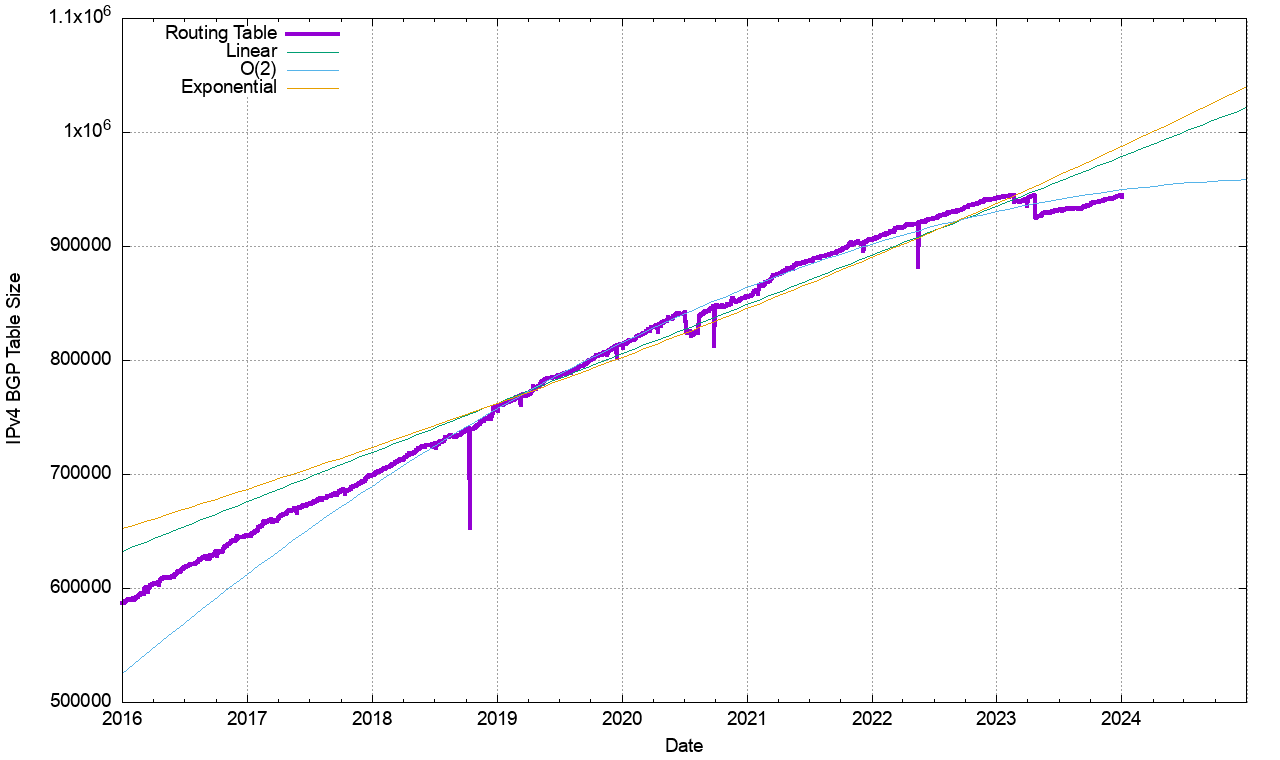
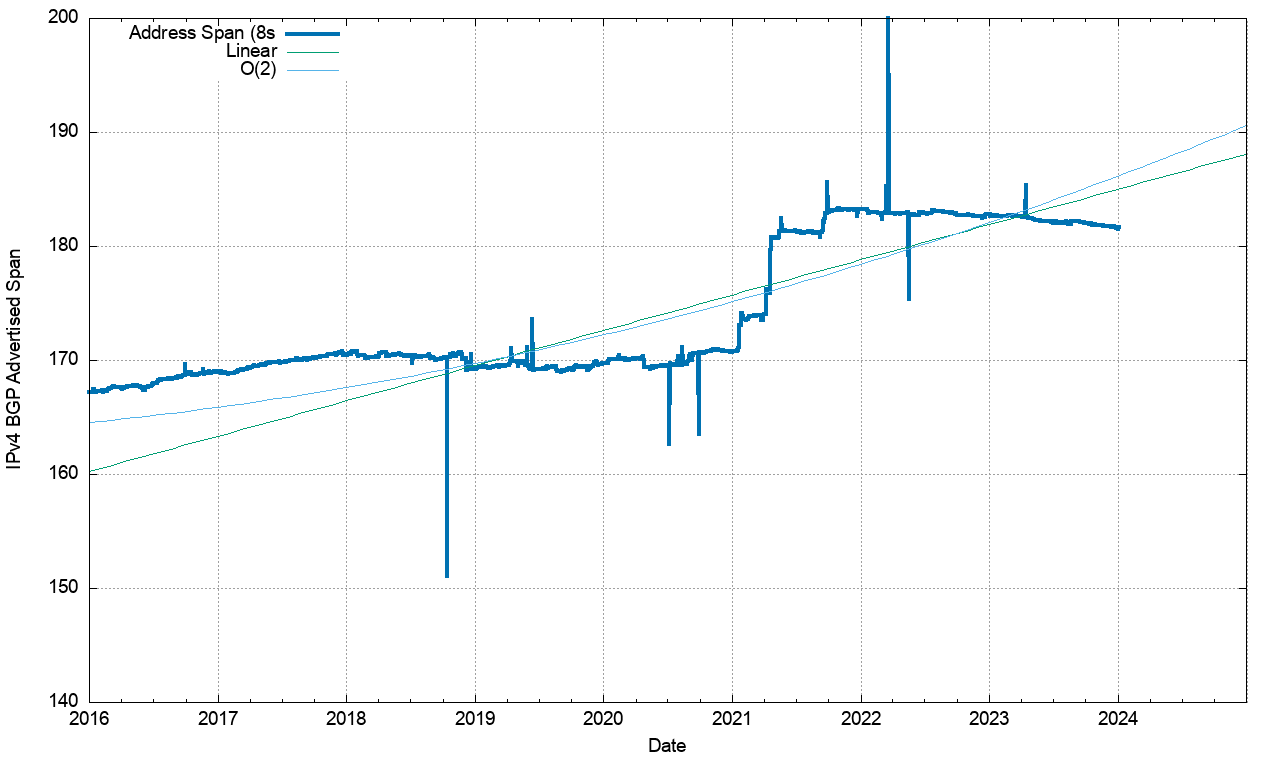
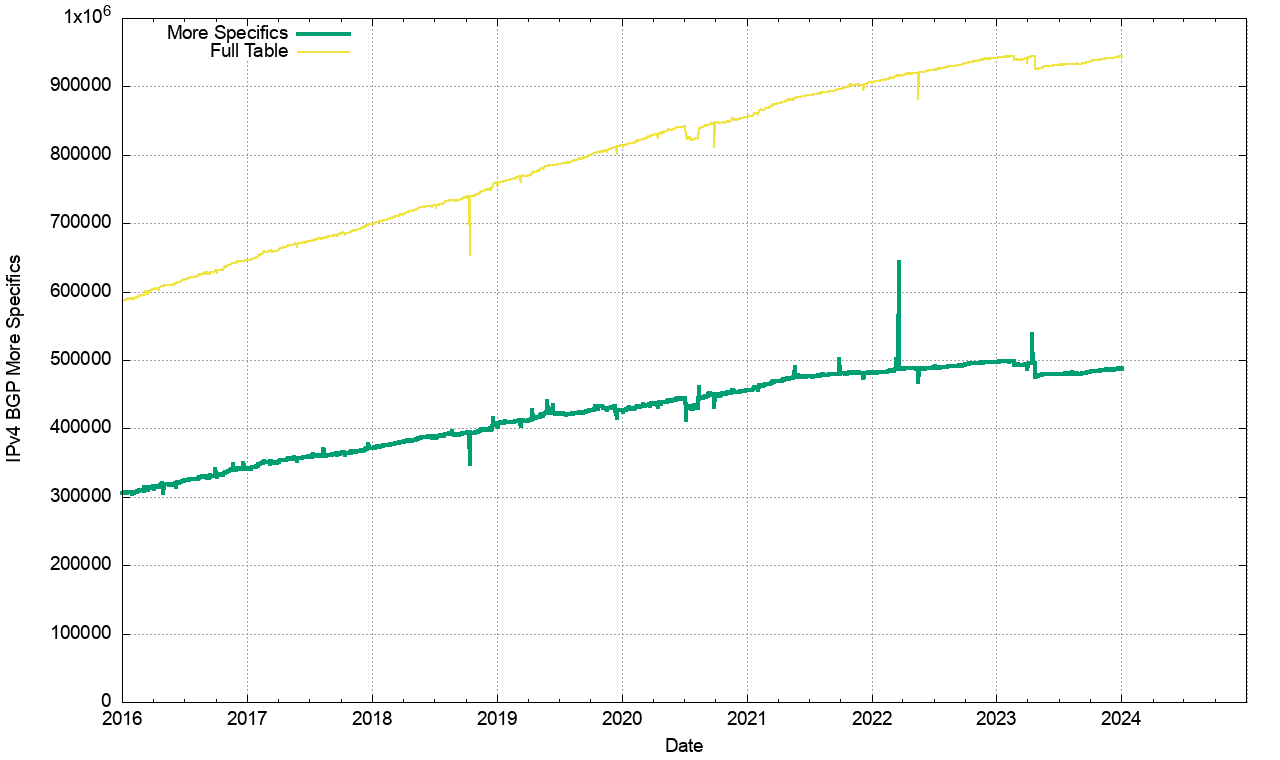
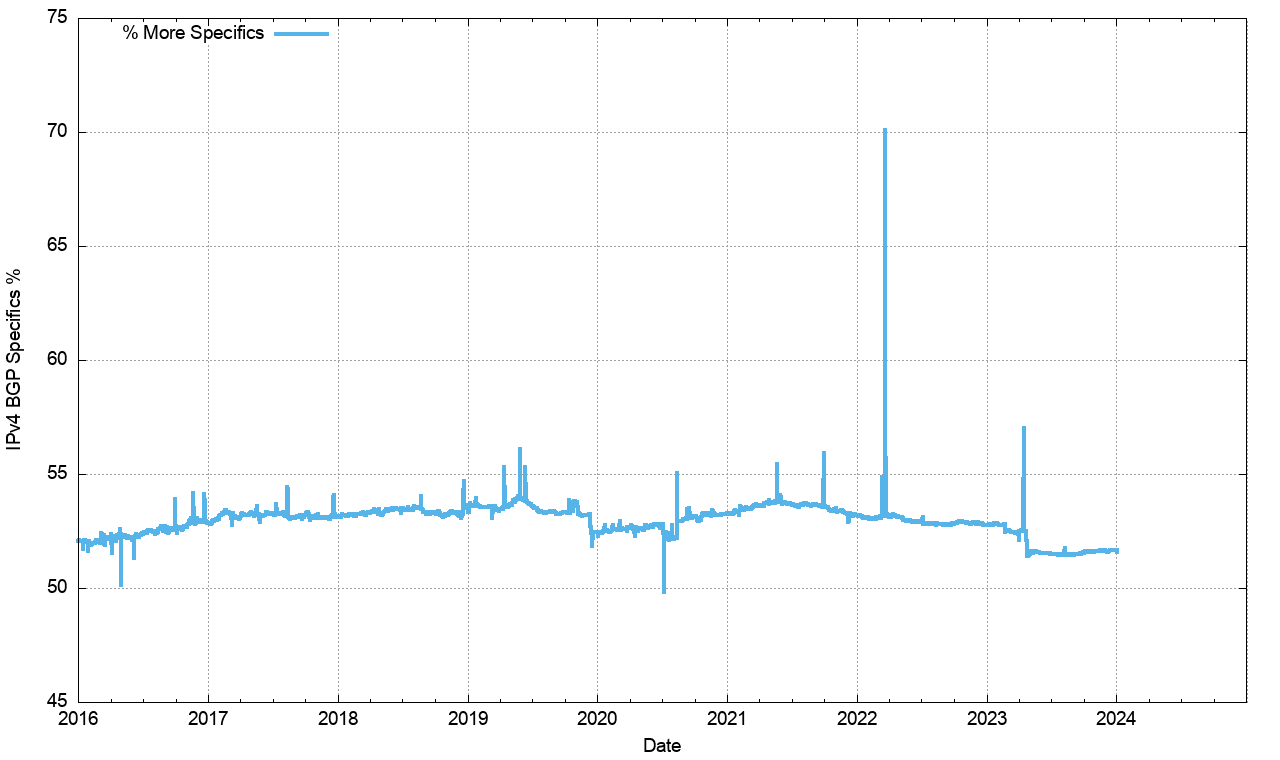
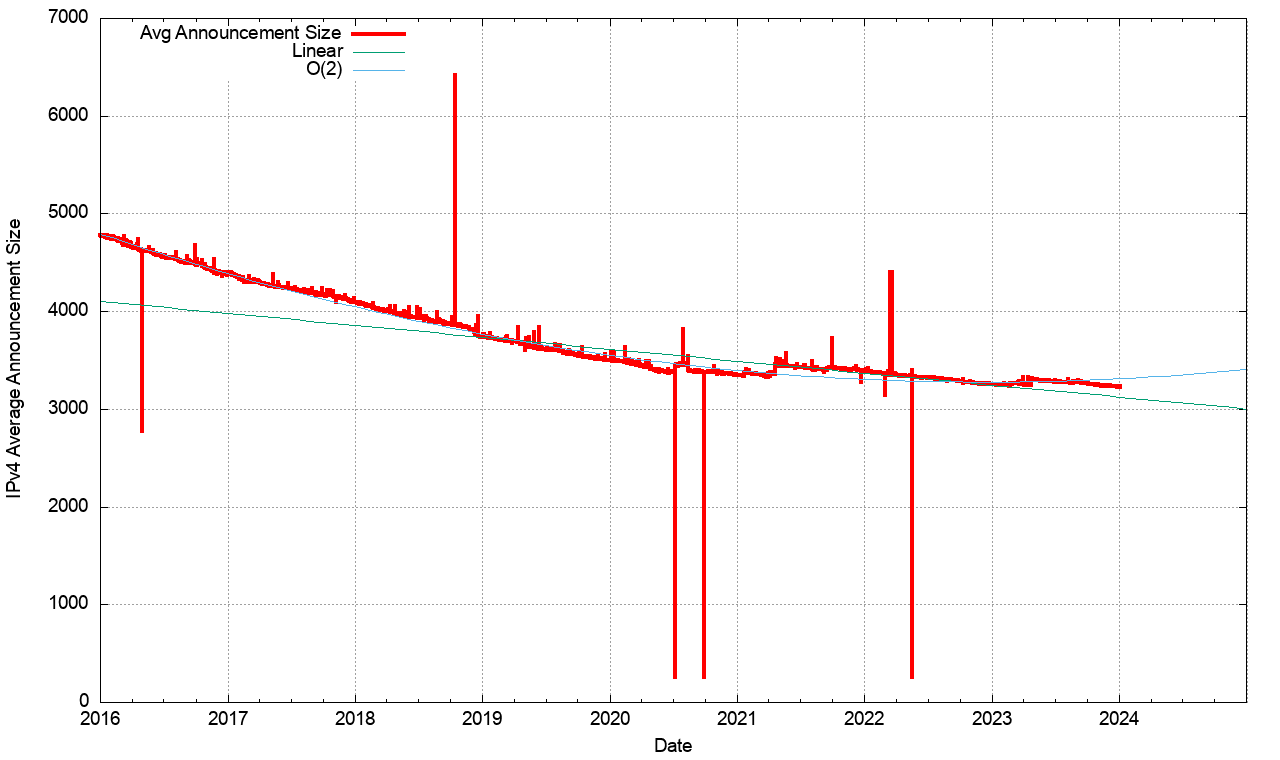
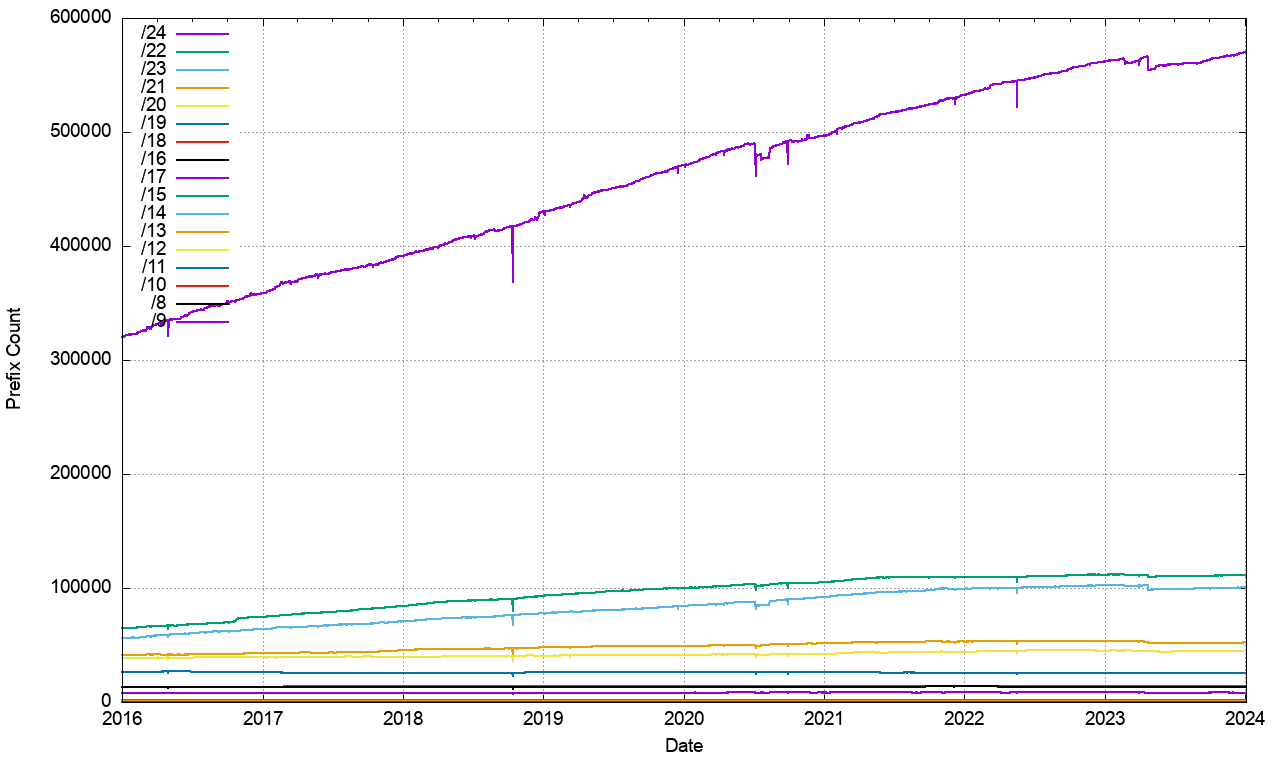
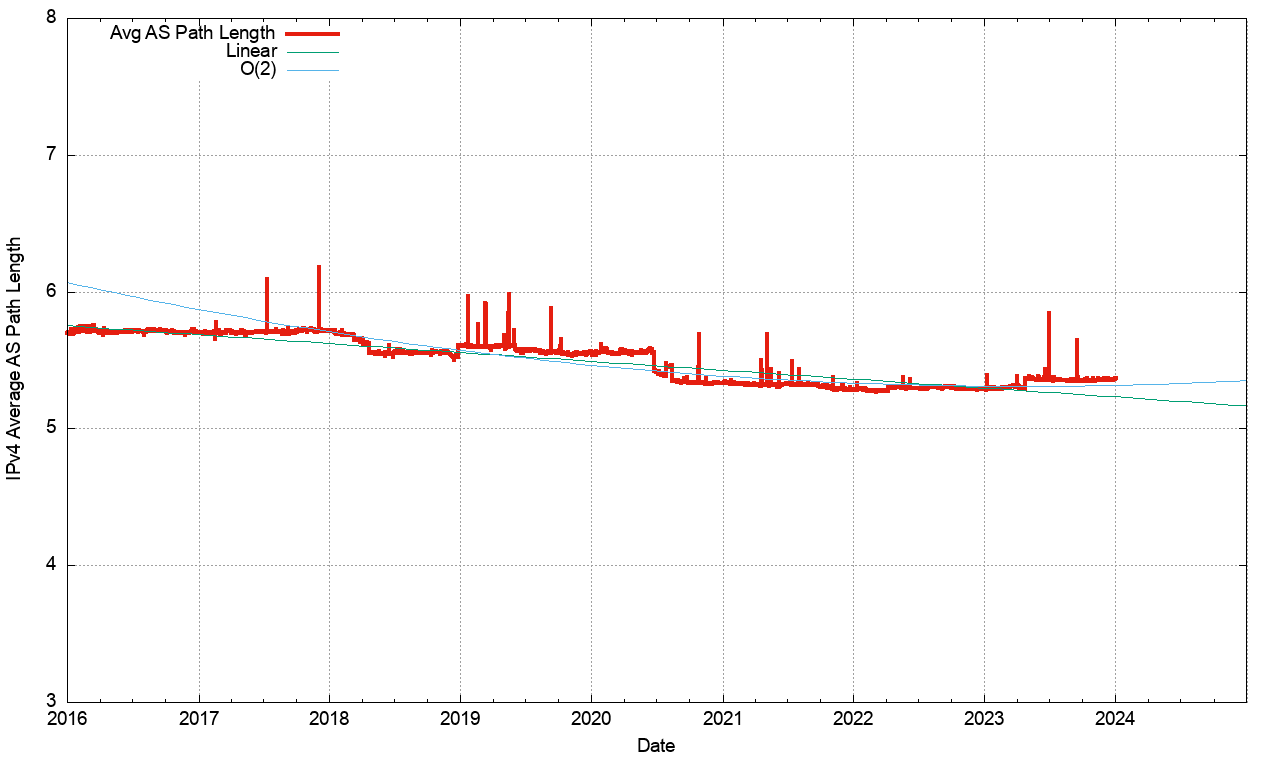
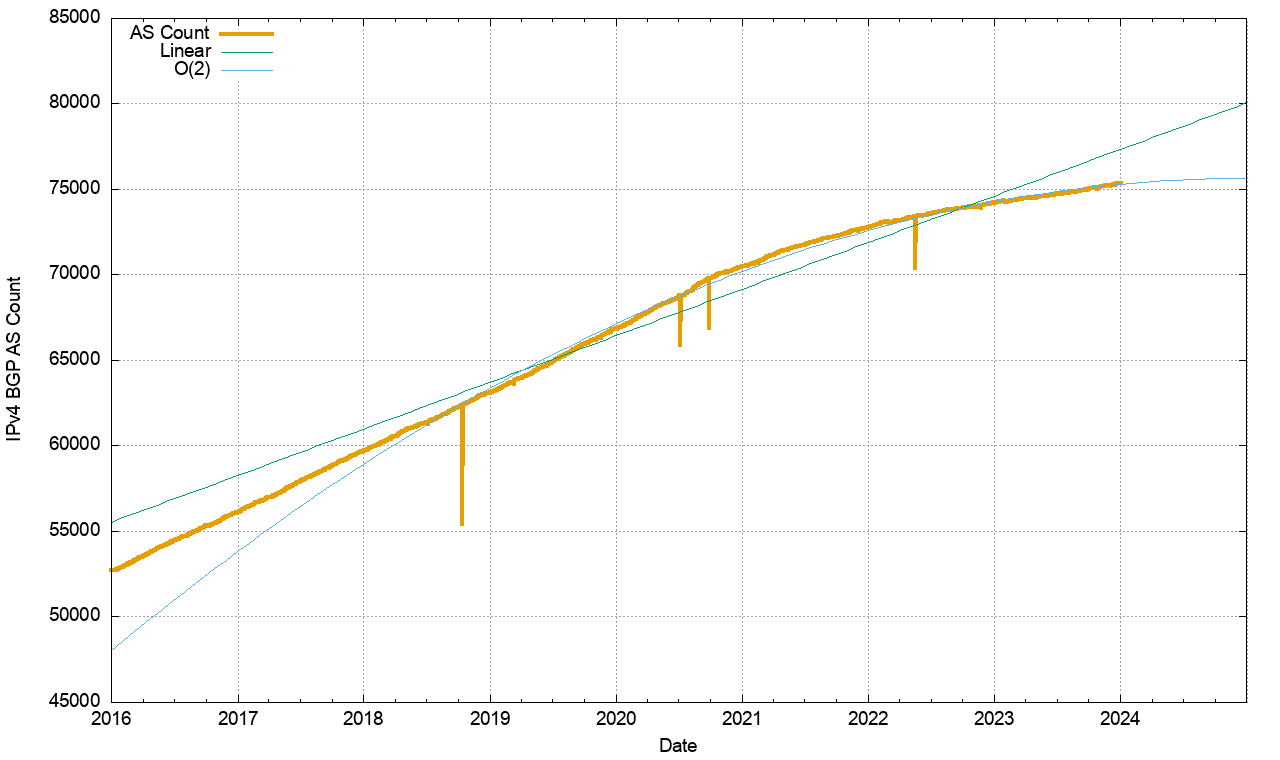
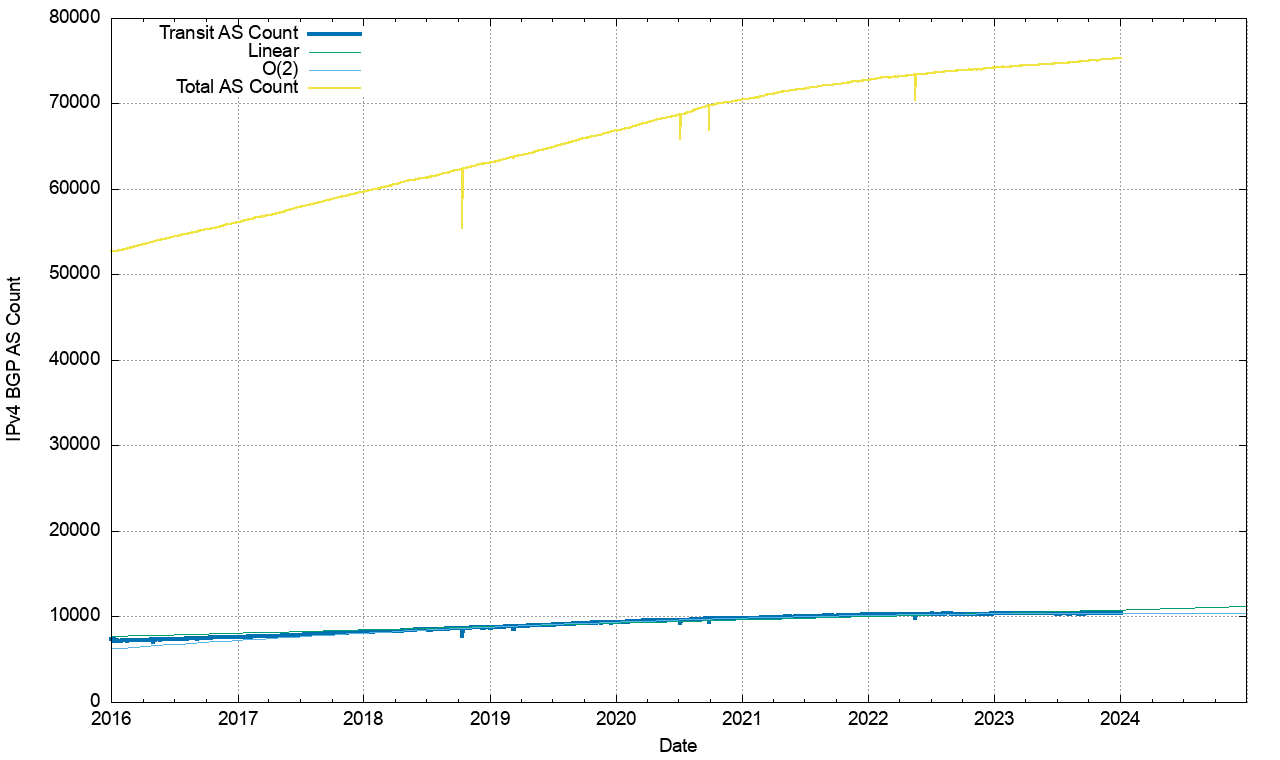
Figure 3 shows the total number of routes in the routing table over this period. This is no longer a classic “up and to the right” Internet trajectory, and there was a significant route withdrawal event early in the year (Withdrawal of more specifics by by Türk Telecom in February 2023) It seems that the growth if the Internet, in terms of the size of the IPv4 routing table is slowing down to the point that we may see the network shrink in size in 2024. We’ll return to this data when we look at projections for the size of the BGP FIB table in coming years.
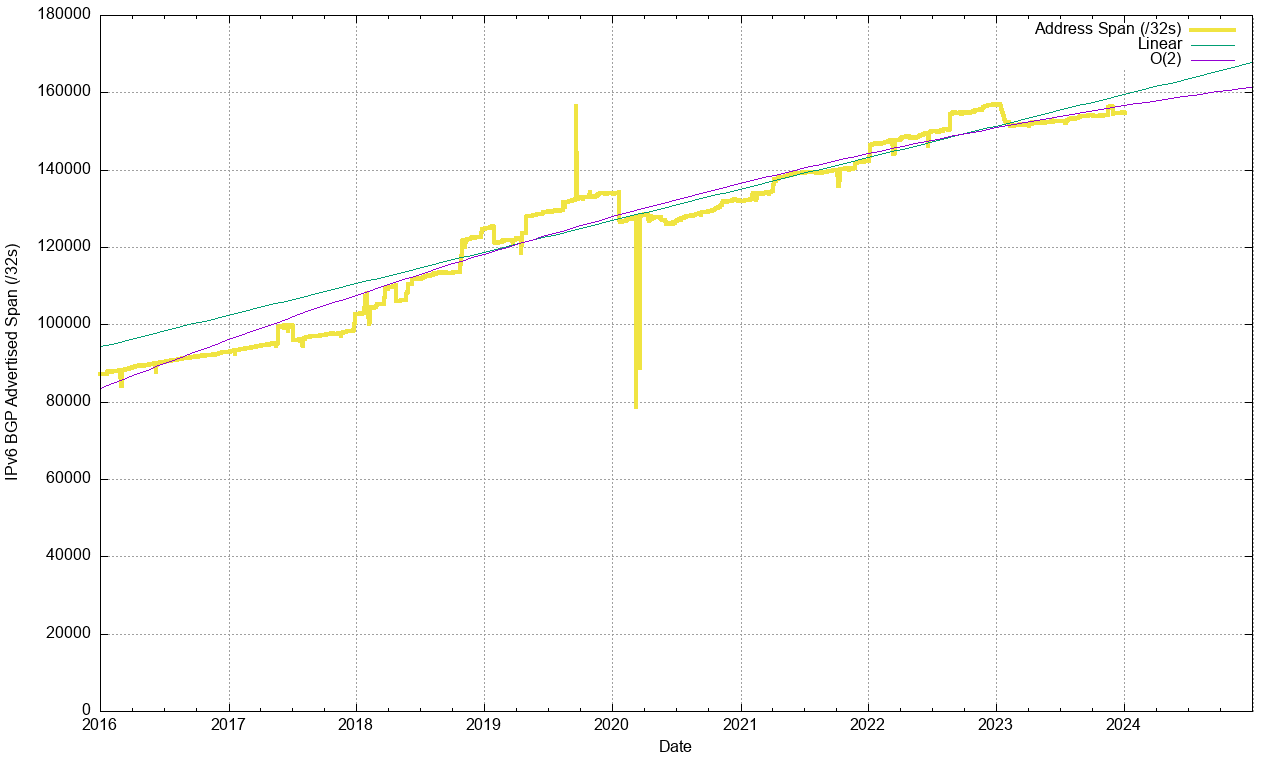
The eight-year period since the start of 2016 has seen the span of addresses advertised in the routing system slowing down until the start of 2021 (Figure 4). In 2021 we saw a number of large address blocks being advertised in the routing system by agencies associated with the US Department of Defence. Across 2022 and 2023 the total span of advertised IPv4 addresses has declined.
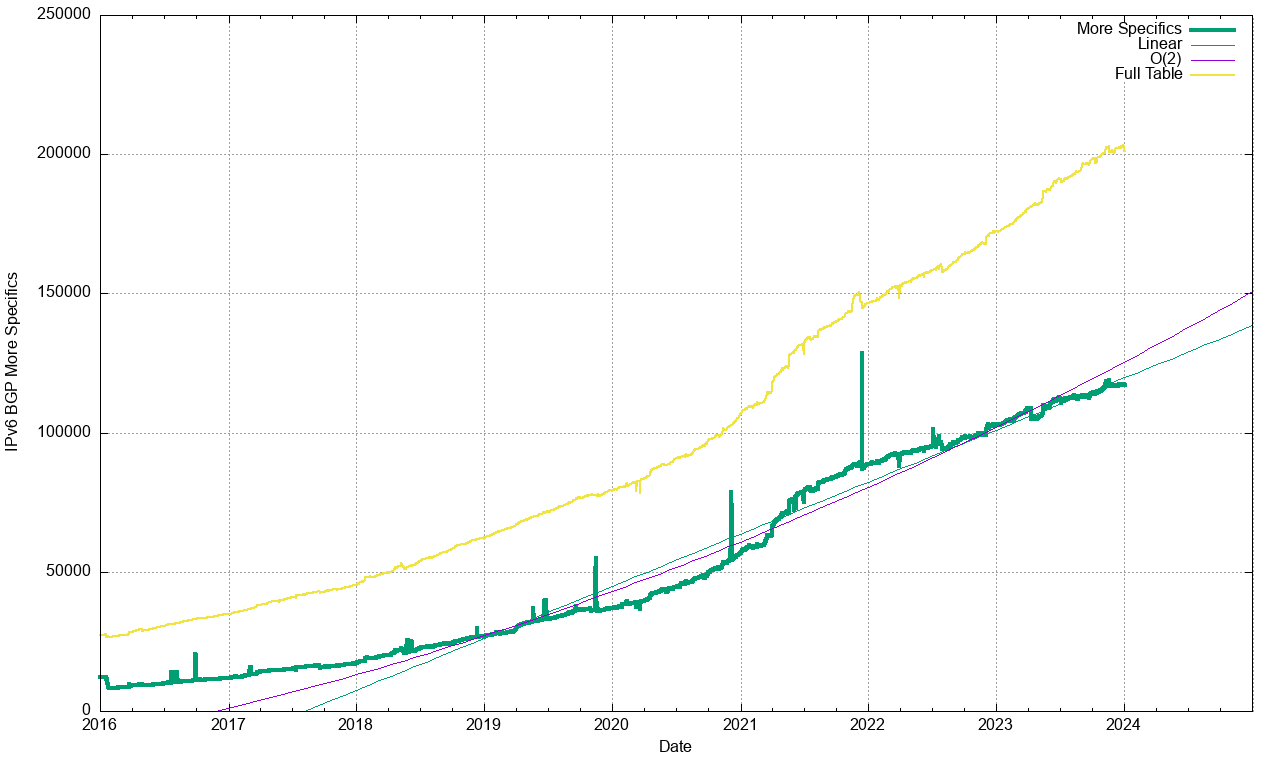
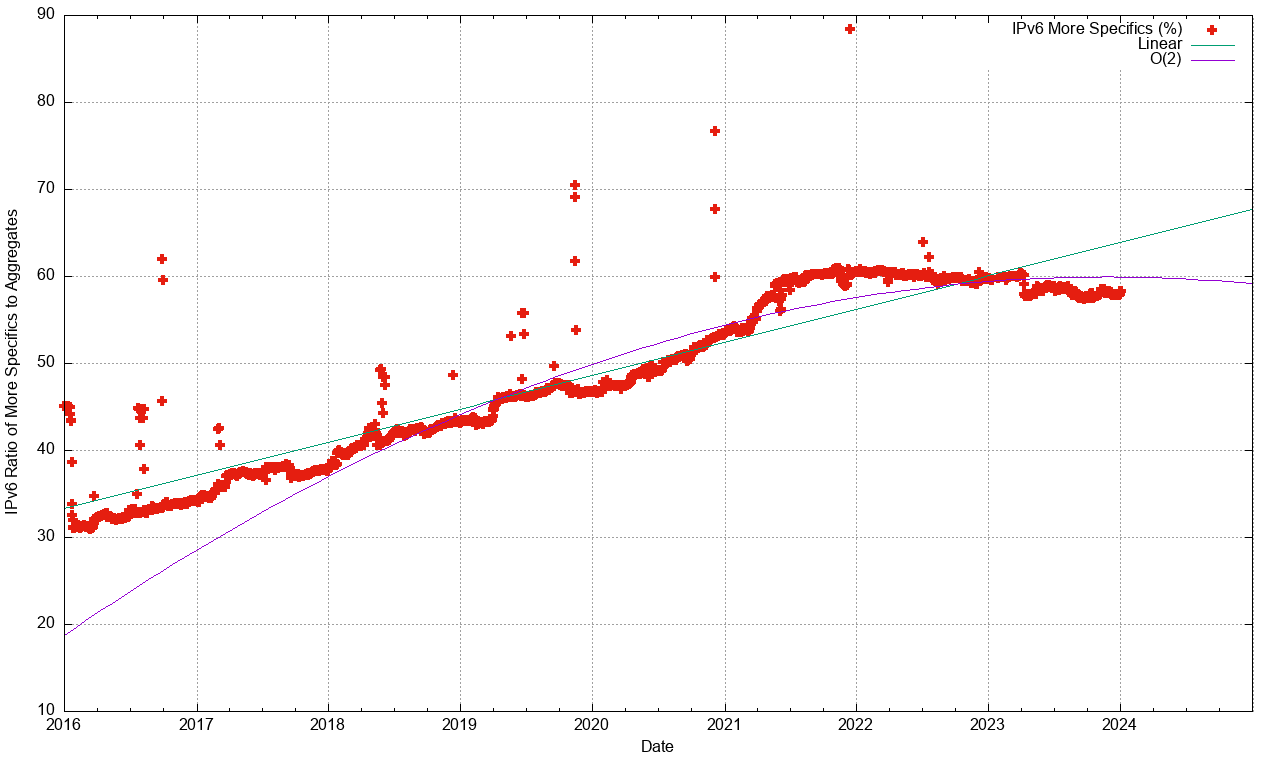
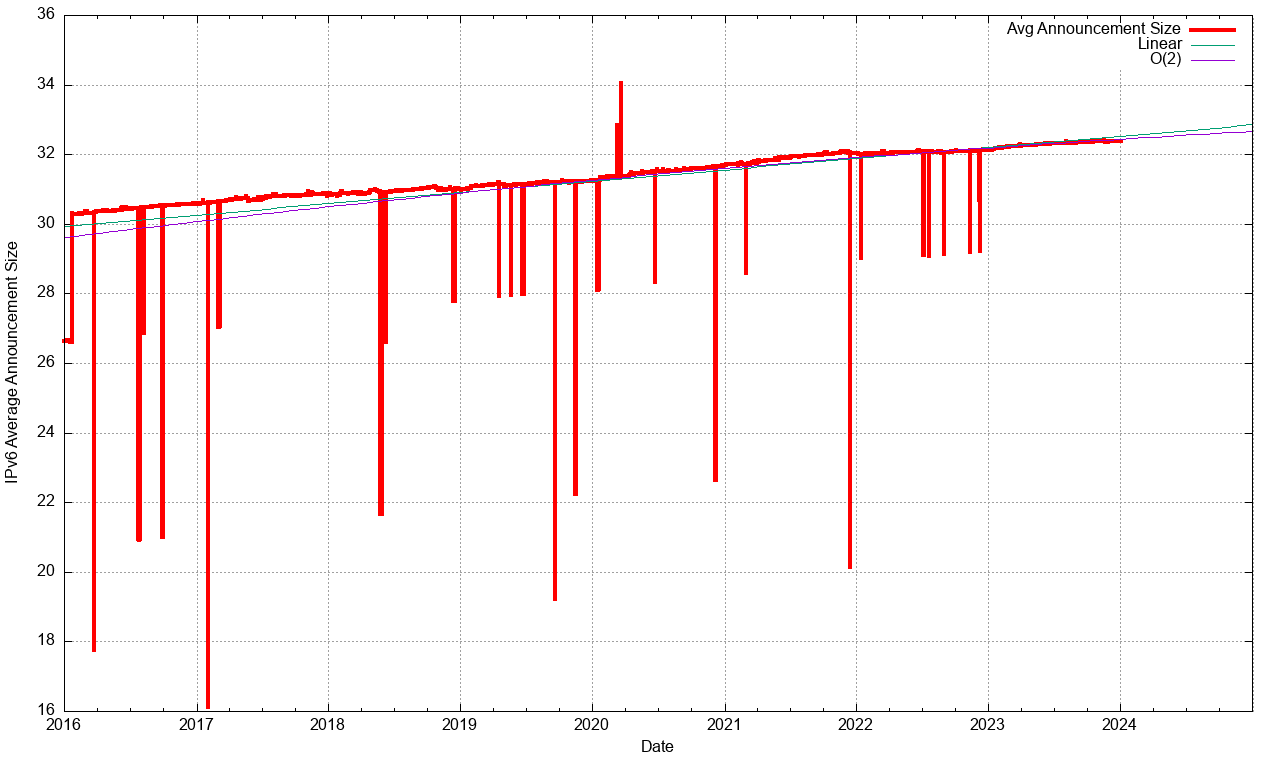
In terms of more specific advertisements and covering aggregate advertisements (Figure 5), the number of covering aggregate announcements increased across 2023, and the number of more specifics has reduced in size. Looking at the ratio of these two counts, the ratio has declined over 2023 (Figure 6). The average prefix size is now somewhat smaller than a /20 (Figure 7). Prefixes sizes of /24, /23 and /22 in total now account for 80% of the entire IPv4 routing table (Figure 8).
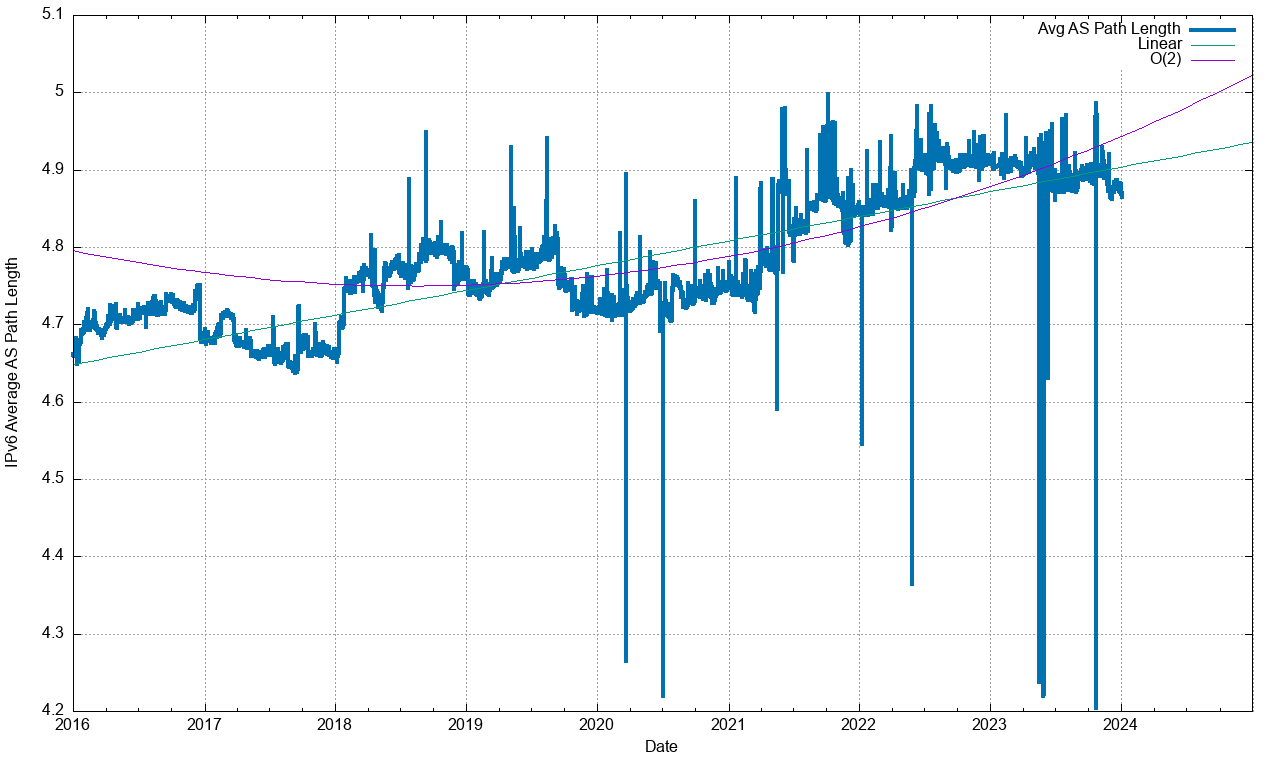
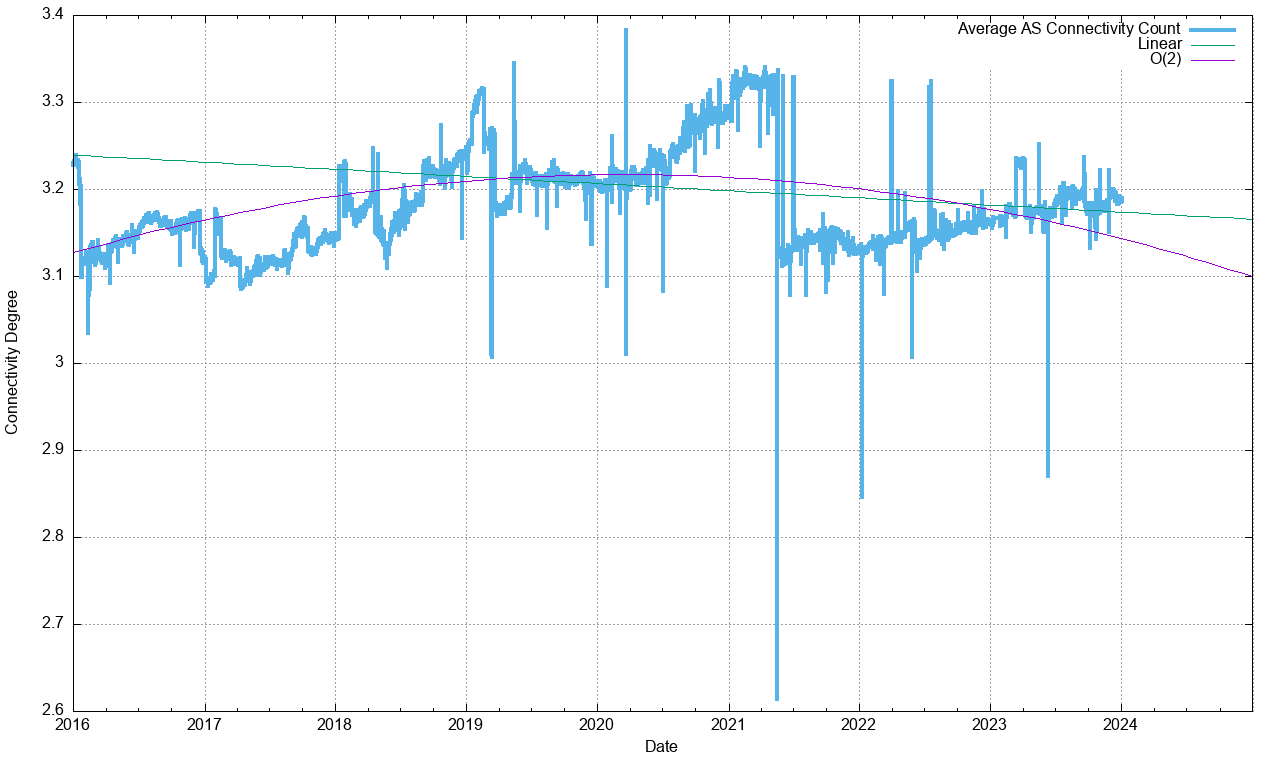
The topology of the network has remained relatively consistent, with the growth of the Internet being seen as relatively static density of interconnectivity. The average AS Path length has been constant since mid-2020. (Figure 9).
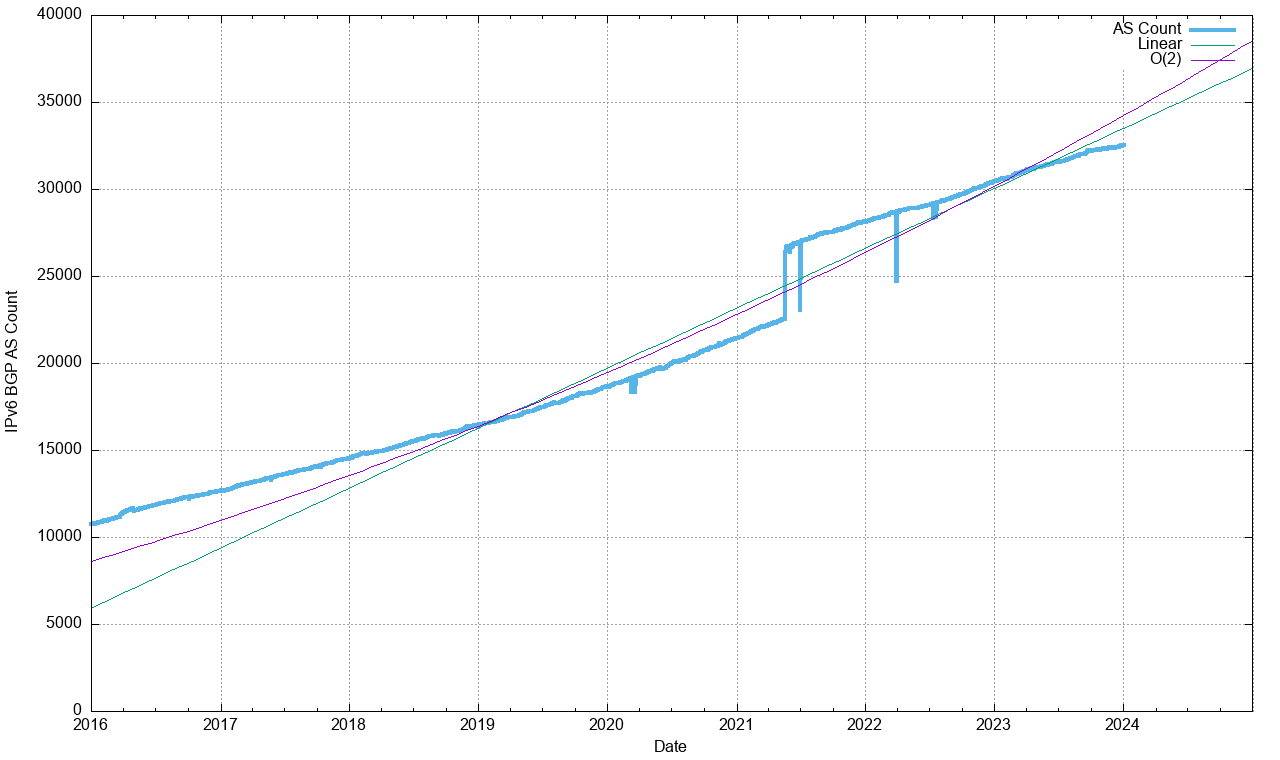
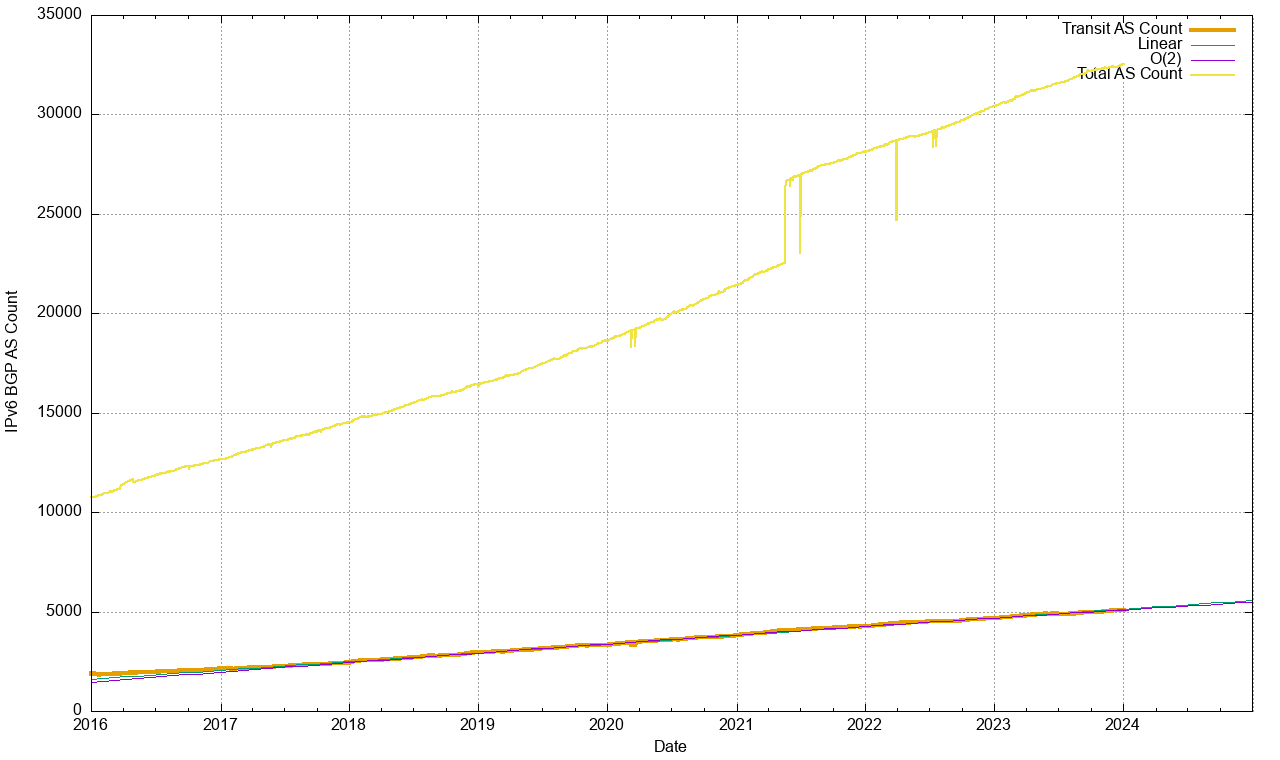
Further evidence of the slowing of the growth in the IPv4 internet can be seen in the AS count (Figure 10). The growth of the AS count started to decline in late 2020 and continued to decline in the ensuing years. This is a likely signal of network saturation in many markets. The number of transit networks was held constant across 2022, which appears to be a related signal of market saturation (Figure 11).
The year-by-year summary of the IPv4 BGP network (as seen by AS 131072) over the 2020-2023 period is shown in Table 1.
| Routing Table | Growth | ||||||||||
|---|---|---|---|---|---|---|---|---|---|---|---|
| Jan-20 | Jan-21 | Jan-22 | Jan-23 | Jan-24 | 2020 | 2021 | 2022 | 2023 | |||
| Prefix Count | 814,000 | 860,000 | 906,000 | 940,000 | 943,000 | 6% | 5% | 4% | 0% | ||
| Root Prefixes | 387,000 | 400,000 | 420,000 | 455,000 | 457,000 | 3% | 5% | 6% | 3% | ||
| More Specs | 427,000 | 460,000 | 486,000 | 495,000 | 486,000 | 8% | 6% | 2% | -1% | ||
| Address Span (/8s) | 169.8 | 171.4 | 183.3 | 182.8 | 181.8 | 1% | 7% | -0% | -1% | ||
| AS Count | 66,800 | 70,400 | 72,800 | 74,200 | 75,300 | 6% | 5% | 3% | 2% | ||
| Transit AS | 9,600 | 10,200 | 10,800 | 10,800 | 11,000 | 6% | 6% | 0% | 2% | ||
| Stub AS | 57,200 | 60,200 | 62,000 | 63,400 | 64,300 | 5% | 3% | 2% | 1% | ||
Table 1 – IPv4 BGP Table Growth Profile
In terms of advertised prefixes, the size of the routing table grew by some 3,000 entries, or just 0.3%. The number of root prefixes increased by 12,000 entries, while the number of more specific routes decreased by approximately 9,000 entries. If the count of more specific entries is related to the requirements for traffic engineering and load balancing on transit paths within the network, then this declining number points to a drop in the importance in traffic engineering in the IPv4 transit network.
The total span of advertised addresses declined by some 18M IPv4 /32s across the year, while the number of routed Stub AS numbers (edge networks) grew by 1.4% in 2023, and the total number of ASes visible in the IPv4 network grew by just 200 ASes across 2023, or 1.5%.
Let’s look in a little more detail at the 10 networks that had the highest net withdrawal count for the year, and the highest net growth (Table 2).
| Net Withdrawal | Net Growth | |||||||||
|---|---|---|---|---|---|---|---|---|---|---|
| AS Num | Change | Jan-23 | Dec-23 | Name, CC | AS Num | Change | Jan-23 | Dec-23 | Name, CC | |
| AS1291 | -5,826 | 6,183 | 357 | TTNET, TR | AS18403 | 3,034 | 1,499 | 4,533 | FPT, VN | |
| AS47331 | -2,703 | 2,811 | 108 | TTNET, TR | AS16509 | 1,709 | 7,761 | 9,470 | Amazon-O2, US | |
| AS6849 | -1,183 | 2,251 | 1,068 | UKRTELNET, UA | AS367 | 1,403 | 1,558 | 2,961 | DNIC, US | |
| AS1239 | -784 | 1,204 | 420 | SPRINTLINK, US | AS44477 | 1,376 | 77 | 1,453 | STARK, GB | |
| AS209 | -631 | 2,343 | 1,712 | CENTURYLINK, US | AS8151 | 1,221 | 1,939 | 3,160 | UNINET, MX | |
| AS1289 | -629 | 692 | 63 | HOTNET, IL | AS3737 | 1,122 | 26 | 1,148 | PTD, US | |
| AS9394 | -568 | 1,052 | 484 | CTT, CN | AS140292 | 1,079 | 1,258 | 2,337 | CT, Jiangsu, CN | |
| AS135887 | -568 | 1028 | 460 | Telstra Belong, AU | AS207990 | 1,012 | 116 | 1,128 | HR, IN | |
| AS35908 | -482 | 770 | 288 | VPLSNET, US | AS9009 | 857 | 2,650 | 3,507 | M247, RO | |
| AS40676 | -418 | 806 | 388 | Psychz, US | AS4155 | 846 | – | 846 | USDA-1, US | |
Table 2 – IPv4 Advertised Prefix Changes – Top 10 ASes
It appears that many of the withdrawals are more specifics rather than covering aggregates. In the case of growth networks, the top ranked network for 2023, AS 18403, FPT Telecom in Vietnam has some 820 “root” announcements, and the remaining 3,727 announcements are more specifics. A similar picture exists for AS16509, Amazon O2, where a net reduction in the advertised prefix count of some 3,885 entries could be affected by dispensing many more specific /24s.
These metrics show that the drivers for growth in the IPv4 BGP network have largely dissipated across 2023. It’s likely that we are seeing a number of factors at play behind this major change in the IPv4 network:
- The first is the saturation of many Internet markets across the globe, so that the amount of “green field” expansion is far lower than, say, a decade ago.
- Secondly, we are seeing considerable concentration on the service market, where the level of utilization of addresses is vastly greater by both content and service publishers and by end clients. The service and client numbers may be growing, but that does not necessarily imply the use of more IPv4 addresses or more routing table entries. NATs are fully entrenched in the IPv4 world, and in the service provider market volume economics implies that few larger providers are more efficient than a greater number of smaller providers.
- Thirdly, this concentration in the service market has been accompanied by further consolidation in the access market, particularly in mobile access networks. This consolidation of client access networks creates greater efficiencies in shared address solutions.
- The continued deployment of IPv6 cannot be ignored. Within the 10 economies with the largest span of advertised addresses (collectively, these 10 economies advertise 74% of the span of advertised IPv4 addresses) 7 of these economies are also in the 10 economies with the largest span of advertised IPv6 addresses (collectively, these same 10 economies advertise 76% of the span of advertised IPv6 addresses). Looking at just these 7 economies, namely the United States, China, Japan, Germany, the United Kingdom, Brazil, and Canada, they advertise 76% of the entire advertised IPv6 address span and 65% of the advertised IPv4 address span. The level of IPv6 use in 6 of these 7 economies have a greater use of IPv6 deployment than the total global deployment level of 37% of end users, while the deployment levels in China is slightly below this global average.
- Finally, I suspect that the most significant dissipating factor has been the inexorable rise of private content distribution networks (CDNs). The conventional drivers for growth in the routing table were based on the product of an increasing number of networks with discrete routing policies and the need for these networks to balance incoming traffic across multiple network paths (traffic engineering using more specifics). The rapid uptake of CDNs by service platforms has meant a significantly reduced level of dependence on BGP transit services to deliver content to users. The public part of the Internet is rapidly shrinking to the last mile access network, which connects directly to a number of CDNs. The transit part of the Internet is just not so critical these days. It is unlikely that we will move away from the extensive use of CDNs in the foreseeable future, and if anything, their level of use within the Internet’s service portfolio will increase further.
In summary, the IPv4 network may possibly have peaked in 2023. In various parts of the network the number of IPv4 entries in the default-free zone is between 920,000 and 960,000 entries. The net growth in 2023 was some 3,000 new entries, down from 34,000 in 2022 and 53,000 in 2021. A net increase of 1,100 new AS numbers were seen in the IPv4 network across the year, compared to 1,599 in 2022. The network is certainly slowing down at present, and the current open question is whether this growth will reverse in 2024 and begin to decline in size in the coming years.
The IPv6 BGP Table Data
A similar exercise has been undertaken for IPv6 routing data. As with the IPv4 network, there is diversity in the number of IPv6 routes seen at various vantage points, as shown when looking at the prefix counts advertised by all the peers of Route Views (Figure 13).
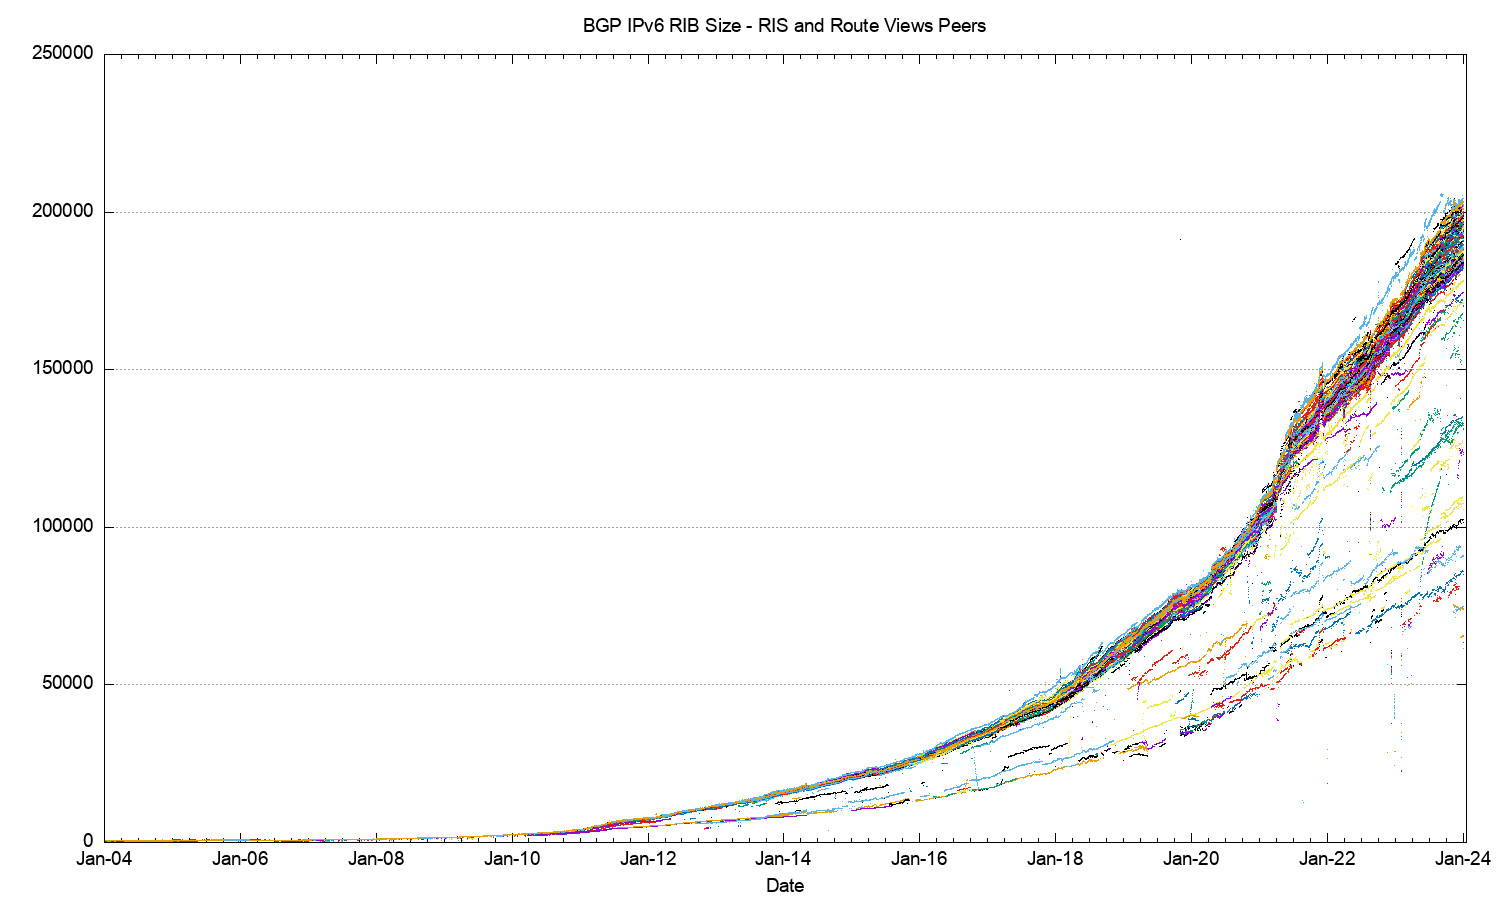
Figure 12 – IPv6 routing table since 2004 as seen by RIS and Route Views peers
There are a number of distinct phases in the growth trends that are visible in this history of the IPv6 routing table. The period between 2004 and mid 2018 could be modelled by an exponential growth function with a doubling interval of three years. The period from mid-2019 to mid-2021 saw an increase in the growth function, where the doubling interval fell to slightly under two years. However, from mid-2021 the growth pattern has changed again and is now best modelled by a linear growth model with a growth rate of some 25,000 additional route entries per year, or an average of 68 new routing entries per day.
A more detailed look at the most recent four years incorporating both Route Views and RIS data (Figure 14) shows some increasing diversity between various BGP views as to what constitutes the “complete” IPv6 route set, and the variance at the end of 2023 now spans some 25,000 prefix advertisements
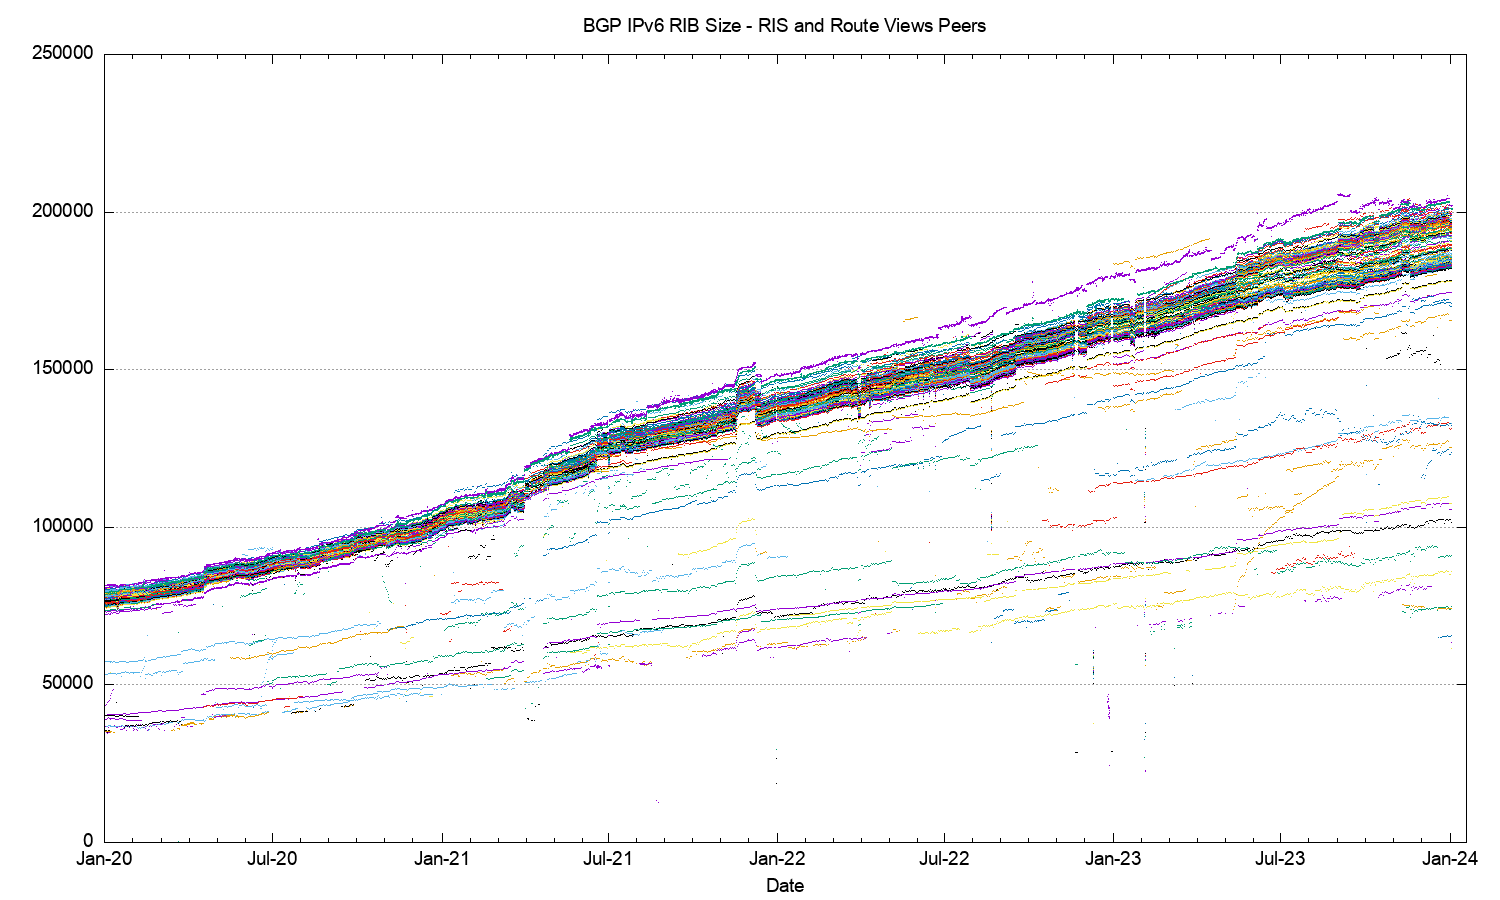
Figure 14 – IPv6 routing table 2019 – 2024 as seen by Route Views and RIS peers
Figure 15 shows a detailed view of the routing table as seen by each of the Route Views and RIS peers across 2023.
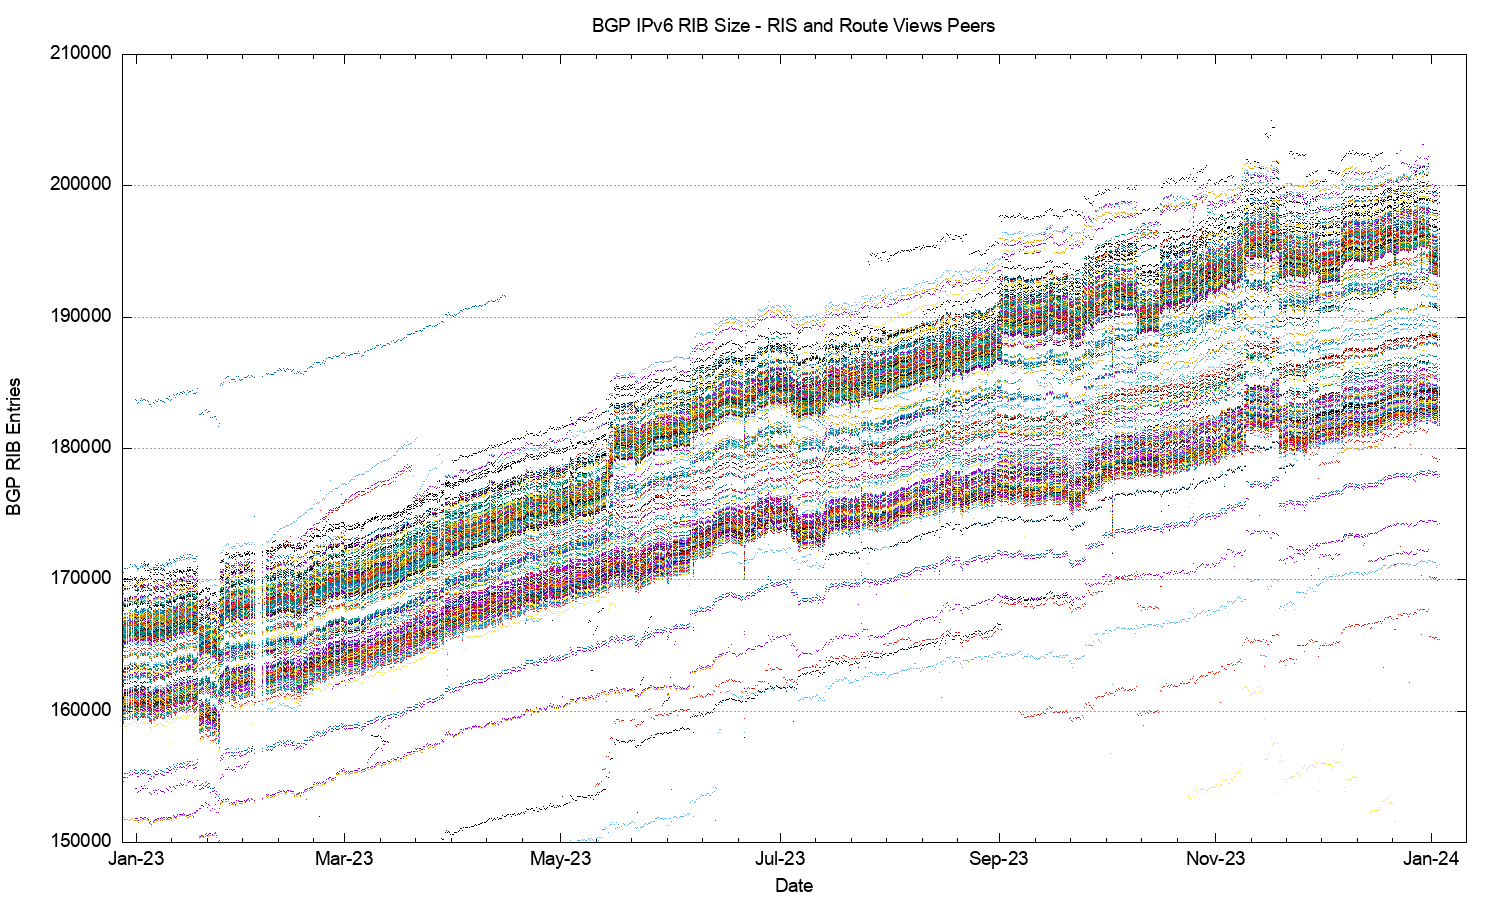
Figure 15 – IPv6 routing table across 2023, as seen by Route Views and RIS peers
The comparable profile figures for the IPv6 Internet are shown in Figures 16 through 25.
|
|
|
|
|
|
|
|
|
|
|
|
|
|
|
|
|
|
|
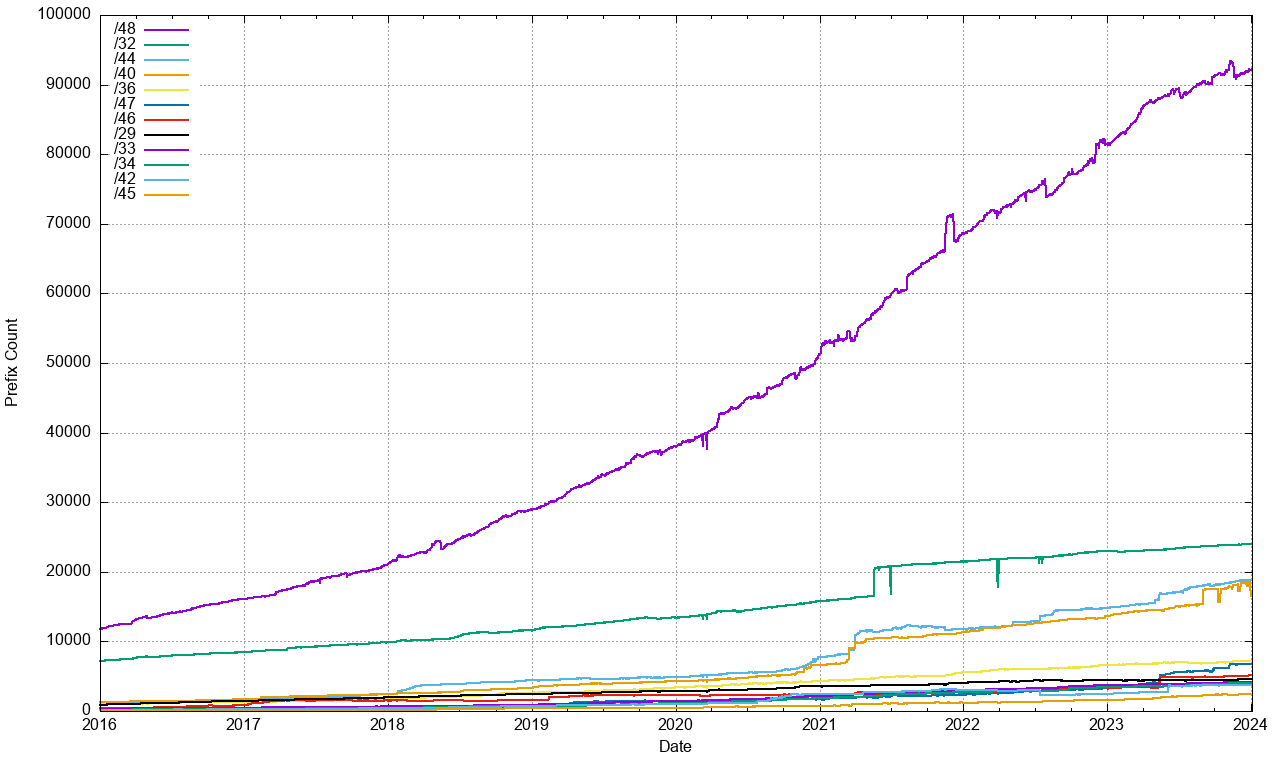
The growth of the IPv6 routing table has been relative steady across 2022, growing by some 30,000 routes across 2023 (Figure 16). For the first half of 2023 the average daily growth was an additional 100 – 120 new entries per day, declining to some 50-70 new entries in the latter half of the year. Routing advertisements of /48s are the most prevalent prefix size in the IPv6 routing table at the end of 2032, and some 46% of all prefixes are /48’s. A total of 75% of the IPv6 table entries are composed of /48, /32, /44, and /40 prefixes (Figure 21).
RIR allocations of IPv6 addresses show a different pattern, with 74% of the 64,008 IPv6 address allocations recorded in the RIRs’ registries are either a /32 (48%) or a /29 (25%). Only 20% of allocations are a /48. What is evident is that there is no clear correlation between an IPv6 address allocation prefix size (as used by the address registries in the address allocation process) and the advertised address prefix size. Many IPv6 address holders do not advertise their entire allocated IPv6 address prefix in a single routing advertisement.
Why is the IPv6 routing table being fragmented so extensively? The conventional response is that this is due to the use of more specific route entries to perform traffic engineering. Another possible reason is the use of more specifics to counter efforts of route hijacking. This latter rationale also has issues, given that it appears that most networks appear to accept a /64 prefix, and the disaggregated prefix is typically a /48, so as a countermeasure for more specific route hijacks, advertising /48’s may not be all that effective.
This brings up the related topic of the minimum accepted route object size. The common convention in IPv4 is that a /24 prefix advertisement is the smallest address block will propagate across the entire IPv4 default-free zone. More complex minimum size rules have largely fallen into disuse as address trading appears to have sliced up many of the larger address blocks into smaller sizes. If a /24 is the minimum accepted route prefix size in IPv4, what is the comparable size in IPv6? There appears to be no common consensus position here, and the default action many network operators appears to is to use no minimum size filter at all. In theory that would imply that a /128 route object would be accepted across the entire IPv6 default-free zone, but a more pragmatic observation is that a /32 would be assuredly accepted by all networks, and it appears that many network operators believe that a /48 is also generally accepted. Given that a /48 is the most common prefix size in today’s IPv6 network this view appears to be widespread. However, we also see prefixes smaller in size than a /48 in the routing table with /49, /52, /56 and /64 prefixes present in the IPv6 BGP routing table. Slightly more than 1% of all advertised prefixes are more specific than a /48.
The summary of the IPv6 BGP routing table profile for period 2020 through to the start of 2024 is shown in Table 3. The IPv6 network growth rate in 2023 has been on a par with the previous year, with a 7% growth in networks, and a 17% growth in route entries.
| Routing Table | Growth | ||||||||||
|---|---|---|---|---|---|---|---|---|---|---|---|
| Jan-20 | Jan-21 | Jan-22 | Jan-23 | Jan-24 | 2020 | 2021 | 2022 | 2023 | |||
| Prefix Count | 79,400 | 105,500 | 146,500 | 172,400 | 201,200 | 33% | 39% | 18% | 17% | ||
| Root Prefixes | 42,300 | 49,200 | 57,800 | 69,400 | 84,000 | 16% | 17% | 20% | 21% | ||
| More Specifics | 37,100 | 56,300 | 88,700 | 103,000 | 117,200 | 52% | 58% | 16% | 14% | ||
| Address Span (/32s) | 133,800 | 132,000 | 142,300 | 157,000 | 155,000 | -1% | 8% | 10% | -1% | ||
| AS Count | 18,650 | 21,400 | 28,140 | 30,439 | 32,500 | 15% | 31% | 8% | 7% | ||
| Transit AS Count | 3,590 | 4,100 | 4,640 | 4,990 | 5,400 | 14% | 13% | 8% | 8% | ||
| Stub AS Count | 15,060 | 17,300 | 23,500> | 25,440 | 27,100 | 15% | 36% | 8% | 7% | ||
Table 3 – IPv6 BGP Table Growth Profile
The pressures for further expansion on the IPv6 network appear to be more idiosyncratic for each market sector and region, rather than some form of more general imperative. Where there is at present scant IPv6 adoption, as is the case in most of Africa, the Middle East, Eastern and Southern Europe, and the western part of Latin America, there is no apparent sense of urgency to make the shift (Figure 26). It would appear that the Internet market is largely a saturated one and the smaller pace of network growth in those regionas appears, for the moment, be adequately accommodated in the continued use of IPv4 NATs.
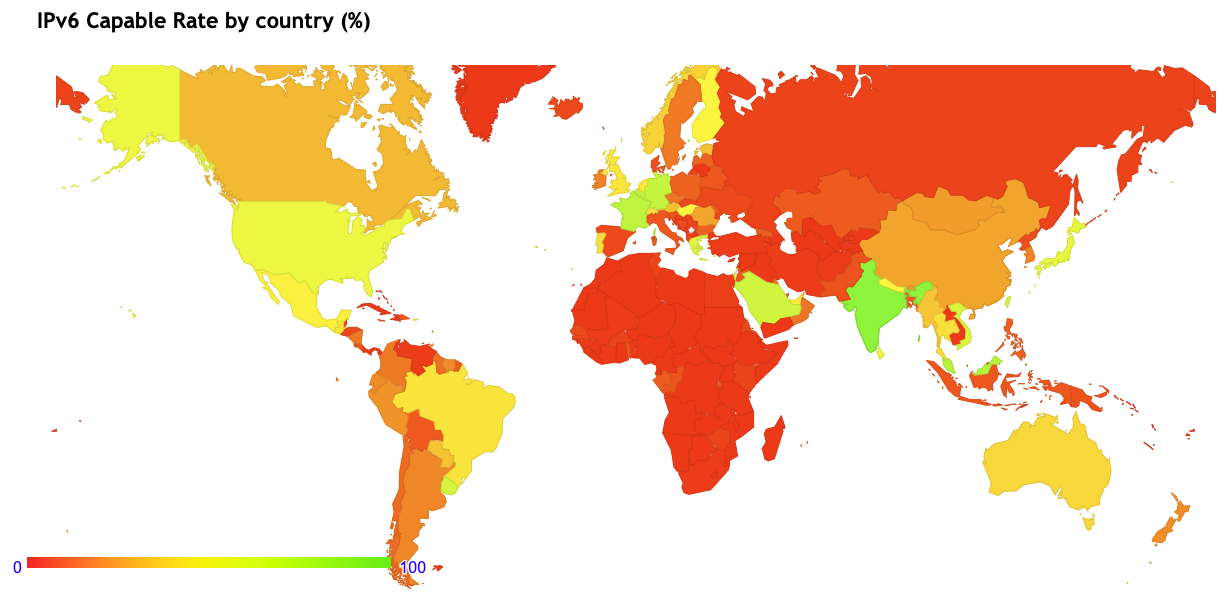
Figure 26 – IPv6 Adoption in late 2023 (https://stats.labs.apnic/net/ipv6)
The Predictions
What can this data from 2023 tell us in terms of projections of the future of BGP in terms of BGP table size?
Forecasting the IPv4 BGP Table
Figure 27 shows the data set for BGP from January 2016 until December 2023. This plot also shows the fit of these most recent 5 years of data to various growth models. The first-order differential, or the rate of growth, of the BGP routing table is shown in Figure 28. The linear average rate of growth of the routing table appears be falling slowly from 140 to 160 additional entries per day in 2016 to around 100 per day at the start of 2024.
There are a number pf potential models to match this data. One model is to take the five-year average daily rate of change and apply this as a continuous model for the next five years. This is a “linear” model and takes the current dynamics of the IPv4 Internet and makes the assumption that these dynamics will operate largely unchanged over the projection period. The second model is to look at the trend in the changes of rate of change and match this to a linear model. If the first order differential of a data series is a linear function, then the original data can be represented as a second order polynomial. The final model used here is to model the log of the data series as a linear model and therefore derive an exponential model for the data series. The application of these three projection models to the original data series is shown in Figure 27, and the first order differential of the data (the daily rate of change) is shown in Figure 28.
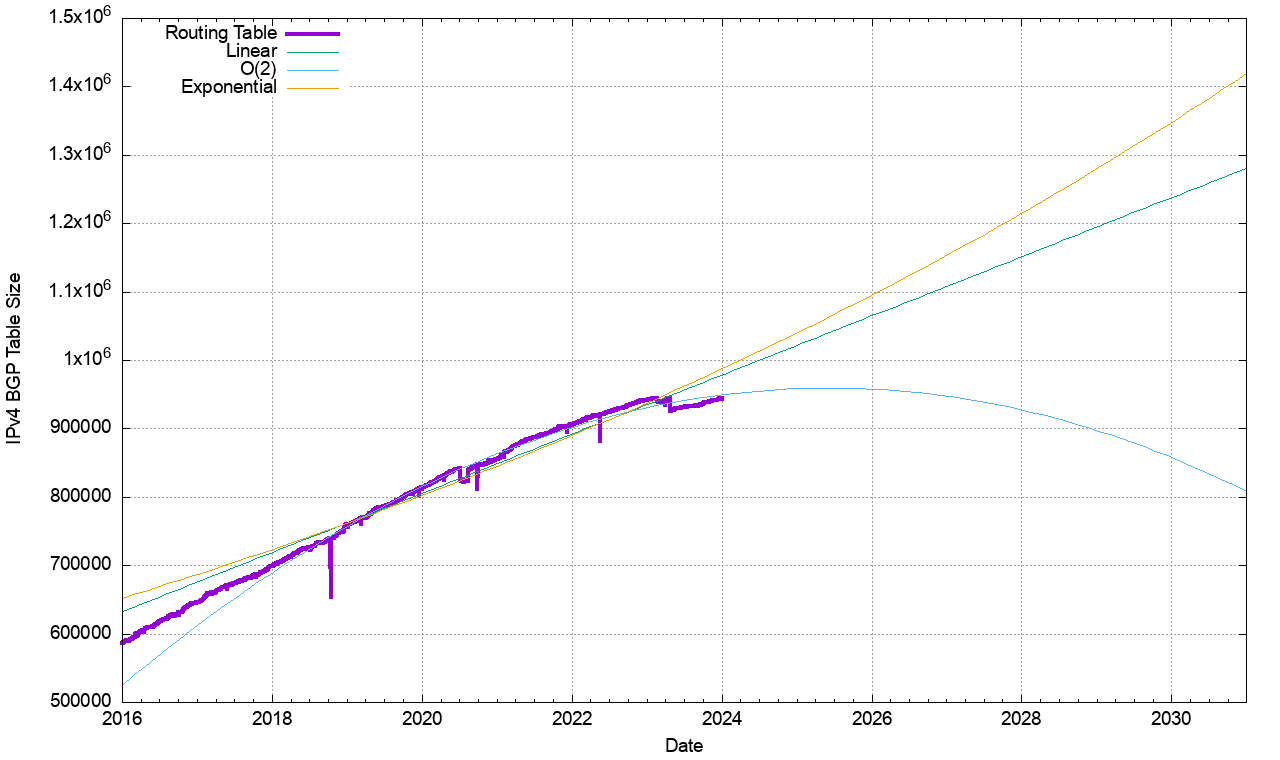
Figure 27 – IPv4 BGP Table 2016 – 2024
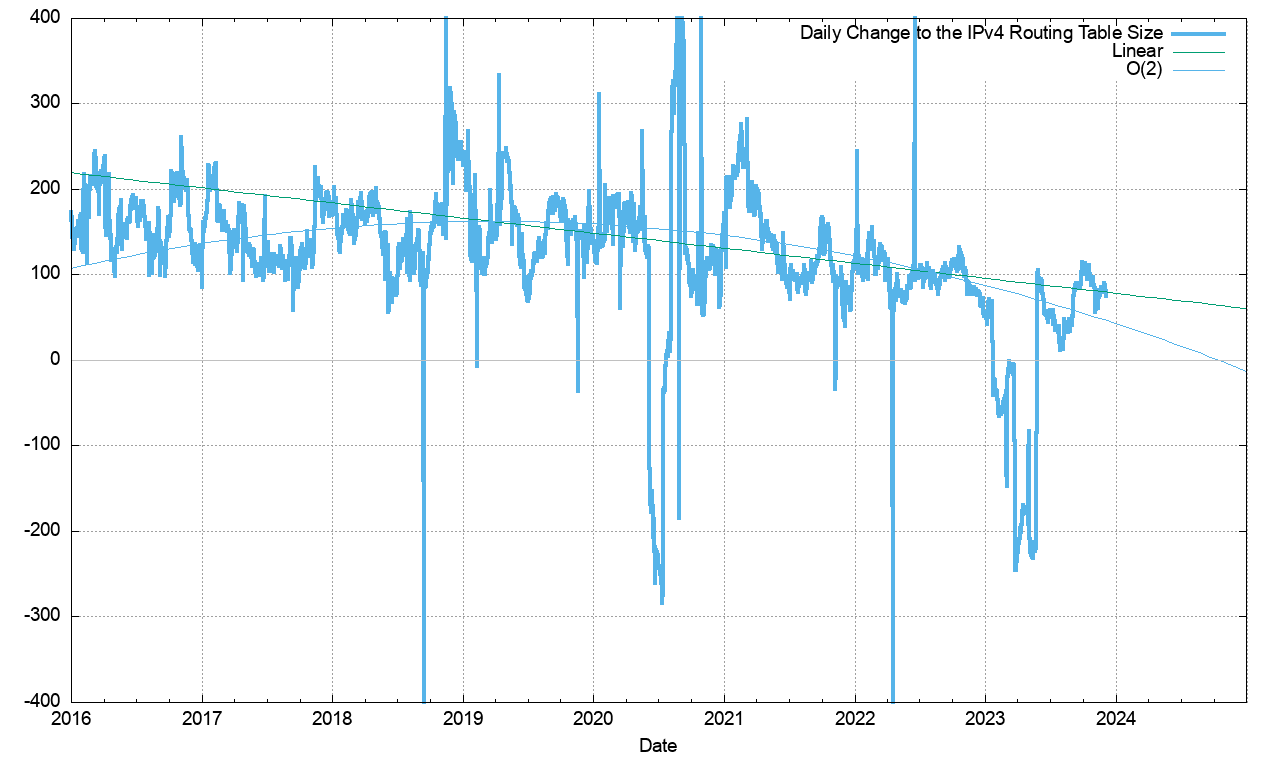
Figure 28 -First Order Differential of Smoothed IPv4 BGP Table Size – 2016 – 2024
Figure 28 appears to support the supposition of the primary data series fitting a second order polynomial model. The rate of change of the daily change to the count of Ipv4 routing objects has been declining since 2020, where the range of daily change has fallen from a band of values between 100 to 200 new entries per day to a new range that sits in a band between 50 to 100 new entries per day. This model suggests that the overall rate of change will shift from positive to negative in 2026.
The five-year prediction models for all three forms (linear, polynomial and exponential) is shown in Figure 29.
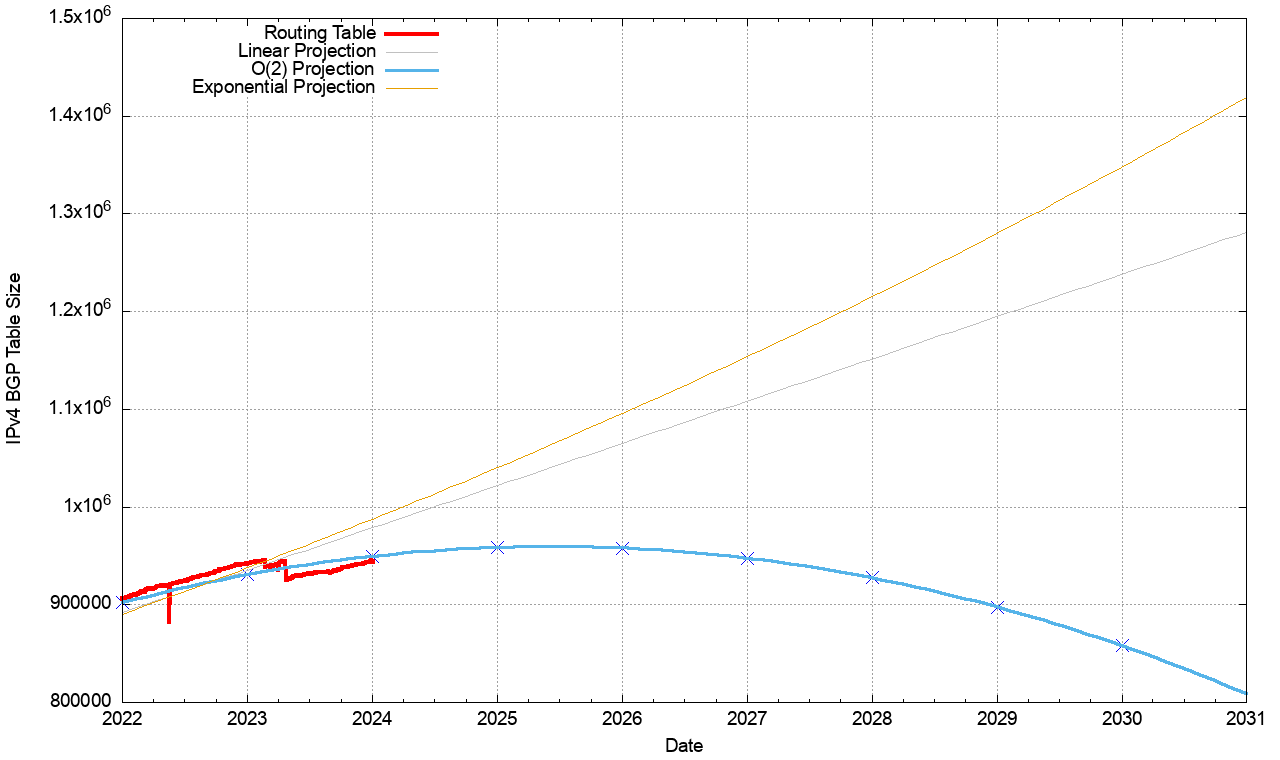
Figure 29 – IPv4 BGP Table Predictions
The projections of the linear and polynomial best fit models are shown in Table 4 (the resumption of an exponential growth model appears to be highly unlikely in this late phase of the IPv4 network).o.net/ispcol/2024-01/bgp2023-fig29.png” width=95%>
Figure 29 – IPv4 BGP Table Predictions
| IPv4 Table | Projection | ||
|---|---|---|---|
| Linear | O(2) Poly | ||
| Jan 2019 | 760,000 | ||
| Jan 2020 | 814,000 | ||
| Jan 2021 | 866,000 | ||
| Jan 2022 | 906,000 | ||
| Jan 2023 | 942,000 |   | |
| Jan 2024 | 944,000 | 978,000 | 950,000 |
| Jan 2025 | 1,022,000 | 959,000 | |
| Jan 2026 | 1,065,000 | 958,000 | |
| Jan 2027 | 1,108,000 | 948,000 | |
| Jan 2028 | 1,152,000 | 928,000 | |
| Jan 2029 | 1,195,000 | 898,000 | |
| Jan 2030 | 1,238,000 | 858,000- | |
Table 4 – IPv4 BGP Table Size Prediction
The linear projection model is somewhat unlikely in this context. The drivers for continued growth of the IPv4 network do not appear to be clearly evident, so the projection of continued growth of the number of IPv4 FIB entries with a net gain of 43,000 is somewhat unrealistic.
The O(2) polynomial projection model predicts that this first order differential will reach the zero point by 2026 and continue to decline. It must be stressed it’s just a mathematical model that fits the recent data, and nothing more. The dominant factor that is driving the prediction of a peak size in 2025 is the large number of more specific entries that were withdrawn by AS 9121 and AS 473331 at the start of 2023. If one were to modify the primary data series and remove this route withdrawal event from the series then the resulting picture is still a declining growth rate, but from a higher base and at a lower rate. This would push the peak point out to late 2027 or early 2028, but not change the overall pattern of a shift from growth to decline in the coming years.
Given that that last “normal” year of supply of available IPv4 address to fuel continued growth in the IPv4 Internet was now over a decade ago in 2010, perhaps the more relevant question is: Why has the growth of the IPv4 routing table persisted with such regularity in the ensuring decade?
It should be remembered that a dual-stack Internet is not the objective in this time of transitioning the Internet to IPv6. The ultimate objective of the entire transition process is to support an IPv6-only network. An important part of the process is the protocol negotiation strategy used by dual-stack applications, where IPv6 is the preferred protocol wherever reasonably possible. In a world of ubiquitous dual-stack deployment all applications will prefer to use IPv6, and the expectation is that in such a world the use of IPv4 would rapidly plummet.
The challenge for the past decade or more has been in attempting to predict when in time that tipping point that causes demand for IPv4 to plummet may occur. The current data suggests that this point of inflexion for the IPv4 network may be imminent.
Forecasting the IPv6 BGP Table
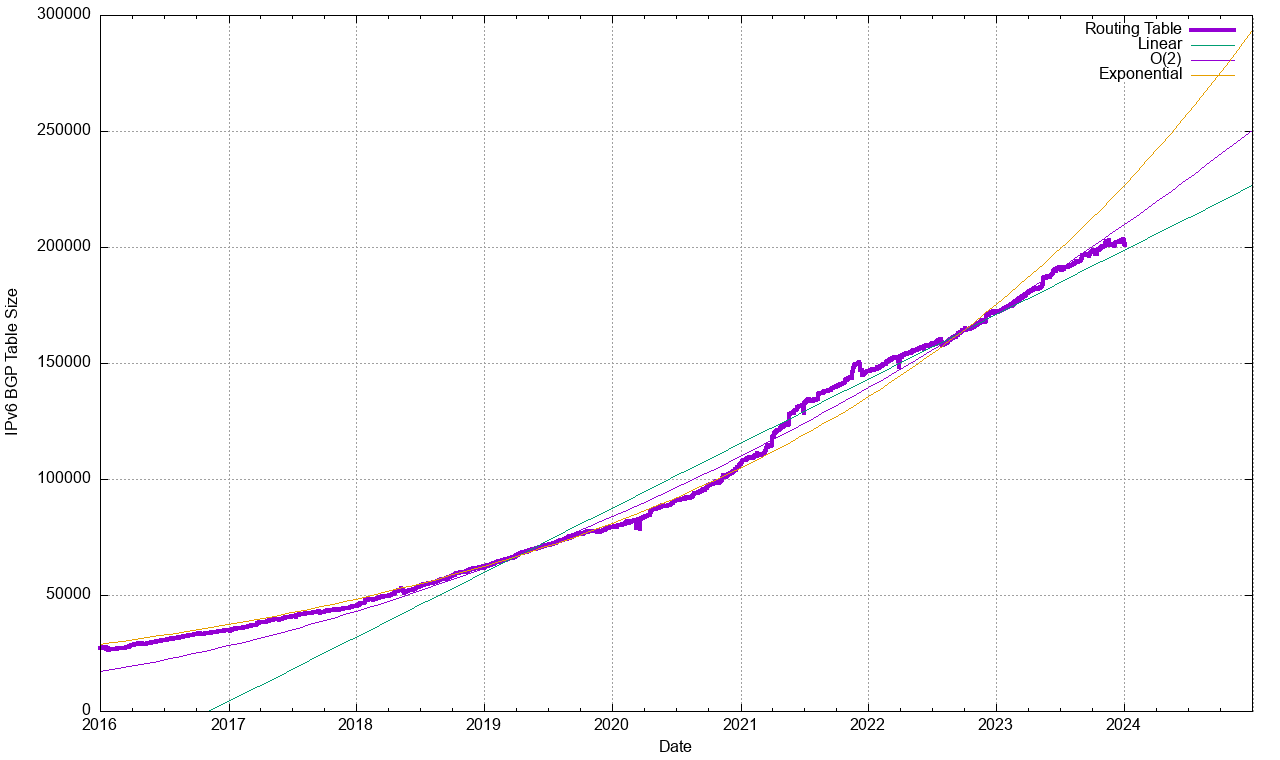
The same technique can be used for the IPv6 routing table. Figure 30 shows the data set for BGP from January 2016 until January 2024.
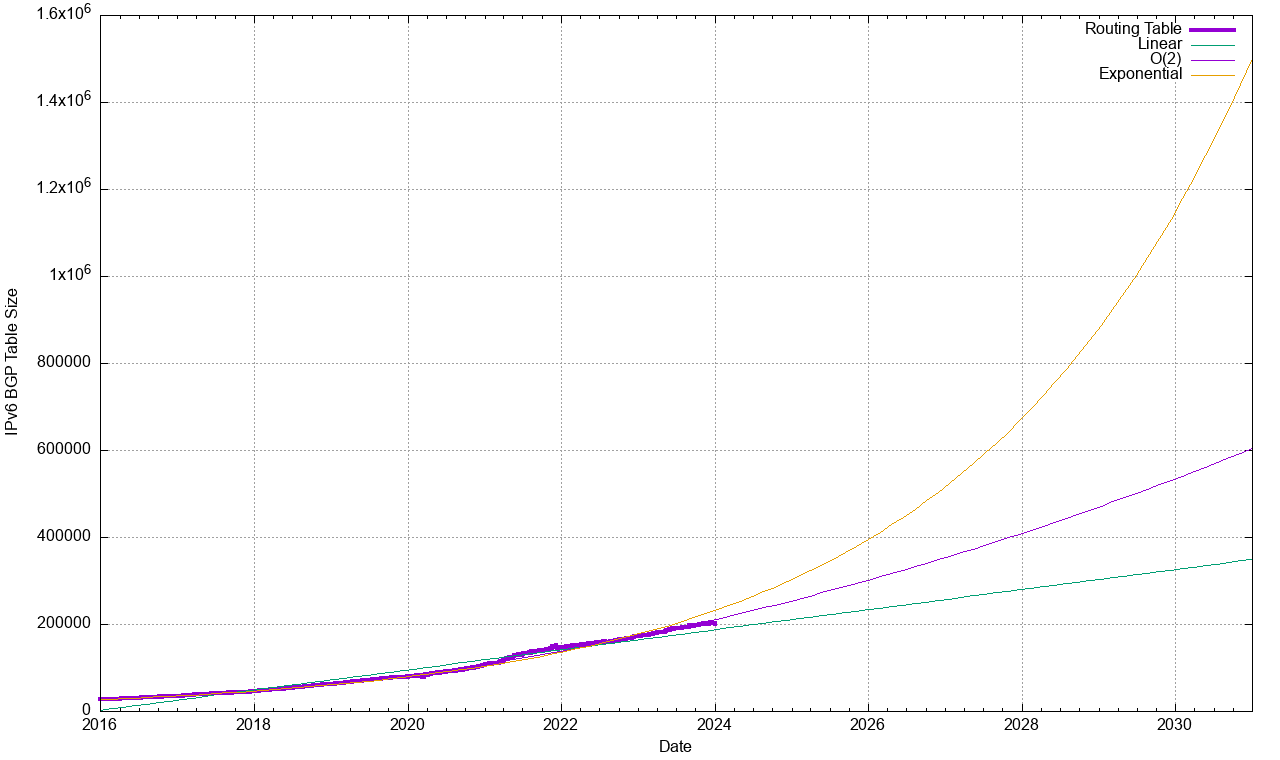
Figure 30 – IPv6 BGP Table Size from January 2016
The first order differential, or the rate of growth of the IPv6 BGP routing table is shown in Figure 31. The number of additional routing entries has grown from 10 new entries per day at the start of 2012 to a peak of some 230 new entries per day in May 2021.
The first half of 2023 had a steady period of increase in the growth of the daily count of new entries from around 100 per day to 150,per day, while the second half of 2023 saw a decline in this rate of growth to 50 new entries per day by the end of the year. (Figure 31).
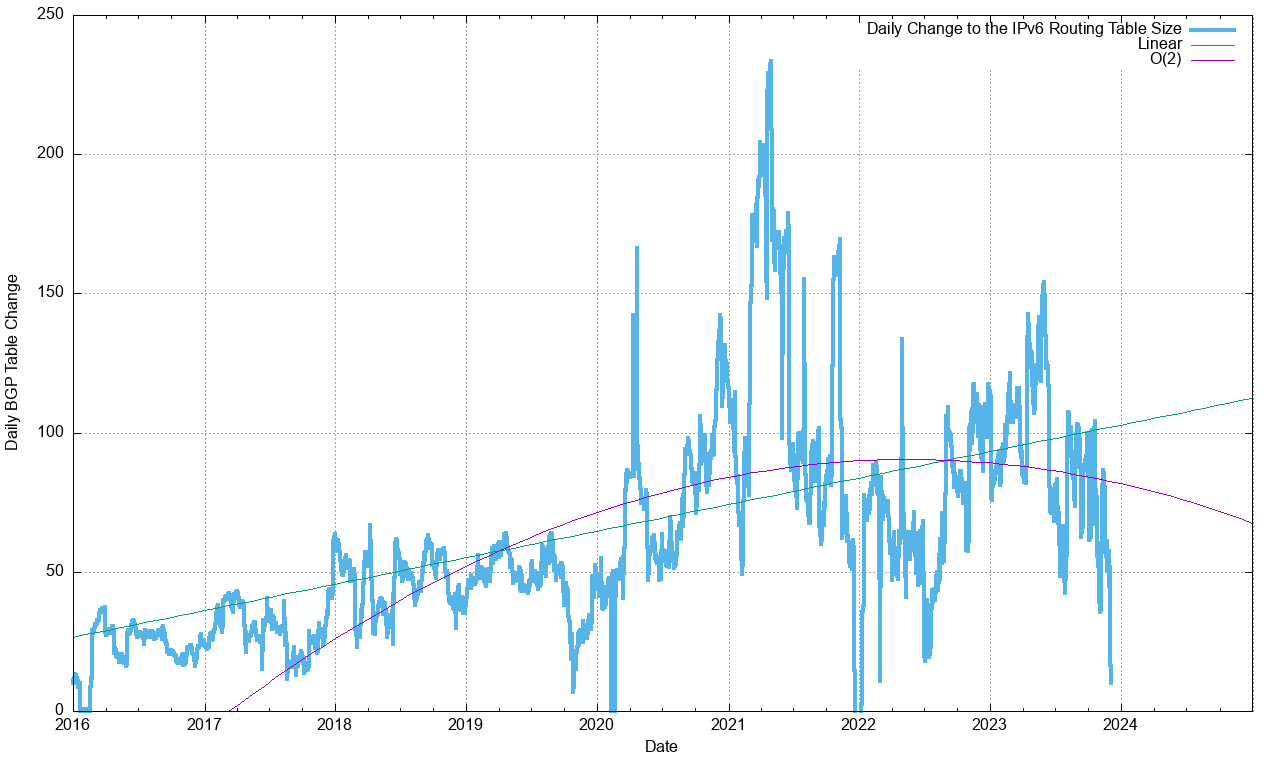
Figure 31 – First Order Differential of IPv6 BGP Table Size
There are two visible trends in the IPv6 data. The 5-year trend can be fitted against an exponential growth model with a doubling interval of a little under three years. The more recent 2-year trend can be fitted against a linear growth model The fit of a linear projection and an exponential model of projected IPv6 table size is shown in Figure 32.
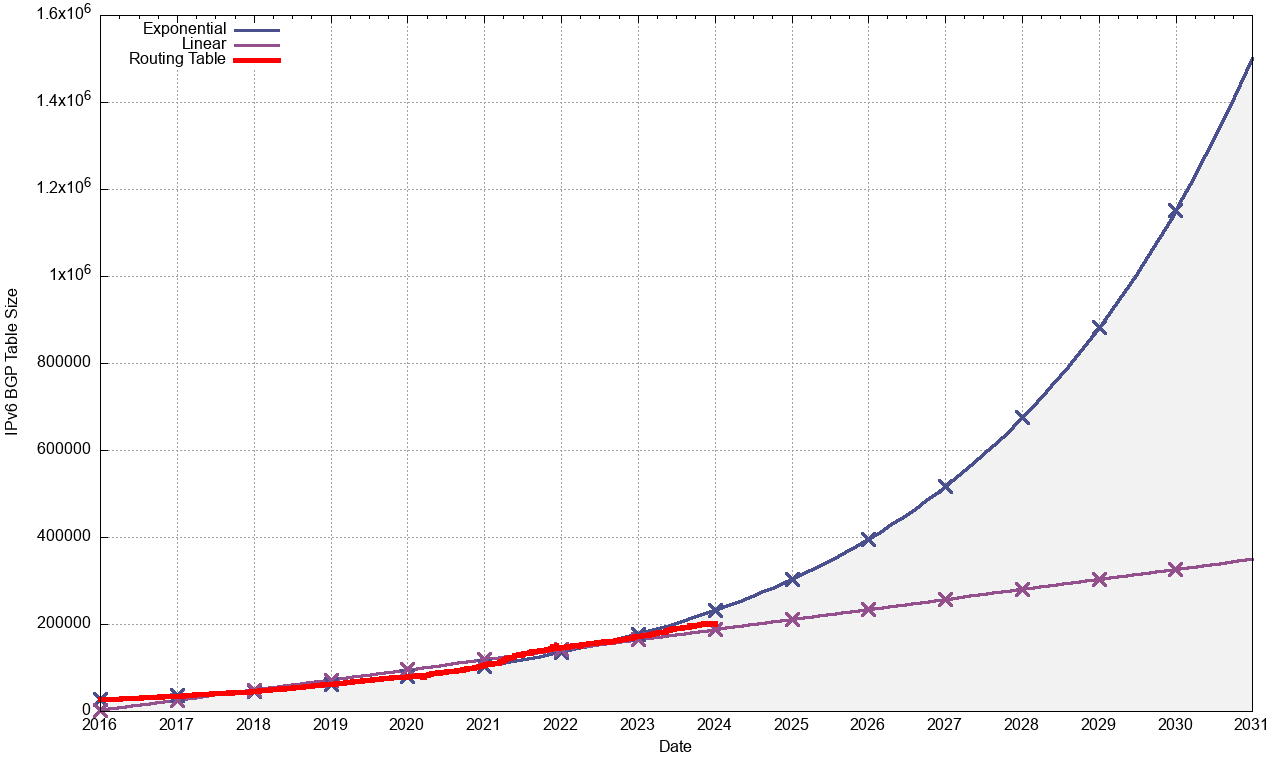
Figure 32 – Projections of IPv6 BGP Table Size
The projections for the IPv6 table size are shown in Table 5.
| IPv6 Table | Projection | |||
|---|---|---|---|---|
| Linear | O(2) Poly | Exponential | ||
| Jan 2018 | 45,000 | |||
| Jan 2019 | 62,000 | |||
| Jan 2020 | 79,000 | |||
| Jan 2021 | 104,000 | |||
| Jan 2022 | 147,000 | |||
| Jan 2023 | 172,000 | |||
| Jan 2024 | 201,000 | 188,000 | 211,000 | 232,000 |
| Jan 2025 | 211,000 | 254,000 | 303,000 | |
| Jan 2026 | 234,000 | 302,000 | 396,000 | |
| Jan 2027 | 257,000 | 354,000 | 517,000 | |
| Jan 2028 | 280,000 | 410,000 | 675,000 | |
| Jan 2029 | 303,000 | 470,000 | 883,000 | |
| Jan 2030 | 327,000 | 535,000 | 1,151,000 | |
Table 5 – IPv6 BGP Table Size Prediction
The linear and exponential projections in Table 5 provide a reasonable estimate of the low and high bounds of the growth of the IPv6 BGP routing table in the coming years.
If IPv6 continues to grow exponentially over the next five years, doubling every 30 months or so, then the size of the IPv6 routing table will be a little over one million entries at the start of 2030. The data from the previous two years suggests that such a level of growth is unlikely, and a linear growth model is a closer fit to the recent past, and an average growth rate of 23,000 new entries per year is a better fit to this recent data.
What is also unknown is the extent to which the slowing growth rate for IPv6 in the past 24 months is related to the COVID-19 pandemic, and potentially the economic side effects of the turmoil in global energy markets due to the Russian invasion of the Ukraine. The communications market is not immune from such global effects.
Conclusion
These predictions for the routing system are highly uncertain. The correlation between network deployments and routing advertisements has been disrupted by the hiatus in supply of IPv4 addresses, causing more recent deployments to make extensive use of various forms of address sharing technologies, and making fundamental alterations to the architecture of the service model of the Internet.
While a number of access providers and service platforms have made significant progress in public IPv6 deployments for their respective customers, the majority of the Internet user base (slightly under two thirds of the Internet’s user base) is still exclusively using IPv4 as of the end of 2022 (Figure 33).
The predictions as to the future profile of the routing environment for IPv4 and IPv6 that use extrapolation from historical data can only go so far in providing a coherent picture for the near-term future. As well as the technical issues relating to the evolution of IP technology and the IPv6 transition there are also broader factors such as the state of the global communications economy and the larger global economy. Investment in communications infrastructure, as with most other forms of infrastructure investment is not generally a short-term proposition. The major benefits tend to be realised in increased efficiency of economic production, rather than short-term windfall gains from infrastructure investment. This means that short term expedient measures, such as a response to a global pandemic or a rapid escalation of energy prices due to regional conflict, can interrupt infrastructure investment programs. The question behind the recent slowing of the growth in both the IPv4 and IPv6 aspects of the Internet’s routing space is whether this slowdown is due to market saturation in the case of IPv4 or a dissipation of collective market impetus in the case of IPv6, or an interruption due to these short-term exogenous market factors. In the latter case we would expect growth to resume once more when the current global market conditions dissipate, while an underlying condition of market saturation is a more permanent state.
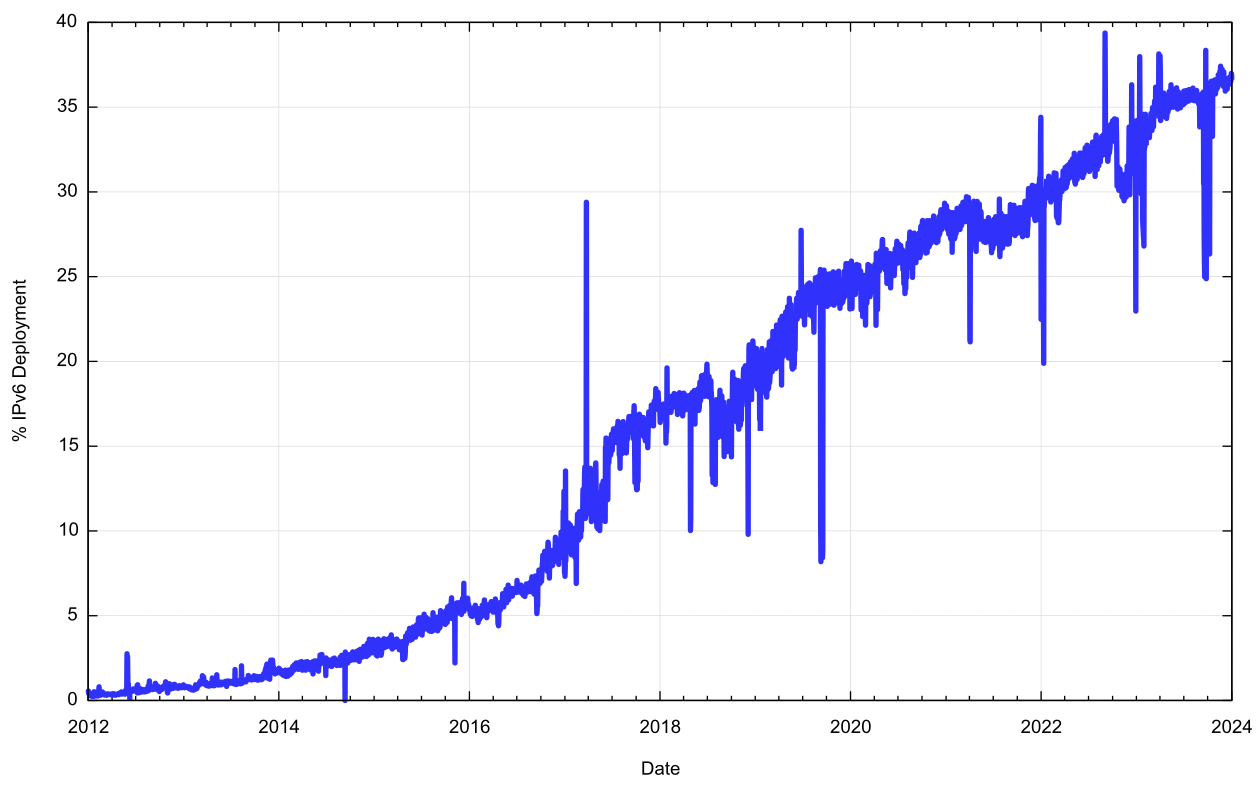
Figure 34 -IPv6 Deployment 2012 – 2024
If the concern is that the routing system is growing at a rate that is faster than our collective ability to throw available technology at it, then there is no serious cause for alarm in the current trends of growth in the routing system. There is no evidence of the imminent collapse of BGP. Far from it!
However, the size of the inter-domain routing table is only one half of the story. The stability of the routing system is also very important, and to complete this look at the routing system in 2023 we will also need to look at the dynamic behaviour of the routing system. The profile of BGP update churn in 2023 is a topic we’ll look at in detail in the next article that looks at the larger picture of addressing and routing across 2023.