On the 6th June 2012 we held the World IPv6 Launch Day. Unlike the IPv6 event of the previous year, World IPv6 Day, where the aim was to switch on IPv6 on as many major online services as possible, the 2012 program was somewhat different. This time the effort was intended to encourage service providers to switch on IPv6 and leave it on.
What has happened since then? Have we switched it on and left it on? What has changed in the world of IPv6 over the past 12 months? Who’s been doing all the work? In this article I’d like to undertake a comparison of then and now snapshots of IPv6 deployment data. For this exercise I’m using the data set that we have collected using a broad based sampling of Internet users through online-advertisements.
This approach to measurement has been described in a previous article. The daily snapshots of the V6 measurement can be found at http://labs.apnic.net/dists/v6dcc.html, and the breakdown of this data by economy and by provider can be found at http://labs.apnic.net/ipv6-measurement/Economies/ and http://labs.apnic.net/ipv6-measurement/AS/.
Let’s look at the big number picture first.
A year ago, in June 2012, we measured some 0.60% of the world’s Internet user population that was able to successfully retrieve a dual stack web object using IPv6. At the time the estimate of the total user population of the Internet was some 2.24B users, so 0.60% equates to 13.5M users who were using a working IPv6 protocol stack, and preferring to use IPv6 when given a choice of protocols by a dual stack service.
What does it look like one year later?
In June 2013 We see a rolling average of 1.29% of the Internet’s users who are preferring to use IPv6 when presented with a dual stack object to fetch. With a current estimate of Internet user population of an estimated 2.43B users, that figure equates to a count of 29.3 M users.
In one sense a growth of 0.60% to 1.29% of the Internet sounds like very small steps, but at the same time a growth in users from 13.5M to 29.3M users is indeed a significant achievement in 12 months, and is easily doubling the extent of IPv6 use in this period.
The tracking of this metric across the past 12 months is shown in Figure 1. There is some indication that there was a significant exercise in the deployment of IPv6 in June 2012 at the time of the World Ipv6 Launch event, but also some evidence of shutting IPv6 down in some parts of the network in the months thereafter. There was another cycle of growth and decline in the period November 2012 to March 2013, and another period of further growth from March 2013 until the present day.
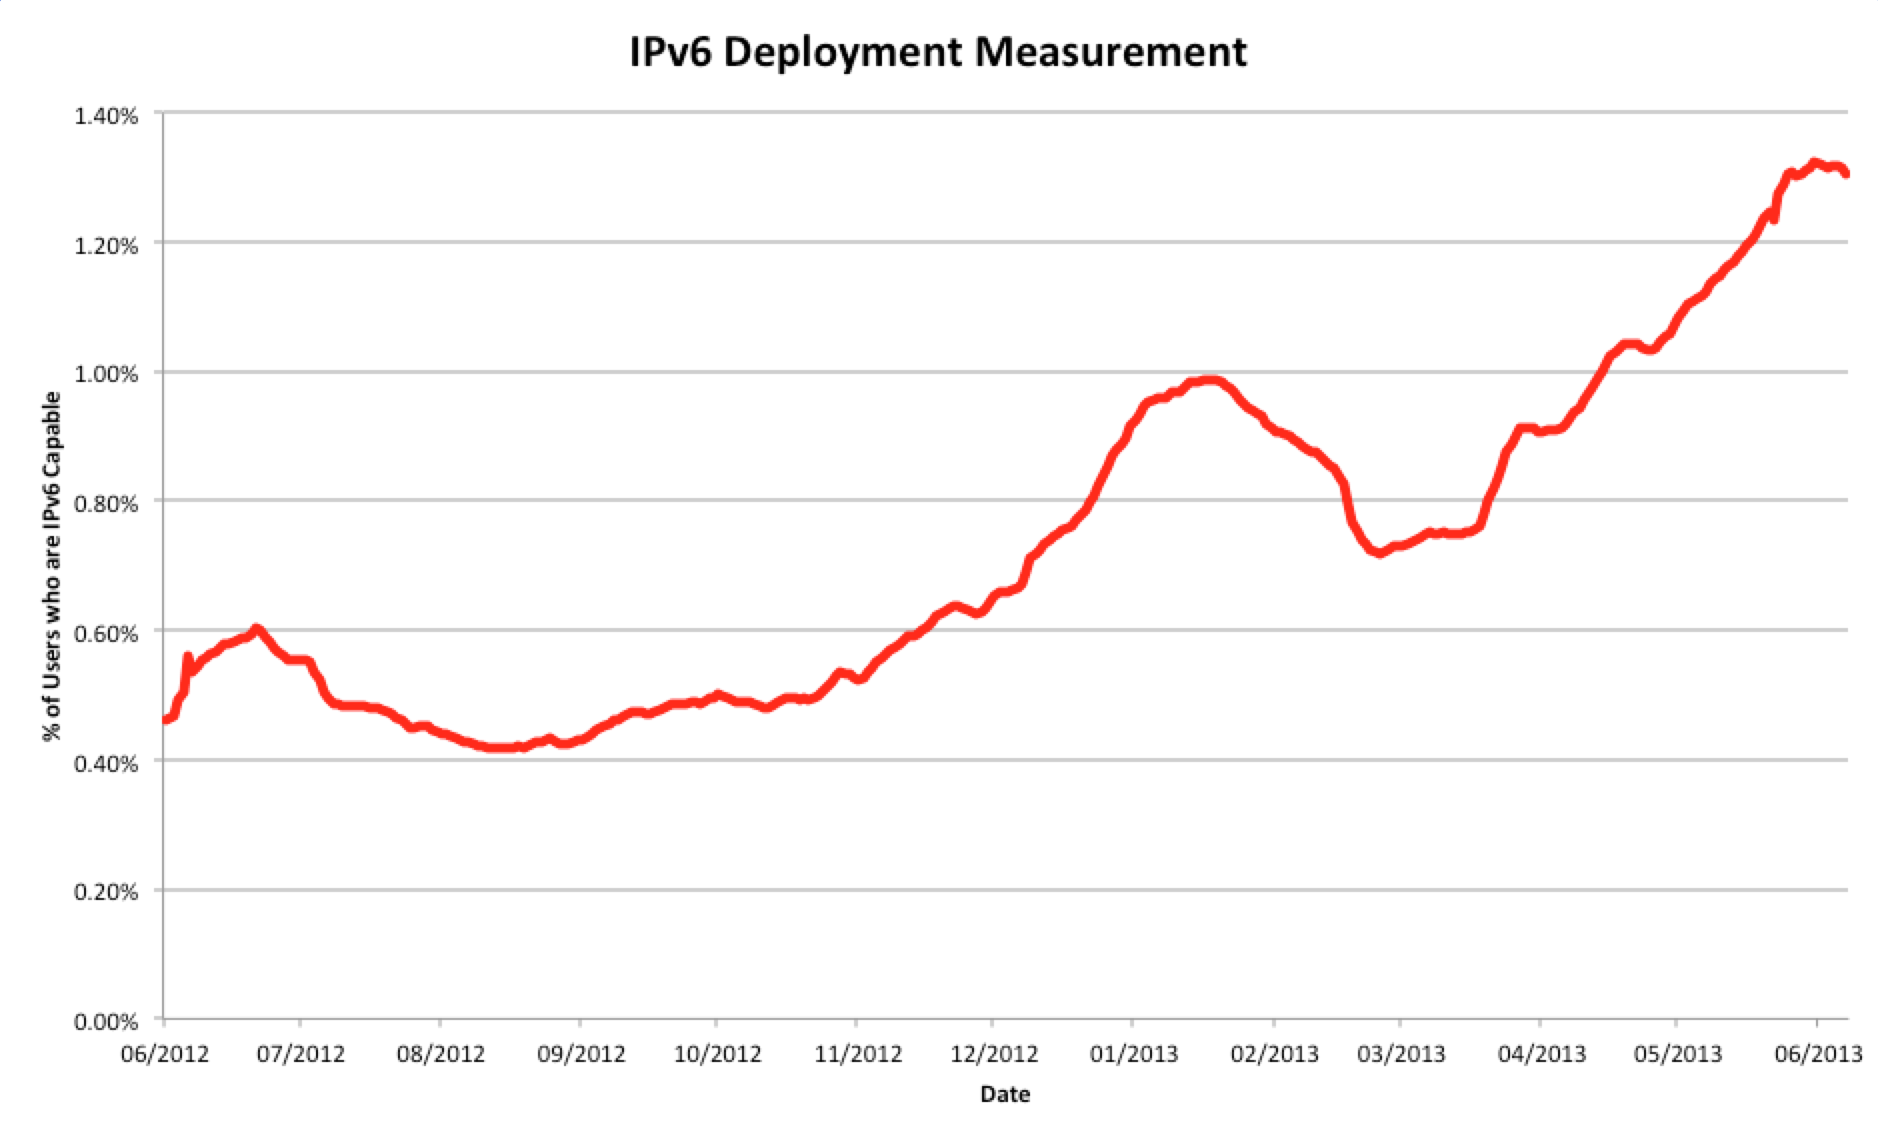
Figure 1 – IPv6 Deployment: June 2012 – June 2013
Where did IPv6 happen?
One way to look at IPv6 deployment is by looking at IPv6 deployment efforts on a country-by-country basis. Which countries were leading the IPv6 deployment effort twelve months ago?
Table 1 contains the list of the top 20 countries, ordered by percentage of the Internet user population who are showing that they can use IPv6, from June 2012.
| 2012 Rank |
Economy | % of Internet Users who use IPv6 |
# of IPv6 Users |
1 | Romania | 7.40% | 641,389 | 2 | France | 4.03% | 2,013,920 | 3 | Luxembourg | 2.59% | 12,049 | 4 | Japan | 1.75% | 1,766,799 | 5 | Slovenia | 1.07% | 15,175 | 6 | United States of America | 1.01% | 2,500,684 | 7 | China | 1.01% | 5,209,030 | 8 | Croatia | 0.85% | 22,551 | 9 | Switzerland | 0.80% | 51,575 | 10 | Lithuania | 0.66% | 13,845 | 11 | Czech Republic | 0.55% | 39,694 | 12 | Norway | 0.51% | 23,333 | 13 | Slovakia | 0.44% | 19,112 | 14 | Russian Federation | 0.39% | 238,576 | 15 | Germany | 0.32% | 217,494 | 16 | Hungary | 0.31% | 19,896 | 17 | Portugal | 0.30% | 16,406 | 18 | Netherlands | 0.27% | 40,870 | 19 | Australia | 0.25% | 49,425 | 20 | Taiwan | 0.24% | 38,843 |
Table 1 – IPv6 Deployment, ranked by % of national users: June 2012
That's an interesting list. There are some economies in this list that were also rapid early adopters of the internet, such as the United States, Japan, Norway and the Netherlands, and also some of the larger economies, such as the France, Japan, the United States, the Russian Federation and Germany, who are members of the G8 (Italy, the United Kingdom and Canada are the other members of the G8). Some 15 of the 20 are European economies, and neither South America or Africa are represented on this list at all.
Also surprising is the top economy at the time. The efforts in Romania earlier in 2012 to provision their fixed and mobile service network with IPv6 produced an immediate effect, and by June 2012 some 7.4% of their user base was using IPv6, after commencing the public deployment of IPv6 in late April 2012.
Interestingly, in percentage terms, the numbers trail off quickly, so that only 10 countries were above the global average, and by the time you get to the 20th ranked economy in this list, Taiwan, the level of IPv6 deployment is rate was some 0.24%. So the overall picture could be described as “piecemealâ€, with some significant efforts in just a small number of countries to deploy IPv6.
There is another way to look at this 2012 list, which is to perform the same ranking of economies by the population of IPv6 users, as shown in the following table:
| 2012 Rank |
Economy | % of Internet Users who use IPv6 |
# of IPv6 Users |
1 | China | 1.01% | 5,209,030 | 2 | United States of America | 1.01% | 2,500,684 | 3 | France | 4.03% | 2,013,920 | 4 | Japan | 1.75% | 1,766,799 | 5 | Romania | 7.40% | 641,389 | 6 | Russian Federation | 0.39% | 238,576 | 7 | Germany | 0.32% | 217,494 | 8 | Indonesia | 0.17% | 94,543 | 9 | Switzerland | 0.80% | 51,575 | 10 | Australia | 0.25% | 49,425 | 11 | United Kingdom | 0.08% | 41,461 | 12 | Netherlands | 0.27% | 40,870 | 13 | Czech Republic | 0.55% | 39,694 | 14 | Taiwan | 0.24% | 38,843 | 15 | India | 0.03% | 36,881 | 16 | Ukraine | 0.21% | 31,933 | 17 | Malaysia | 0.18% | 30,034 | 18 | Thailand | 0.15% | 27,617 | 19 | Brazil | 0.03% | 26,051 | 20 | Nigeria | 0.06% | 25,149 |
Table 2 – IPv6 Deployment, ranked by IPv6 users: June 2012
Of the 13.5M IPv6 users a year ago, some 5M were located in China, and between the four economies of China, the United States, France and Japan we can account for 85% of the total estimated IPv6 users of June 2012. This observation illustrates a somewhat fragmented approach to IPv6 adoption in mid 2012, where Internet Service Providers in small number of economies had made some significant levels of progress, while in other economies the picture of IPv6 deployment ranged from experimental or highly specialised programs through to simply non-existent.
There are a number of interesting entrants in this economy list, including India, Brazil and Nigeria, which point to some levels of experimentation by some service providers in the provision of IPv6 services in other economies. Hopefully this experimentation was a precursor to subsequent wider deployment programs.
Was this this case? What has happened in the ensuing year?
Here are the same two tables, using IPv6 use data as of June 2013, showing a comparable perspective of IPv6 deployment as it stands today.
| 2013 Rank |
Economy | % of Internet Users who use IPv6 |
# of IPv6 Users |
1 | Romania | 10.84% | 1,053,237 | 2 | Switzerland | 10.72% | 700,777 | 3 | Luxembourg | 6.96% | 32,535 | 4 | France | 5.46% | 2,824,465 | 5 | Belgium | 4.17% | 339,651 | 6 | Japan | 4.13% | 4,137,476 | 7 | Germany | 3.24% | 2,212,062 | 8 | United States of America | 2.72% | 6,768,264 | 9 | Peru | 2.42% | 273,370 | 10 | Czech Republic | 2.12% | 157,203 | 11 | Singapore | 1.58% | 54,060 | 12 | Norway | 1.21% | 53,677 | 13 | Slovenia | 0.92% | 13,230 | 14 | China | 0.90% | 4,651,953 | 15 | Greece | 0.78% | 44,572 | 16 | Portugal | 0.76% | 45,408 | 17 | Taiwan | 0.72% | 120,180 | 18 | Netherlands | 0.70% | 109,425 | 19 | Australia | 0.69% | 121,256 | 20 | Slovakia | 0.52% | 21,169 |
Table 3 – IPv6 Deployment, ranked by % of national users: June 2013
This table clearly shows that Switzerland, Belgium, Germany, Peru, the Czech Republic and Greece have made a significant change in their level of IPv6 deployment in the last 12 months. We now see 7 of the 20 economies as being non-European economies. Eleven of these economies have IPv6 usage rates above the global average of 1.3%, an increase of 2 since 2012.
We can plot these numbers onto a world map, as shown in Figure 2, using a colouring scale from 0 to 4% of each national Internet user population that is capable of using IPv6.
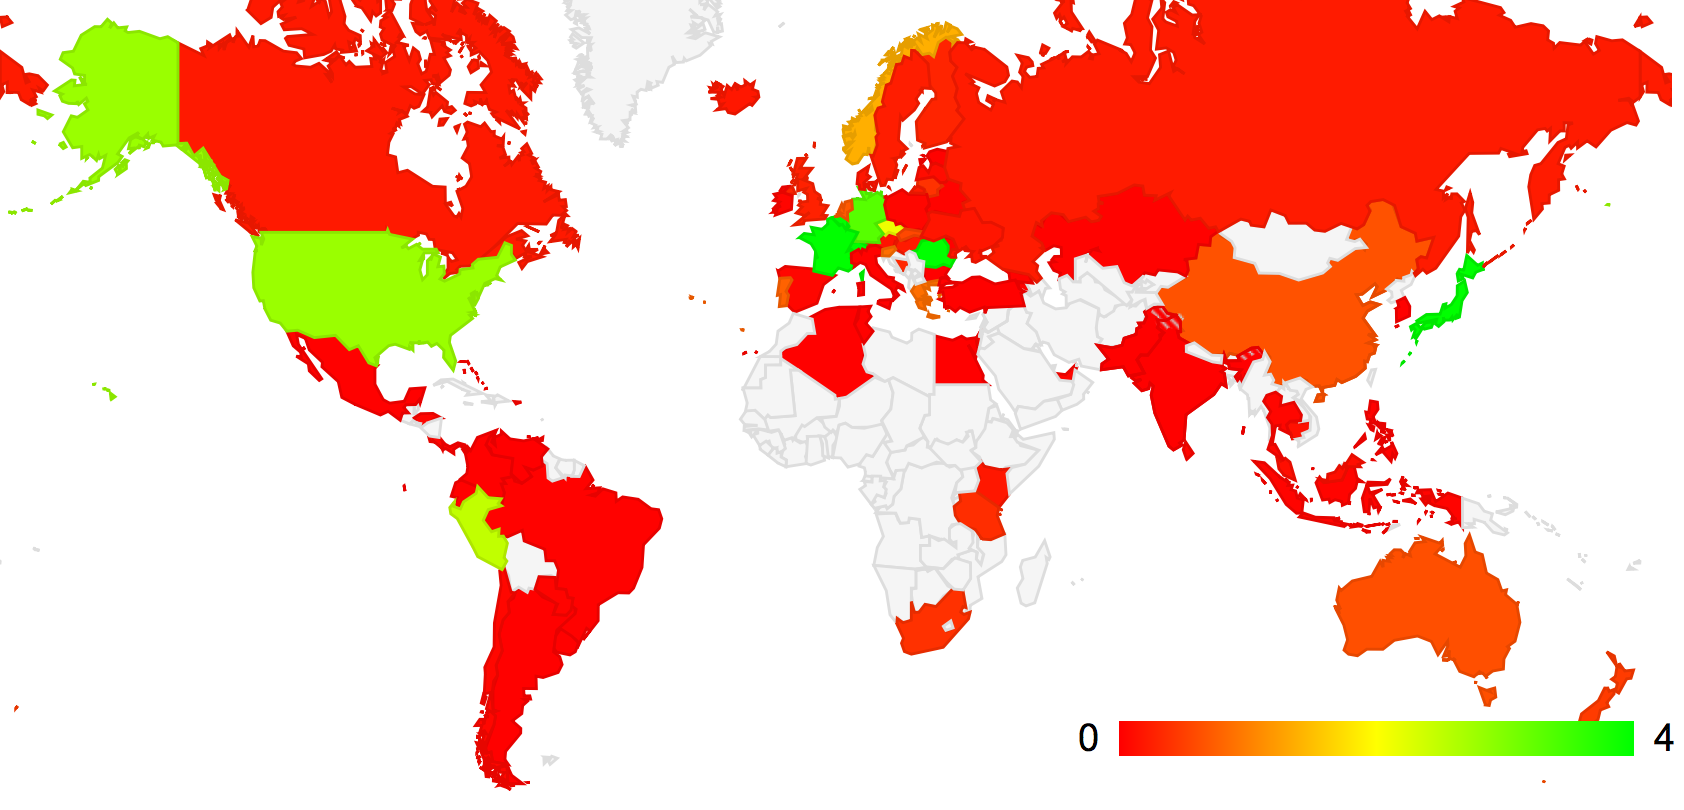
Figure 2 – IPv6 Deployment, ranked by % of national users: June 2013
The following table shows the estimated IPv6 user population per economy in June 2013.
| 2013 Rank |
Economy | % of Internet Users who use IPv6 |
# of IPv6 Users |
1 | United States of America | 2.72% | 6,768,264 | 2 | China | 0.90% | 4,651,953 | 3 | Japan | 4.13% | 4,137,476 | 4 | France | 5.46% | 2,824,465 | 5 | Germany | 3.24% | 2,212,062 | 6 | Romania | 10.84% | 1,053,237 | 7 | Switzerland | 10.72% | 700,777 | 8 | Belgium | 4.17% | 339,651 | 9 | Peru | 2.42% | 273,370 | 10 | Czech Republic | 2.12% | 157,203 | 11 | Russian Federation | 0.21% | 143,677 | 12 | United Kingdom | 0.27% | 135,076 | 13 | Australia | 0.69% | 121,256 | 14 | Taiwan | 0.72% | 120,180 | 15 | Netherlands | 0.70% | 109,425 | 16 | Canada | 0.19% | 55,492 | 17 | Singapore | 1.58% | 54,060 | 18 | Norway | 1.21% | 53,677 | 19 | Portugal | 0.76% | 45,408 | 20 | Greece | 0.78% | 44,572 |
Table 4 – IPv6 Deployment, ranked by IPv6 users: June 2013
Again the distribution of IPv6 users appears to be somewhat is skewed, in so far as just 5 economies account for 85% of the total population of IPv6 users in June 2013, which is the same four economies of United States, Japan, France, and China, but this time joined by Germany. Unfortunately we no longer see India, Brazil or Nigeria in this top 20 economy list. The top 20 economies cut off has risen from 38,000 IPv6 users per economy to 44,000, so unless there was some form of continued expansion of IPv6 deployment (such as the United Kingdom’s rise from 41,000 users in mid-2012 to 135,000 in mid-2013), the economies at the lower end of the top 20 in 2012 were likely to slip off the top 20 list if there was no continued expansion of their IPv6 program through the year.
In percentage terms what has changed over the past 12 months? The following table compares the values from mid 2012 to the values in mid-2013. The first table lists the top 20 economies who have lifted the percentage of their users who are capable of using IPv6, ranked by the rate of change of this percentage value.
| 2013 Rank |
Economy | Diff (%) | Diff IPv6 User Count |
1 | Switzerland | +9.92% | +649,202 | 2 | Luxembourg | +4.37% | +20,486 | 3 | Belgium | +4.07% | +331,153 | 4 | Romania | +3.44% | +411,848 | 5 | Germany | +2.92% | +1,994,568 | 6 | Peru | +2.41% | +272,327 | 7 | Japan | +2.38% | +2,370,677 | 8 | United States of America | +1.71% | +4,267,580 | 9 | Czech Republic | +1.57% | +117,509 | 10 | Singapore | +1.43% | +48,524 | 11 | France | +1.43% | +810,545 | 12 | Greece | +0.70% | +40,530 | 13 | Norway | +0.70% | +30,344 | 14 | Taiwan | +0.48% | +81,337 | 15 | Portugal | +0.46% | +29,002 | 16 | Australia | +0.44% | +71,831 | 17 | Netherlands | +0.43% | +68,555 | 18 | New Zealand | +0.35% | +13,174 | 19 | South Africa | +0.33% | +34,022 | 20 | Bosnia and Herzegovina | +0.32% | +8,914 |
Table 5 – IPv6 Deployment, ranked by % of national users: change from June 2012 to June 2013
The largest change was Switzerland, where a further 10% of their users were able to use IPv6, and significant efforts were visible in Luxembourg, Belgium, Romania, Germany, Peru and Japan in terms of the ratio of IPv6 users in each economy.
In terms of user population who are IPv6-capable, the table of economies who deployed IPv6 over the largest set of users is provided in Table 6.
Obviously one economy where there has been substantial effort in the past 12 months has been the United States, where some additional 4.2M users are now using IPv6 in just 12 months. That is an extremely impressive effort. Similarly, there has been a significant effort in Japan and Germany.
It also should be noted that as or April 2011 the further provision of IPv4 addresses through the conventional Regional Internet Registry allocation system had ceased for the Asia Pacific region, so a case could be made that the efforts this region, including those of Japan, Tawian, Australia and New Zealand were spurred on by this event. Similarly the Regional Internet Registry serving Europe and the Middle East also exhausted its pools of available IPv4 addresses in September 2012, which may have some bearing on the IPv6 efforts in Germany, France, Switzerland Romania. Belgium, the Czech Republic, the United Kingdom, the Netherlands, Greece, Norway, Portugal and Luxembourg. However, IPv4 addresses are still available for service providers in North and South America and in Africa, which makes the efforts in the United States all the more laudable for their prudence.
| 2013 Rank |
Economy | Diff (%) | Diff IPv6 User Count |
1 | United States of America | +1.71% | +4,267,580 | 2 | Japan | +2.38% | +2,370,677 | 3 | Germany | +2.92% | +1,994,568 | 4 | France | +1.43% | +810,545 | 5 | Switzerland | +9.92% | +649,202 | 6 | Romania | +3.44% | +411,848 | 7 | Belgium | +4.07% | +331,153 | 8 | Peru | +2.41% | +272,327 | 9 | Czech Republic | +1.57% | +117,509 | 10 | United Kingdom | +0.19% | +93,615 | 11 | Taiwan | +0.48% | +81,337 | 12 | Australia | +0.44% | +71,831 | 13 | Netherlands | +0.43% | +68,555 | 14 | Singapore | +1.43% | +48,524 | 15 | Greece | +0.70% | +40,530 | 16 | South Africa | +0.33% | +34,022 | 17 | Canada | +0.11% | +33,104 | 18 | Norway | +0.70% | +30,344 | 19 | Portugal | +0.46% | +29,002 | 20 | Luxembourg | +4.37% | +20,486 |
Table 6 – IPv6 Deployment, ranked by national users: change from June 2012 to June 2013
Also it would appear that Europe remains a strong focal point for IPv6 deployment at present, while the deployment in other regions is far more piecemeal. Although I must mention Peru and South Africa in this context as two highly notable exceptions to this general observation.
And where is China in June 2013? What we saw in our measurements is a relative decline in the population of users who are seen to use IPv6 from June 2012 to June 2013. This decline was estimated to be some 557,000 users. One of the more variable factors for China is the role of the national firewall structure, and its capabilities with respect to IPv6, and as the IPv6 measurement system was hosted outside of China, the measurements relating to Chinese use of IPv6 are dependant on the behaviour of this filter structure. It is possible that the firewall has different behaviours for IPv6, and equally possible that these behaviours have altered over time. It could well be that an internal view of China would have a different result than that which we see from outside the country.
It is also possible to provide some insights as to which ISPs are undertaking this activity, by tracing the originating Autonomous System number of the user’s IP address who have provided capability data to this measurement exercise. The following is a list of some of the larger Service Providers that are showing some significant levels of activity in the past 12 months with IPv6. The list is by no means exhaustive, but it is intended to highlight those providers that have been seen to make significant changes in their IPv6 capability measurements over the past 12 months in the economies listed in Table 6. The percentage figures provided in the list are the percentage of clients whose IP address is originated by these AS’s who are able to use IPv6 in June 2012 and in June 2013.
| 2Economy | AS Number | AS Name | 2012 IPv6 (%) | 2013 IPv6 (%) |
| United States of America | AS6939 | Hurricane Electric | 29% | 37% | AS22394 | Cellco Partnership DBA Verizon Wireless | 6% | 20% | AS7018 | AT&T Services | 6% | 15% | AS3561 | Savvis | 0.7% | 5% | AS7922 | Comcast | 0.5% | 2.7% |
| Japan | AS2516 | KDDI | 16% | 27% | AS18126 | Chubu Telecommunications | 0.2% | 23% | AS17676 | Softbank | 0.5% | 4% |
| Germany | AS3320 | Deutsche Telekom AG | 0.01% | 4.9% | AS31334 | Kabel Deutschland | 1.18% | 7.4% | AS29562 | Kabel BW GmbH | 0% | 10.2% |
| France | AS12322 | Free SAS | 19% | 22% |
| Switzerland | AS67722 | Swisscomm | 0.2% | 23% | AS559 | Switch; Swiss Education and Research Network | 11% | 18% |
| Romania | AS8708 | RCS & RDS SA | 11.5% | 24.7% |
| Belgium | AS12392 | Brutele SC | 0% | 33% | AS2611 | BELNET | 2.6% | 22.4% |
| Peru | AS6147 | Telefonica del Peru SA | 0% | 3.1% |
| Czech Republic | AS2852 | CESNET z.s.p.o. | 20% | 27% | AS5610 | Telefonica Czech Republic; a.s. | 0% | 3.5% | AS51154 | Internethome; s.r.o. | 0% | 2.8% |
| United Kingdom | AS786 | The JNT Association (JANET() | 51% | 68% | AS13213 | UK2 Ltd | 0% | 23% |
| Taiwan | AS9264 | Academic Sinica Network | 0% | 21% | AS1659 | Taiwan Academic Network | 1.6% | 7.6% |
| Australia | AS7575 | Australian Academic and Research Network | 13% | 21% | AS4739 | Internode | 5% | 11% |
| Netherlands | AS3265 | XS4ALL Internet BV | 6% | 27% |
| Singapore | AS7472 | Starhub Internet Pte Ltd | 0% | 13% | AS4773 | MobileOne Ltd. | 0% | 10% |
| Greece | AS5408 | Greek Research and Technology Network S.A | 17% | 19% |
| South Africa | AS2018 | TENET | 0.3% | 3% |
| Canada | AS6453 | TATA Communications | 10% | 13% | AS22995 | Xplornet Communications Inc | 0.1% | 9% |
| Norway | AS224 | Uninett; The Norwegian University and Research Network | 16% | 24% | AS39832 | Opera Software ASA | 1.3% | 100% | AS57963 | Lynet Internett | 0% | 56% |
| Portugal | AS3243 | PT Comunicacoes S.A. | 0.01% | 1.3% |
| Luxembourg | AS6661 | Entreprise des Postes et Telecommunications | 4% | 14% |
Table 7 – IPv6 Deployment 2012-2013, Selected Autonomous System Measurements
What can we say about the state of IPv6 deployment one year after the commencement of the IPv6 Launch program?
The encouraging news is that overall numbers of IPv6-capable end users have doubled in 12 months. The measurements presented here support an estimate that today some 30 million Internet users who will use IPv6 when they can.
But this is not happening everywhere. Indeed, it is happening in a small number of countries, with still a relatively small set of service providers. What we appear to be seeing are concentrated areas of quite intense IPv6 activity. Many national academic and research networks have been highly active in supporting IPv6 deployment within their network. In the commercial networks we are seeing a number of major commercial network service operators, primarily in the United States, Japan, Germany, France, Switzerland and Romania, launch programs that integrate IPv6 services into their retail offerings. Whether this effort will provide sufficient impetus to motivate other providers to also commit to a similar program of IPv6 deployment is perhaps still an open issue today, but there is some evidence that there is now a building momentum and an emerging sense of inexorable progress with the deployment of IPv6.
We'll be continuing these measurements, and providing further insights as to where we can see IPv6 deployment underway across the Internet over the coming months. You can find daily reports of our measurements, including breakdowns by economy and tracking of progress with IPv6 for individual network service providers at http://labs.apnic.net/ipv6-measurement. If you would like to assist us in this measurement exercise we’d obviously like to hear from you&emdash;drop us a note to research@apnic.net.